Giter Club home page Giter Club logo

enrichedheatmap's Introduction

Anurag's github stats

Activities on my repos (R packages, 2013-04-18 ~ 2022-12-10): (code for generating this plot: https://jokergoo.github.io/spiralize_vignettes/examples.html#github-commits)

code
library(spiralize)
library(grid)

repos = c("GlobalOptions", "GetoptLong", "circlize", "bsub", "pkgndep", "ComplexHeatmap", "EnrichedHeatmap", 
    "HilbertCurve", "gtrellis", "cola", "simplifyEnrichment", "InteractiveComplexHeatmap", "spiralize", "rGREAT", "simona")

df_all = data.frame(commits = numeric(0), date = character(0), repo = character(0))
for(r in repos) {
    # go to each repo folder
    setwd(paste0("~/project/development/", r))
    df = read.table(pipe("git log --date=short --pretty=format:%ad | sort | uniq -c"))
    colnames(df) = c("commits", "date")
    df$repo = r

    df_all = rbind(df_all, df)
}

df_all$date = as.Date(df_all$date)

start = min(df_all$date)
end = max(df_all$date)

d = start + seq(1, end - start + 1) - 1
n = numeric(length(d))
nl = lapply(repos, function(x) numeric(length(d)))
names(nl) = repos

for(i in seq_len(nrow(df_all))) {
    ind = as.double(difftime(df_all[i, "date"], start), "days") + 1
    n[ind] = n[ind] + df_all[i, "commits"]

    nl[[ df_all[i, "repo"] ]][ind] = nl[[ df_all[i, "repo"] ]][ind] + df_all[i, "commits"]
}

calc_pt_size = function(x) {
    pt_size = x
    pt_size[pt_size > 20] = 20
    pt_size[pt_size < 2 & pt_size > 0] = 2
    pt_size
}
xlim = range(d)

pl = list()
pl[[1]] = grid.grabExpr({
    spiral_initialize_by_time(xlim, verbose = FALSE, normalize_year = TRUE)
    spiral_track()
    spiral_points(d, 0.5, pch = 16, size = unit(calc_pt_size(n), "pt"))
    grid.text("All packages", x = 0, y = 1, just = c("left", "top"), gp = gpar(fontsize = 14))

    for(t in c("2013-01-01", "2014-01-01", "2015-01-01", "2016-01-01", "2017-01-01",
               "2018-01-01", "2019-01-01", "2020-01-01", "2021-01-01", "2022-01-01", "2023-01-01")) {
        spiral_text(t, 0.5, gsub("-\\d+-\\d+$", "", as.character(t)), gp = gpar(fontsize = 8), facing = "inside")
    }
})

for(i in order(sapply(nl, sum), decreasing = TRUE)) {
    pl[[ names(nl)[i] ]] = grid.grabExpr({
        spiral_initialize_by_time(xlim, verbose = FALSE, normalize_year = TRUE)
        spiral_track()
        spiral_points(d, 0.5, pch = 16, size = unit(calc_pt_size(nl[[i]]), "pt"))
        grid.text(names(nl)[i], x = 0, y = 1, just = c("left", "top"), gp = gpar(fontsize = 14))

        for(t in c("2013-01-01", "2014-01-01", "2015-01-01", "2016-01-01", "2017-01-01",
                   "2018-01-01", "2019-01-01", "2020-01-01", "2021-01-01", "2022-01-01", "2023-01-01")) {
            spiral_text(t, 0.5, gsub("-\\d+-\\d+$", "", as.character(t)), gp = gpar(fontsize = 8), facing = "inside")
        }
    })
}

library(cowplot)
png("~/test.png", 300*4*1.5, 300*4*1.5, res = 72*1.5)
plot_grid(plotlist = pl, ncol = 4)
dev.off()

test

enrichedheatmap's People

Contributors

cola-recount2 avatar dtenenba avatar hpages avatar jimhester avatar jokergoo avatar jwokaty avatar link-ny avatar nturaga avatar petehaitch avatar vobencha avatar

Stargazers

 avatar  avatar  avatar  avatar  avatar  avatar  avatar  avatar  avatar  avatar  avatar  avatar  avatar  avatar  avatar  avatar  avatar  avatar  avatar  avatar  avatar  avatar  avatar  avatar  avatar  avatar  avatar  avatar  avatar  avatar  avatar  avatar  avatar  avatar  avatar  avatar  avatar  avatar  avatar  avatar  avatar  avatar  avatar  avatar  avatar  avatar  avatar  avatar  avatar  avatar  avatar  avatar  avatar  avatar  avatar  avatar  avatar  avatar  avatar  avatar  avatar  avatar  avatar  avatar  avatar  avatar  avatar  avatar  avatar  avatar  avatar  avatar  avatar  avatar  avatar  avatar  avatar  avatar  avatar  avatar  avatar  avatar  avatar  avatar  avatar  avatar  avatar  avatar  avatar  avatar  avatar  avatar  avatar  avatar  avatar  avatar  avatar  avatar  avatar  avatar

Watchers

 avatar  avatar  avatar  avatar  avatar  avatar  avatar  avatar  avatar  avatar  avatar  avatar

enrichedheatmap's Issues

row order when plotting multiple heatmap

I may be wrong? But, I noticed when doing multiple heatmap like in the example that plot H3K4me3, methylation and log2(rpkm+1), if you didn't specify row_order in each heatmap calls (Heatmap and EnrichedHeatmap), the row order in each of this multiple heatmaps is not the same. (i.e. it doesn't plot the same region across heatmap and therefore the rpkm is also not the correct genes) ?
Did I miss something? Thanks.

SUGGESTION: More efficient code using matrixStats (>= 0.50.0)

In matrixStats (>= 0.50.0), which is now on CRAN, we introduce support for subsetted calculations that are optimized both for speed and memory usage. There are now new arguments idxs, rows and cols for most functions which allow you to very easily make use of this.

For your package, I believe the following functions could gain from this:

$EnrichedHeatmap$anno_enriched
colSds(mat[i, , drop = FALSE])

by updating to something like:

$EnrichedHeatmap$anno_enriched
colSds(mat, rows=i)

and adding matrixStats (>= 0.50.0) to your DESCRIPTION file.

Custom ticks and label position at x-axis

Hey Zuguang,

is there an option to remove the ticks at the x-axis except those at the upper/lower limit and at the center position while centering the labels at these positions as shown in this manual edit below?

Thanks!
-Alex

Screen Shot 2019-08-16 at 11 44 43

Position line color not uniform for top annotation and main heatmap body

Hi Zuguang,

I am using the latest updated EnrichedHeatmap package (v1.13.1) from GitHub. I wanted to change position line color using pos_line_gp option. I noticed that when I change the color in gpar() argument, the line color is not changed for top annotation. The color is reflected correctly for main heatmap body whereas the top annotation position line is still in default black color. Please refer below for the reproducible example.

library(EnrichedHeatmap)

set.seed(123)
load(system.file("extdata", "chr21_test_data.RData", package = "EnrichedHeatmap"))

tss = promoters(genes, upstream = 0, downstream = 1)

mat1 = normalizeToMatrix(H3K4me3, tss, value_column = "coverage", 
                         extend = 5000, mean_mode = "w0", w = 50)


col_fun = circlize::colorRamp2(quantile(mat1, c(0, 0.99)), c("white", "red"))

## color of the position line is different for annotation and heatmap body
EnrichedHeatmap(
  mat1, col = col_fun, name = "H3K4me3", row_km = 3,
  top_annotation = HeatmapAnnotation(
    enriched = anno_enriched(
      gp = gpar(col = 2:4, lty = 1:3)),
    annotation_height = unit(4, "cm")
  ),
  column_title = "Enrichment of H3K4me3", row_title_rot = 0,
  pos_line_gp = gpar(lty = 2, col = "#F4A460", lwd = 1))

rplot

Thank you!
~Lakhan.

question on color scale on multiple heatmaps

Hi,

It is a more general question on ComplexHeatmaps as well. If I am plotting multiple matrix on a single figure. The color scale is the same across all heatmaps by default?

in the help page

It seems one can map color to values differently in different heatmaps:

f1 = colorRamp2(seq(min(mat), max(mat), length = 3), c("blue", "#EEEEEE", "red"))
f2 = colorRamp2(seq(min(mat), max(mat), length = 3), c("blue", "#EEEEEE", "red"), space = "RGB")
Heatmap(mat, col = f1, column_title = "LAB color space") +
Heatmap(mat, col = f2, column_title = "RGB color space")

For EnrichedHeatmap, I usually do only specify col=c("white","red"), how does this exactly mapped to the numeric values in the matrix? and the value to color mapping will be the same across all the heatmaps?

A side question would be if I want to add a line annotation in one heatmap, I can add
top_annotation = HeatmapAnnotation(lines = anno_enriched())

or if I do a clustering (k-means) on the same heatmap (matrix), I can

top_annotation = HeatmapAnnotation(lines = anno_enriched(gp = gpar(col = 2:4)))

However, I want to add 2 lines for the same line graph from two different matrix (heatmap), so I can compare, how can I do it? I have a way to get around something like:

plot(colMeans(mat1))
plot(colMeans(mat2))

I can then use ggplot2 to make the two lines together...

Is there a way to do it inside EnrichedHeatmaps and I can put the line graph side by side the heatmaps?, now it has one line graph on top of each heatmap. Thanks for making such a useful package and being very responsive.

Best,
Ming

Detail normalization method used by normalizeToMatrix ?

Hi,

Sorry for the interruption.

Is it possible you could show me your normalization method used by normalizeToMatrix? I want to compare K27me3 signal between two samples but the sequencing depth is different. Usually I would do z-score normalization to make them comparable. I am wondering which method do normalizeToMatrix use, is it independent of sequencing depth?

I noticed that you said

Another advantage of using a color mapping function is that if you have more than one heatmaps to make, it makes colors in heatmaps comparable

So I think it doesn't suffer from sequencing depth...

Thanks in advance.

Adding rowname to enrichedHeatmap

Hi,

I have two Grange objects :

GRanges object with 3 ranges and 1 metadata column:
          seqnames                 ranges strand |     score
             <Rle>              <IRanges>  <Rle> | <numeric>
    APBB3     chr5 [140562659, 140562659]      * |   81.4911
  APBB3.1     chr5 [140562660, 140562665]      * |   39.7189
  APBB3.2     chr5 [140562666, 140562666]      * |    60.605
  -------
  seqinfo: 1 sequence from an unspecified genome; no seqlengths
GRanges object with 3 ranges and 2 metadata columns:
          seqnames                 ranges strand |        name     score
             <Rle>              <IRanges>  <Rle> | <character> <numeric>
    APBB3     chr5 [140562664, 140562664]      - | 0.201_APBB3         0
  APBB3.1     chr5 [140562664, 140562664]      - | 0.201_APBB3         0
  APBB3.2     chr5 [140562664, 140562664]      - | 0.201_APBB3         0

mat12 = normalizeToMatrix(gr_exons, gr_exon_list_start, value_column = "score", extend = c(opt$upstream, opt$downstream), mean_mode = "w0", w = 1)

png(file=paste0(c(dirname(opt$file),"final.png"),collapse="/"),width = 500,height=700)
EnrichedHeatmap(mat12, name = "H3K4me3", show_row_names = TRUE, width = unit(5, "mm"))
dev.off()

I got the following error...I'd like to have rownames added on the left of the enriched heatmap. What is going on here ? Thanks

Error in Heatmap(mat, row_order = od, cluster_columns = FALSE, cluster_rows = cluster_rows, : formal argument "show_row_names" matched by multiple actual arguments Calls: EnrichedHeatmap -> Heatmap

`getSignalsFromList` fails.

Hi,

I did the following:

l1.tss <- NULL
for(i in seq_along(l1.gr){
    l1.tss[[i]] <- normalizeToMatrix(l1.gr[[i]], cpg.obj$CpGi, value_column="meth", mean_mode = "absolute",  extend = 1000, w = 50, empty_value = NA, smooth = T, target_ratio=0.3)
}
l1.mat <- getSignalsFromList(l1.tss)
Error in attr(l1.tss[[1]], as.list("upstream_index", "target_index")) :
    exactly one attribute 'which' must be given

Any advice is appreciated.

normalizeToMatrix: do not want to extend, and target_ratio = 1

Hi,

I was wondering if there is a way to specify extend =0 , and only plot the genebody profile.
every gene is with different length, so I know the bin was calculated with percentage of each gene length.
The following will give me error.

normalizeToMatrix(meth, cgi, value_column = "meth", mean_mode = "absolute",
+                   extend = 0, empty_value = NA, smooth = TRUE, target_ratio = 1)
Error in if (any(extend%%w > 0)) { : 
  missing value where TRUE/FALSE needed

The reason is that I want actually use the whole chromosome arm as target. and extending will exceed the chromosome length. I want to use normalizeToMatrix to calculate the sum of my signal in windows binned as % of the chromosome arm length.

I know I can probably get around by changing your source code a bit, but you know better than me:)

Thanks,
Ming

top_annotation Error in unit(values, units, data = data) : 'x' and 'units' must have length > 0

Hi Zuguang,

After upgrading to the latest in github, my previous code is not working
for plotting chromatin state categorical matrix:
This is fine

EnrichedHeatmap(mat_states_Rpre[ids,], name = "states_Rpre", col = states_col,
    column_title = "States Rpre", use_raster =T, raster_quality = 5)

This gives me error after adding top_annotation

Error in unit(values, units, data = data) : 
  'x' and 'units' must have length > 0
EnrichedHeatmap(mat_states_Rpre[ids,], name = "states_Rpre", col = states_col,
    column_title = "States Rpre", use_raster =T, raster_quality = 5,
    top_annotation = HeatmapAnnotation(lines = anno_enriched(gp = gpar(lty = 1:2), 
                                                              ylim = c(0,1)),annotation_height = 0.5))

Anything changed?

Thx!
Tommy

output bed regions along with each window coverage/score

Hi,

Thanks for the awesome package.

I was wondering if there is a way to get a data.frame/matrix of input regions along with the coverage of each window. Basically the data underlying the heatmap of EnrichedHeatmap.

Something like

region bin1 bin2 bin3....
chr1:1-10 1 4 3 ...
chr2:14-20 5 7 9...

Any leads would be appreciated. Thanks.

how to use row_split and add annotation heatmap for the split

Hello,

I'm using row_split to divide the heatmap into three sections which I then annotate by adding another heatmap (mimicking the code here). However, the rows of the heatmap is no longer sorted when I added the heatmap annotation.
I have uploaded the image to run the code below: test_heatmap.RData
These are the codes I ran:

tss <- promoters(rna.ref.genes,upstream=0,downstream=1)
mat1=normalizeToMatrix(bw.gr,tss,value_column = "score",extend=5000, mean_mode = "w0", w = 50)
# heatmap with mean values across tss
axis_name = c("-5kb", "TSS", "5kb")
hm0=Heatmap(expr.102.not.85, 
 col = 2:4,name="Reg. by",show_row_names = FALSE,width=unit(3,"mm"))
hm1 = EnrichedHeatmap(mat1,column_title_gp = gpar(fontsize = 10),
 top_annotation = HeatmapAnnotation(lines=anno_enriched(gp=gpar(col=2:4,lwd=1.5))),
 axis_name=axis_name,
 show_row_names = FALSE)
draw(hm1,row_split=expr.102.not.85)

If I don't draw hm1, the rows of heatmap are sorted inside each section, which is what I wanted.
image
However if I changed the last line above to:

draw(hm0+hm1,row_split=expr.102.not.85)

The rows of heatmap is no longer sorted. How do I keep the rows sorted? Also, how do I supress the labels on the far left?
image

Thank you in advance for your help.

Mixed colors in top_annotations

Hello,

I'm having a problem where the colors on the top annotation is not matching the partition colors when I add an extra heatmap.

It is similar to Issue #35, except that the problem does not seem to have the same cause as I'm using a simple character vector for the colors.

What is confusing me is that producing two heatmaps with almost identical code is giving me different results:

Imgur

The one on the left is produced with this command:

draw(eh + hp, split = partitions)

The one on the right is produced with this command:

draw(ht_logfc + eh + hp, split = partitions)

In both case, the colors of the partition are what I expected, but in the second heatmap the colors are not matching in the top annotation.

Here is the complete code I used to produce this example:

library(EnrichedHeatmap)
library(circlize)
library(ggthemes)
library(magrittr)

load("test.RData")

set.seed(99841)
col_blind <- colorblind_pal()(length(unique(partitions)))

m <- normalizeToMatrix(test_cov, peaks, value_column = "score",
                       extend = 5000, mean_mode = "w0",w = 100)

ha <- HeatmapAnnotation(lines = anno_enriched(gp = gpar(col = col_blind),
                        axis_param = list(facing = "inside")))

eh <- EnrichedHeatmap(m, name = "test", column_title = "test",
                      top_annotation = ha)

ht_logfc <- Heatmap(logfc, name = "Fold Change", show_row_dend = FALSE,
                    width = unit(1, "cm"))

hp <- Heatmap(partitions, col = structure(col_blind), name = "",
              show_row_names = FALSE, width = grid::unit(3, "mm"))

draw(eh + hp, split = partitions)
draw(ht_logfc + eh + hp, split = partitions)

The test.RData file can be downloaded from:

I'm probably missing something obvious, but I can't find it.

Thank you very much for the help!
Charles.

Here is my sessionInfo:

R version 3.6.0 beta (2019-04-16 r76403)
Platform: x86_64-apple-darwin15.6.0 (64-bit)
Running under: macOS Mojave 10.14.4

Matrix products: default
BLAS:   /Library/Frameworks/R.framework/Versions/3.6/Resources/lib/libRblas.0.dylib
LAPACK: /Library/Frameworks/R.framework/Versions/3.6/Resources/lib/libRlapack.dylib

locale:
[1] en_CA.UTF-8/en_CA.UTF-8/en_CA.UTF-8/C/en_CA.UTF-8/en_CA.UTF-8

attached base packages:
 [1] parallel  stats4    grid      stats     graphics  grDevices utils
 [8] datasets  methods   base

other attached packages:
 [1] magrittr_1.5           ggthemes_4.2.0         circlize_0.4.6
 [4] EnrichedHeatmap_1.14.0 GenomicRanges_1.36.0   GenomeInfoDb_1.20.0
 [7] IRanges_2.18.1         S4Vectors_0.22.0       BiocGenerics_0.30.0
 [10] ComplexHeatmap_2.0.0

loaded via a namespace (and not attached):
 [1] Rcpp_1.0.1             compiler_3.6.0         pillar_1.4.1
 [4] RColorBrewer_1.1-2     XVector_0.24.0         tools_3.6.0
 [7] bitops_1.0-6           zlibbioc_1.30.0        tibble_2.1.3
 [10] gtable_0.3.0           lattice_0.20-38        clue_0.3-57
 [13] pkgconfig_2.0.2        png_0.1-7              rlang_0.3.4
 [16] GenomeInfoDbData_1.2.1 stringr_1.4.0          dplyr_0.8.1
 [19] cluster_2.1.0          GlobalOptions_0.1.0    tidyselect_0.2.5
 [22] locfit_1.5-9.1         glue_1.3.1             R6_2.4.0
 [25] GetoptLong_0.1.7       purrr_0.3.2            ggplot2_3.2.0
 [28] scales_1.0.0           matrixStats_0.54.0     assertthat_0.2.1
 [31] shape_1.4.4            colorspace_1.4-1       stringi_1.4.3
 [34] RCurl_1.95-4.12        lazyeval_0.2.2         munsell_0.5.0
 [37] crayon_1.3.4           rjson_0.2.20

About the "row_split" parameter๏ผŸ

When I used EnrichedHeatmap() function to plot a heatmap, I wanted to split two different group. So the row_split=split was used. It did not work. Then I found that it using Heatmap of ComplexHeatmap package. And there is a change about this parameter: row_split ----> split. So you maybe change the README in the future.
Thank you.

Error with normalizeToMatrix() when using "smooth = TRUE"

Trying the normalizeToMatrix() example using data provided with the package

> meth
GRanges object with 100000 ranges and 1 metadata column:
           seqnames               ranges strand   |              meth
              <Rle>            <IRanges>  <Rle>   |         <numeric>
       [1]    chr21   [9432427, 9432427]      *   | 0.267104203931852
       [2]    chr21   [9432428, 9432428]      *   | 0.267106771955287
       [3]    chr21   [9432964, 9432964]      *   | 0.272709911227985
       [4]    chr21   [9432965, 9432965]      *   |   0.2727345344132
       [5]    chr21   [9433315, 9433315]      *   | 0.285114797969136
       ...      ...                  ...    ... ...               ...
   [99996]    chr21 [48114354, 48114354]      *   | 0.621073675200549
   [99997]    chr21 [48114513, 48114513]      *   |  0.62345197113453
   [99998]    chr21 [48114514, 48114514]      *   | 0.623474995478024
   [99999]    chr21 [48114920, 48114920]      *   | 0.644657359145078
  [100000]    chr21 [48115085, 48115085]      *   | 0.699363776991418
  -------
  seqinfo: 1 sequence from an unspecified genome; no seqlengths
> tss
GRanges object with 24952 ranges and 3 metadata columns:
        seqnames             ranges strand   |                 name     score      symbol
           <Rle>          <IRanges>  <Rle>   |          <character> <integer> <character>
  15155     chr1 [3661579, 3661579]      -   | ENSMUSG00000051951.5         0        Xkr4
  23469     chr1 [3456668, 3456668]      +   | ENSMUSG00000089699.1         0      Gm1992
   5254     chr1 [4350473, 4350473]      -   | ENSMUSG00000025900.4         0         Rp1
   5255     chr1 [4486494, 4486494]      -   | ENSMUSG00000025902.7         0       Sox17
   9486     chr1 [4775820, 4775820]      -   | ENSMUSG00000033845.7         0      Mrpl15
    ...      ...                ...    ... ...                  ...       ...         ...
  15352     chrY [2086590, 2086590]      +   | ENSMUSG00000052831.7         0     Rbmy1a1
  18614     chrY [2118049, 2118049]      +   | ENSMUSG00000069031.5         0     Gm10256
  19278     chrY [2156899, 2156899]      +   | ENSMUSG00000071960.4         0     Gm10352
  24665     chrY [2390390, 2390390]      +   | ENSMUSG00000091987.1         0      Gm3376
  23940     chrY [2550262, 2550262]      +   | ENSMUSG00000090600.1         0      Gm3395
  -------
  seqinfo: 22 sequences from an unspecified genome; no seqlengths
> normalizeToMatrix(meth, tss, value_column = "meth", mean_mode = "absolute", extend = 5000, w = 50, empty_value = NA, smooth = TRUE)

Warning message:
In .Seqinfo.mergexy(x, y) :
  The 2 combined objects have no sequence levels in common. (Use
  suppressWarnings() to suppress this warning.)
Error in t(apply(mat, 1, function(x) { :
  error in evaluating the argument 'x' in selecting a method for function 't': Error in locfit(x[l] ~ lp(seq_along(x)[l], nn = 0.2)) :
  fewer than one row in the data
> sessionInfo()
R version 3.2.2 (2015-08-14)
Platform: x86_64-pc-linux-gnu (64-bit)

locale:
 [1] LC_CTYPE=en_US.UTF-8       LC_NUMERIC=C               LC_TIME=en_US.UTF-8        LC_COLLATE=en_US.UTF-8
 [5] LC_MONETARY=en_US.UTF-8    LC_MESSAGES=en_US.UTF-8    LC_PAPER=en_US.UTF-8       LC_NAME=C
 [9] LC_ADDRESS=C               LC_TELEPHONE=C             LC_MEASUREMENT=en_US.UTF-8 LC_IDENTIFICATION=C

attached base packages:
 [1] grid      stats4    parallel  stats     graphics  grDevices utils     datasets  methods   base

other attached packages:
 [1] circlize_0.3.3             EnrichedHeatmap_1.0.0      locfit_1.5-9.1             ComplexHeatmap_1.6.0
 [5] GenomicAlignments_1.6.1    Rsamtools_1.22.0           Biostrings_2.38.2          XVector_0.10.0
 [9] SummarizedExperiment_1.0.1 Biobase_2.30.0             GenomicRanges_1.22.2       GenomeInfoDb_1.6.1
[13] IRanges_2.4.6              S4Vectors_0.8.5            BiocGenerics_0.16.1        data.table_1.9.6

loaded via a namespace (and not attached):
 [1] whisker_0.3-2        magrittr_1.5         zlibbioc_1.16.0      BiocParallel_1.4.3   lattice_0.20-33      colorspace_1.2-6
 [7] rjson_0.2.15         tools_3.2.2          lambda.r_1.1.7       futile.logger_1.4.1  matrixStats_0.50.1   RColorBrewer_1.1-2
[13] GlobalOptions_0.0.8  futile.options_1.0.0 bitops_1.0-6         dendextend_1.1.2     shape_1.4.2          chron_2.3-47
[19] GetoptLong_0.1.1

Convert from continuous matrix to discrete matrix

Assume a normalized matrix has both positive value and negative value, we only want to see the enrichment of windows/regions show significant positive values and negative values and we are only interested in the direction of the values while not the value itself:

rule = list(
    "positive" = c(0.5, Inf),
    "negative" = c(-Inf, -0.5)
)

mat2 = discretize(mat, rule)
EnrichedHeatmap(mat, col = colorRamp2(c(-1, 0, 1), c("green", "white", "red")))
EnrichedHeatmap(mat2, col = c("positive" = "red", "negative" = "green"))

Or something like:

rule = list(
    "very_high" = c(100, Inf),
    "high" = c(50, 100),
    "intermediate" = c(25, 50),
    "low" = c(0, 25)
)

Problem splitting by more than two groups in newest version (1.18.0)

Hello -

Love the package. We have integrated it into our Bioconductor package 'profileplyr' and it's really powerful - thanks!

However, since I have updated to the newest version of Bioconductor (v3.11 with R4.0) and the newest version of EnrichedHeatmap (1.18.0) I have noticed an issue whenever I try and split the rows by more than two groups within the EnrichedHeatmap() function. Using code from the example in the help section of the function with a few modifications to add a vector to split by, I get strange results with three groups. When I try and split into three groups, the third group is not shown in the figure. Also, when I run the same exact code with the previous version of the package (1.16.0) I get the expected result.

The code to produce this result is shown below, and below the code I have pasted the results for the heatmap split into two and three groups using version 1.18.0 of the package, and the heatmap split into three groups using version 1.16.0 of the package, which looks correct.

Thanks for your help!

load(system.file("extdata", "chr21_test_data.RData", package = "EnrichedHeatmap"))
mat3 = normalizeToMatrix(meth, cgi, value_column = "meth", mean_mode = "absolute",
                         extend = 5000, w = 50, smooth = TRUE)

group_2 <- as.factor(c(rep(1, 100), rep(2,265)))
ht_2 <- EnrichedHeatmap(mat3, name = "methylation", column_title = "methylation near CGI", row_gap =  unit(2, "mm"), row_split = group_2)

group_3 <- as.factor(c(rep(1, 100), rep(2,100), rep(3, 165)))
ht_3 <- EnrichedHeatmap(mat3, name = "methylation", column_title = "methylation near CGI", row_gap =  unit(2, "mm"), row_split = group_3)

Result for 'ht_2' above (split into two groups) with EnrichedHeatmap 1.18.0 (looks normal):
image

Result for 'ht_3' above (split into three groups) with EnrichedHeatmap 1.18.0 (only two of the three groups are shown):
EH_test_1 18_threeGroups

Result for 'ht_3' above (split into three groups) with EnrichedHeatmap 1.16.0 (expected result):
EH_test_1 16_threeGroups

factor ordering for discrete values

Hi,

Thanks for the new tutorial http://bioconductor.org/packages/release/bioc/vignettes/EnrichedHeatmap/inst/doc/visualize_categorical_signals_wrapper.html

I have a question on the numeric representation of the discrete values. For chromHMM downloaded from epigenome Roadmap, the state is coded as E1..E15

> test_f1<- factor(paste0("E", 1:15), levels =paste0("E", 1:15))
> test_f2<- factor(paste0("E", 1:15))
> test_f1
 [1] E1  E2  E3  E4  E5  E6  E7  E8  E9  E10 E11 E12 E13 E14 E15
Levels: E1 E2 E3 E4 E5 E6 E7 E8 E9 E10 E11 E12 E13 E14 E15
> test_f2
 [1] E1  E2  E3  E4  E5  E6  E7  E8  E9  E10 E11 E12 E13 E14 E15
Levels: E1 E10 E11 E12 E13 E14 E15 E2 E3 E4 E5 E6 E7 E8 E9
> as.numeric(test_f1)
 [1]  1  2  3  4  5  6  7  8  9 10 11 12 13 14 15
> as.numeric(test_f2)
 [1]  1  8  9 10 11 12 13 14 15  2  3  4  5  6  7

If I set levels =paste0("E", 1:15), the final matrix will have 1 represent E1, 2 represent E2... right?

Also the final mat has the same row order as the tss right?

Thanks!
Tommy

extend and w not working for categorical data

Hi Zuguang,

library(EnrichedHeatmap)
library(GenomicFeatures)

load(system.file("extdata", "chr21_chromatin_states.RData", package = "EnrichedHeatmap"))
load(system.file("extdata", "chr21_test_data.RData", package = "EnrichedHeatmap"))

state_col = c("TssActive" = "#FF0000", "Transcript" = "#008000", "Enhancer" = "#C2E105",
        "Heterochromatin" = "#8A91D0", "TssBiv" = "#CD5C5C",
        "Repressive" = "#808080", "Quies" = "#000000")

tss = promoters(genes, upstream = 0, downstream = 1)
mat = normalizeToMatrix(states, tss, value_column = "states_simplified", extend = 10000, w = 200)

# it should be 100 columns. 2* extend/w = 2* 50 = 100
> dim(mat)
[1] 720  50

> devtools::session_info()
Session info -----------------------------------------------------------------------------------------------------
 setting  value                       
 version  R version 3.4.2 (2017-09-28)
 system   x86_64, darwin15.6.0        
 ui       RStudio (1.0.153)           
 language (EN)                        
 collate  en_US.UTF-8                 
 tz       America/Chicago             
 date     2018-03-26                  

Packages ---------------------------------------------------------------------------------------------------------
 package              * version    date       source                                   
 AnnotationDbi        * 1.38.2     2017-07-27 cran (@1.38.2)                           
 base                 * 3.4.2      2017-10-04 local                                    
 Biobase              * 2.36.2     2017-05-04 cran (@2.36.2)                           
 BiocGenerics         * 0.22.1     2017-10-07 cran (@0.22.1)                           
 BiocParallel           1.10.1     2017-05-03 cran (@1.10.1)                           
 biomaRt                2.32.1     2017-06-09 cran (@2.32.1)                           
 Biostrings             2.44.2     2017-07-21 cran (@2.44.2)                           
 bit                    1.1-12     2014-04-09 cran (@1.1-12)                           
 bit64                  0.9-7      2017-05-08 cran (@0.9-7)                            
 bitops                 1.0-6      2013-08-17 cran (@1.0-6)                            
 blob                   1.1.0      2017-06-17 cran (@1.1.0)                            
 circlize               0.4.3      2017-12-20 cran (@0.4.3)                            
 colorspace             1.3-2      2016-12-14 cran (@1.3-2)                            
 compiler               3.4.2      2017-10-04 local                                    
 ComplexHeatmap       * 1.17.1     2017-10-25 Github (jokergoo/ComplexHeatmap@acc87df) 
 datasets             * 3.4.2      2017-10-04 local                                    
 DBI                    0.7        2017-06-18 cran (@0.7)                              
 DelayedArray           0.2.7      2017-06-03 cran (@0.2.7)                            
 devtools               1.13.3     2017-08-02 CRAN (R 3.4.1)                           
 digest                 0.6.15     2018-01-28 cran (@0.6.15)                           
 EnrichedHeatmap      * 1.9.2      2017-11-24 Github (jokergoo/EnrichedHeatmap@1ec8279)
 GenomeInfoDb         * 1.12.3     2017-10-05 cran (@1.12.3)                           
 GenomeInfoDbData       0.99.0     2017-10-09 Bioconductor                             
 GenomicAlignments      1.12.2     2017-08-19 cran (@1.12.2)                           
 GenomicFeatures      * 1.28.5     2017-09-20 cran (@1.28.5)                           
 GenomicRanges        * 1.28.6     2017-10-04 cran (@1.28.6)                           
 GetoptLong             0.1.6      2017-03-07 cran (@0.1.6)                            
 GlobalOptions          0.0.12     2017-05-21 cran (@0.0.12)                           
 graphics             * 3.4.2      2017-10-04 local                                    
 grDevices            * 3.4.2      2017-10-04 local                                    
 grid                 * 3.4.2      2017-10-04 local                                    
 IRanges              * 2.10.5     2017-10-08 cran (@2.10.5)                           
 lattice                0.20-35    2017-03-25 CRAN (R 3.4.2)                           
 locfit               * 1.5-9.1    2013-04-20 CRAN (R 3.4.0)                           
 Matrix                 1.2-11     2017-08-21 CRAN (R 3.4.2)                           
 matrixStats            0.53.1     2018-02-11 cran (@0.53.1)                           
 memoise                1.1.0      2017-04-21 CRAN (R 3.4.0)                           
 methods              * 3.4.2      2017-10-04 local                                    
 parallel             * 3.4.2      2017-10-04 local                                    
 pillar                 1.2.1      2018-02-27 cran (@1.2.1)                            
 RColorBrewer           1.1-2      2014-12-07 cran (@1.1-2)                            
 Rcpp                   0.12.15    2018-01-20 cran (@0.12.15)                          
 RCurl                  1.95-4.8   2016-03-01 cran (@1.95-4.)                          
 rjson                  0.2.15     2014-11-03 cran (@0.2.15)                           
 rlang                  0.2.0      2018-02-20 CRAN (R 3.4.3)                           
 Rsamtools              1.28.0     2017-04-25 cran (@1.28.0)                           
 RSQLite                2.0        2017-06-19 cran (@2.0)                              
 rtracklayer            1.36.5     2017-10-04 cran (@1.36.5)                           
 S4Vectors            * 0.14.7     2017-10-08 cran (@0.14.7)                           
 shape                  1.4.4      2018-02-07 cran (@1.4.4)                            
 stats                * 3.4.2      2017-10-04 local                                    
 stats4               * 3.4.2      2017-10-04 local                                    
 SummarizedExperiment   1.6.5      2017-09-29 cran (@1.6.5)                            
 tibble                 1.4.2      2018-01-22 cran (@1.4.2)                            
 tools                  3.4.2      2017-10-04 local                                    
 utils                * 3.4.2      2017-10-04 local                                    
 withr                  2.1.1.9000 2018-03-05 Github (jimhester/withr@5d05571)         
 XML                    3.98-1.9   2017-06-19 cran (@3.98-1.)                          
 XVector                0.16.0     2017-04-25 cran (@0.16.0)                           
 zlibbioc               1.22.0     2017-04-25 cran (@1.22.0)   

Thanks for looking into it.

Tommy

Suggestion: gpar() for heatmap border

Hi Zuguang,

Thank you for creating and actively maintaining ComplexHeatmap and EnrichedHeatmap packages.

EnrichedHeatmap provides a logical option border to show or hide the plot border. Is it possible to provide an option to control the graphic parameters of the plot border?

Thank you again!
Lakhan

1 base pair shift when normalize to target regions

gr = GRanges(seqnames = c("chr5", "chr5"),
	ranges = IRanges(start = c(98, 98),
	                 end = c(104, 104)),
	score = c(1, 1))
target1 = GRanges(seqnames = "chr5",
	ranges = IRanges(start = 100, 
		             end = 100),
	strand = "+")
target2 = GRanges(seqnames = "chr5",
	ranges = IRanges(start = 100, 
		             end = 100),
	strand = "-")

mat11 = normalizeToMatrix(gr, target1, value_column = "score", 
	extend = 6, mean_mode = "absolute", w = 1)
mat12 = normalizeToMatrix(gr, target2, value_column = "score", 
	extend = 6, mean_mode = "absolute", w = 1)
ht_list = 
	EnrichedHeatmap(mat11, top_annotation = HeatmapAnnotation(lines = anno_enriched()),
		top_annotation_height = unit(2, "cm"), rect_gp = gpar(col= "white"),
		column_title = "target (+)") + 
	EnrichedHeatmap(mat12, top_annotation = HeatmapAnnotation(lines = anno_enriched()),
		top_annotation_height = unit(2, "cm"), rect_gp = gpar(col= "white"),
		column_title = "target (-)")
draw(ht_list, column_title = "signal: [98, 104], target: [100, 100]")

screen shot 2017-08-29 at 10 42 51

screen shot 2017-08-29 at 10 44 50

Strange V Shape when generating heatmap?

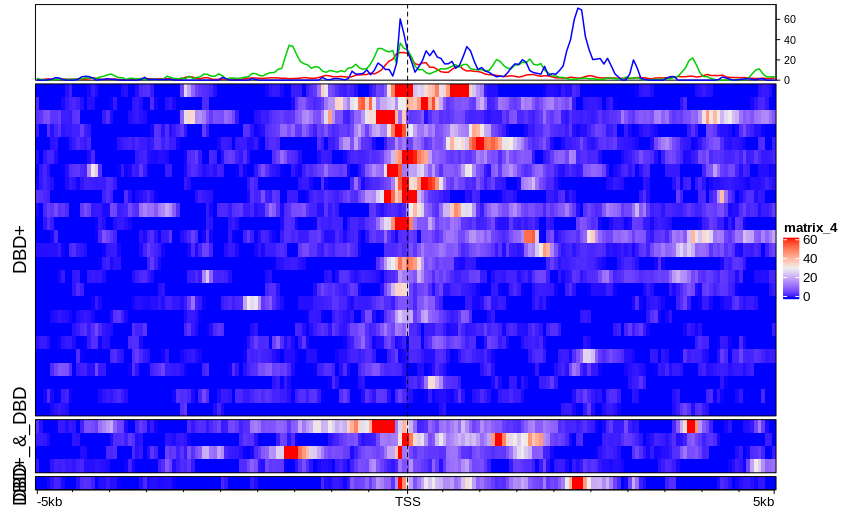
Hello, I've recently hit an issue with enriched heatmap where during generation the an ATAC-seq metaplot I get a very strange V shape at the bottom of the heatmap, and I'm unsure why this is. Attached is an image of the graphical issue. You can see the V shape I'm talking about in the "Gene" section of the plot
ATAC_quality.pdf

show an example to get H3K4me3 GRanges object

Hi,

Thanks for making this package, and it looks very useful. I was using Genomation package and this one looks more flexible.

Could you pleases show an example on how you get the H3K4me3 GRanges object (with coverage value in the metadata column) from a bam file?

How do you normalize the matrix? Is it by RPKM, CPM or anything else?

Thanks,
Ming

Meaning of rows on heatmap

Hi these might be naive questions:
What does each row mean on the heatmap? I assume it is each individual gene? Since they are ordered by enrichment level, I assume that the heatmap is not in the order of chr1 - chrY?
When plotting multiple heatmaps for comparing distribution of chromatin states, are the rows clustered in the same way? If the rows are different genes, how should I compare the two heatmaps?

Thank you!

customer reference genes annotation

Hi,

I tried to use enrichment heatmap to normalize chip-seq data. However, when I loaded my reference gene annotation (gtf file) downloaded from UCSC, then it repored an error.
###################
the command is:
normalizeToMatrix(k4me3,tss,value_column="Peak")
##################
the error is:
Error in (function (classes, fdef, mtable): unable to find an inherited method for function 'strand<-' for signature '"data.frame","character"'.

Could you give me some advises?
Thanks for your help.
Best,
Garen

Use my own matrix instead of `normalizeToMatrix`

Hi,

In your documentation, you say

actually mat1 is just a normal matrix with several additional attributes

Could I use my own matrix instead of file generated by normalizeToMatrix ? I already have multiple sample matrixes and I really like your heatmap concatenate function. Do I have to do the coverage in R again?

Thanks in advance !

Height of column title box

Hi @jokergoo

How can I change the height of the column title box?

Screenshot 2020-08-13 at 11 56 24

I tried:

column_title_gp = gpar(box_height = unit(5, "mm"))
column_title_gp = gpar(height = unit(5, "mm"))
ht_opt$simple_anno_size <- unit(2, "mm")

Nothing worked!

Target regions without extension

Hi,

I am trying to create a normalized matrix without doing any extension for the target regions. My target regions are of different length. I followed as it is given in the example.

mat1<-normalizeToMatrix(K9me3, knownK9me3, value_column="coverage", extend = 0, mean_mode="w0", w=50 )

However, this is giving me error:

Error in seq.default(s, e, by = w) : wrong sign in 'by' argument

I can create a matrix if I give some value for extension, but not with extend=0

Could you please let me know why?

Sudhir

annotation_legend_side does not work

Hi @jokergoo

It seems like the annotation_legend_side option is not working with EnrichedHeatmap. Seems like row annotations legends are treated as heatmap legends.

Example

library(EnrichedHeatmap)

set.seed(123)
load(system.file("extdata", "chr21_test_data.RData", package = "EnrichedHeatmap"))

tss <- promoters(genes, upstream = 0, downstream = 1)

mat1 <- normalizeToMatrix(H3K4me3, tss,
  value_column = "coverage",
  extend = 5000, mean_mode = "w0", w = 50
)[1:100,]

k <- kmeans(x = mat1, centers = 2)$cluster
k[k == 1] <- "A"
k[k == 2] <- "B"

la <- HeatmapAnnotation(
  Categories = k,
  which = "row"
)

ht <- EnrichedHeatmap(mat1,
  km = 2,
  left_annotation = la,
  name = "H3K4me3", ,
  column_title = "H3K4me3",
  column_title_gp = gpar(fill = "grey")
)

annotation_legend_side

draw(ht, annotation_legend_side = "bottom")

Screenshot 2020-08-14 at 10 51 22

heatmap_legend_side

draw(ht, heatmap_legend_side = "bottom")

Screenshot 2020-08-14 at 10 51 00

Colors of the top_annotation switch randomly

Dear Zuguang,

I am working with the EnrichedHeatmap package. I think it is great, thank you for creating and maintaining it!

I am having trouble with the color assignment of the top-annotation lines, when partitioning the data.
I am doing something similar to this example from the vignette.

_partition = paste0("cluster", kmeans(mat1, centers = 3)$cluster)
lgd = Legend(at = c("cluster1", "cluster2", "cluster3"), title = "Clusters", 
    type = "lines", legend_gp = gpar(col = 2:4))
ht_list = Heatmap(partition, col = structure(2:4, names = paste0("cluster", 1:3)), name = "partition",
              show_row_names = FALSE, width = unit(3, "mm")) +
          EnrichedHeatmap(mat1, col = col_fun, name = "H3K4me3",
              top_annotation = HeatmapAnnotation(lines = anno_enriched(gp = gpar(col = 2:4),
                yaxis_facing = "left")), 
              column_title = "H3K4me3") + 
          EnrichedHeatmap(mat2, col = meth_col_fun, name = "methylation",
              top_annotation = HeatmapAnnotation(lines = anno_enriched(gp = gpar(col = 2:4))), 
              column_title = "Methylation") +
          Heatmap(log2(rpkm+1), col = c("white", "orange"), name = "log2(rpkm+1)", 
              show_row_names = FALSE, width = unit(5, "mm"))
draw(ht_list, split = partition, annotation_legend_list = list(lgd))_

This main difference is that I want to use custom colors (instead of 2:4), and I want to each color to a specific "cluster" (partitioning group).
Following the code above, I can assign my colors to names for the Legend via:
Legend(at = paste0("cluster", c(3,2,1)), ....) and for the Heatmap via
Heatmap(..., col = structure(2:4, names = paste0("cluster", c(3,2,1)), ...),
but for the EnrichedHeatmap, I don't understand how to do this.
I your example you only do:
EnrichedHeatmap(..., top_annotation = HeatmapAnnotation(lines = anno_enriched(gp = gpar(col = 2:4)),
but applying this code on my own data with custom colors, the colors for all my datasets switch for the lines in the top-annotation, while the colors created by Legend and Heatmap stay correct:
image
(In the top-annotation of the first column, the colors clearly don't match with the legend).
First, I thought they were assigned in alphabetical order, then that they were assigned based on the order of unique(partition), but both are not the case.

So my question: How can I in the code above explicitly link a color to a name.
My (failed) attempts were:

_colors <- gpar(col = c('blue', 'green', 'red'), names =paste0('cluster', c(3,1,2))
EnrichedHeatmap(..., top_annotation = HeatmapAnnotation(lines = anno_enriched(gp = colors)), ...)_

and:

_colors <- gpar(col = c('blue', 'green', 'red'))
names(colors$col) <- paste0('cluster', c(3,1,2)
EnrichedHeatmap(..., top_annotation = HeatmapAnnotation(lines = anno_enriched(gp = colors)), ...)_

Thank you in advance for your time!

how can I manually cluster with EnrichedHeatMap?

Hi Dr Gu,
I am trying to comparing ChIPseq Enrichment of different subset of Genes which chosen based on RNAseq data. Is there anyway I can manually cluster these genes in different clusters rather than using K-means method.
The example presented on Bioconductor.org 'EnrichedHeatmap(mat1, col = col_fun, name = "H3K4me3",
row_split = sample(c("A", "B"), length(genes), replace = TRUE),
column_title = "Enrichment of H3K4me3") ' is based on random sampling which is not suitable for my need.
Thanks

feature request: enrichment heatmap on genebody

Hi,

other tools such as ngs.plot can plot ChIP-seq enrichment on gene body. Since every gene is with different lengths, the idea is to scale all genes to the same length (say 10kb) and then plot. Could you please share how you are going to do it? or if you can implement this in this package?

Thanks very much!
Ming

flip a subset of the matrix before clustering rows

Hi Zuguang,

I always learn something new from your write-ups. I was reading https://bioconductor.org/packages/release/bioc/vignettes/EnrichedHeatmap/inst/doc/row_odering.html

It is very nice to have closeness distance for clustering.

Fig1 of this paper http://m.genome.cshlp.org/content/22/9/1735.full

screenshot 2018-06-28 14 58 08

is doing something similar, but flips subset of the matrix if the strandness of the feature is not important. e.g. a binding site of TF. for TSSs, the strandness is important.

I hope it is not too much work to add this functionality.

one has to define the cluster first, EnrichedHeatmap uses the complete method to cluster. so, one can use cutree to define the number of clusters (or specify how many clusters one wants), and then flip the symmetric signals and then merge the clusters.

I am not sure if I have made myself clear, but your tools are all very awesome!

Thanks!
Tommy

Setting number of breaks

Hi @jokergoo

Is it possible to set the number of breaks for the color key?

Example

library(EnrichedHeatmap)

set.seed(123)
load(system.file("extdata", "chr21_test_data.RData", package = "EnrichedHeatmap"))

tss <- promoters(genes, upstream = 0, downstream = 1)

mat1 <- normalizeToMatrix(H3K4me3, tss,
  value_column = "coverage",
  extend = 5000, mean_mode = "w0", w = 50
)[1:100,]

k <- kmeans(x = mat1, centers = 2)$cluster
k[k == 1] <- "A"
k[k == 2] <- "B"

la <- HeatmapAnnotation(
  Categories = k,
  which = "row"
)

ht <- EnrichedHeatmap(mat1,
  km = 2,
  left_annotation = la,
  name = "H3K4me3", ,
  column_title = "H3K4me3",
  column_title_gp = gpar(fill = "grey")
)

Heatmap

draw(ht, annotation_legend_side = "bottom")

Screenshot 2020-08-14 at 10 51 22

Heatmap with 3 breaks

ht@matrix_color_mapping@colors <- ht@matrix_color_mapping@colors[c(1,2,4)]
ht@matrix_color_mapping@levels <- ht@matrix_color_mapping@levels[c(1,2,4)]

draw(ht, heatmap_legend_side = "bottom")

Screenshot 2020-08-18 at 11 49 59

Is there a way to provide the number of breaks?

I am aware of

heatmap_legend_param = list(
      at = c(0, 20, 60),
      title = H3K4me3
)

But, it would be good to know the possibility of defining the number of breaks.

EnrichedHeatmap() Error: You should have at least two distinct break values.

Hi,

When I use EnrichedHeatmap(), If I type

> mat1_trim = normalizeToMatrix(bedFile, t1.bed, value_column = "V5", extend = 3000, mean_mode = "w0", w = 50, keep = c(0, 0.99))
> col_fun = colorRamp2(quantile(mat1_trim, c(0, 0.99)), c("white", "red"))
> EnrichedHeatmap(mat1_trim, col = col_fun, name = Name)

This is OK.

BUT, I type,

> mat1_trim = normalizeToMatrix(bedFile, t2.bed, value_column = "V5", extend = 3000, mean_mode = "w0", w = 50, keep = c(0, 0.99))
> col_fun = colorRamp2(quantile(mat1_trim, c(0, 0.99)), c("white", "red"))
> EnrichedHeatmap(mat1_trim, col = col_fun, name = Name)

Error: You should have at least two distinct break values.
The only differences is target files. But I do not find that t1 and t2 have differences:

t1.bed: 1868 targets

> GRanges object with 1868 ranges and 8 metadata columns:
>          seqnames    ranges strand |        V4          V5              V6          V7        V8        V9       V10
>             <Rle> <IRanges>  <Rle> | <integer> <character>     <character> <character> <numeric> <numeric> <numeric>
>      [1]    chr17  72777173      * |       165           *  chr17_72777089           *       3.4  3.53e-12  6.97e-08
>      [2]     chr1 160651443      * |       201           *  chr1_160651341           *      2.33  7.06e-12  6.97e-08
>      ...      ...       ...    ... .       ...         ...             ...         ...       ...       ...       ...
>   [1867]     chr9 133646455      * |       301           *  chr9_133646303           *      1.31   0.00423    0.0498
>   [1868]     chr5  68660510      * |       186           *   chr5_68660416           *      1.63   0.00424    0.0499

t2.bed: just 17 targets

> GRanges object with 17 ranges and 8 metadata columns:
>        seqnames    ranges strand |        V4          V5             V6          V7        V8        V9       V10
>           <Rle> <IRanges>  <Rle> | <integer> <character>    <character> <character> <numeric> <numeric> <numeric>
>    [1]     chr6  37250360      * |       218           *  chr6_37250250           *     -5.43  5.03e-06  0.000907
>    [2]     chr3 195634611      * |       344           * chr3_195634438           *     -1.59  1.59e-05   0.00209
>    ...      ...       ...    ... .       ...         ...            ...         ...       ...       ...       ...
>   [16]    chr17  30627031      * |       199           * chr17_30626930           *     -2.47   0.00398    0.0485
>   [17]    chr14  25157395      * |       174           * chr14_25157307           *     -1.29   0.00415    0.0494

So why does it make this error? Thank you!

multiplemEnrichedheatmaps with only line plots

Hello,

I am trying to plot methylation value in differnt tissue types on gene bodies. I normally use deeptools plotProfile function but it doesn't have a smoothening option. So I like Enrichedheatmap for that reason. However I was wondering whether i can plot only the lineplot with out heatmap.

Hope i am making sense.
Many thanks,
Ranj
enrichedheatmap_lineplot

Question: Setting `lwd` for all heatmaps

Is it possible to set lwd to everything on an EnrichedHeatmap?

I tried

border_gp = gpar(col = "black", lwd = 0.4)
I would like to set it for top_annotation, column_title border, and x-axis.

clustering for chromatins state

Hi Zuguang,

Just found that now it supports for chromatin state data #24 . for clustering, what clustering method and distance is used?

or could you please share the code for the figure in the README.md?

Thanks for this great package and development.

Best,
Ming

Error while using show_error argument of anno_enriched()

Hi Zuguang,

I recently switched to latest versions of ComplexHeatmap and EnrichedHeatmap from GitHub.
When I want to show enrichment summary as anno_enriched top annotation along with error regions (using show_error = T), I am getting error. Please refer below for the sample code from your EnrichedHeatmap tutorial.

library(EnrichedHeatmap)

set.seed(123)
load(system.file("extdata", "chr21_test_data.RData", package = "EnrichedHeatmap"))

tss = promoters(genes, upstream = 0, downstream = 1)

mat1 = normalizeToMatrix(H3K4me3, tss, value_column = "coverage", 
                         extend = 5000, mean_mode = "w0", w = 50)


col_fun = circlize::colorRamp2(quantile(mat1, c(0, 0.99)), c("white", "red"))


EnrichedHeatmap(
  mat1, col = col_fun, name = "H3K4me3", row_km = 3,
  top_annotation = HeatmapAnnotation(
    enriched = anno_enriched(
      gp = gpar(col = 2:4, lty = 1:3),
      show_error = TRUE),
    annotation_height = unit(4, "cm")
  ),
  column_title = "Enrichment of H3K4me3", row_title_rot = 0)

This produces an error:

Error in colSds(mat[i, , drop = FALSE], na.rm = TRUE) : 
  could not find function "colSds"

This was working well with previous version. Can you please help to solve this.
Thank you for your active development and support!!

~Lakhan.

Recommend Projects

  • React photo React

    A declarative, efficient, and flexible JavaScript library for building user interfaces.

  • Vue.js photo Vue.js

    ๐Ÿ–– Vue.js is a progressive, incrementally-adoptable JavaScript framework for building UI on the web.

  • Typescript photo Typescript

    TypeScript is a superset of JavaScript that compiles to clean JavaScript output.

  • TensorFlow photo TensorFlow

    An Open Source Machine Learning Framework for Everyone

  • Django photo Django

    The Web framework for perfectionists with deadlines.

  • D3 photo D3

    Bring data to life with SVG, Canvas and HTML. ๐Ÿ“Š๐Ÿ“ˆ๐ŸŽ‰

Recommend Topics

  • javascript

    JavaScript (JS) is a lightweight interpreted programming language with first-class functions.

  • web

    Some thing interesting about web. New door for the world.

  • server

    A server is a program made to process requests and deliver data to clients.

  • Machine learning

    Machine learning is a way of modeling and interpreting data that allows a piece of software to respond intelligently.

  • Game

    Some thing interesting about game, make everyone happy.

Recommend Org

  • Facebook photo Facebook

    We are working to build community through open source technology. NB: members must have two-factor auth.

  • Microsoft photo Microsoft

    Open source projects and samples from Microsoft.

  • Google photo Google

    Google โค๏ธ Open Source for everyone.

  • D3 photo D3

    Data-Driven Documents codes.