Giter Club home page Giter Club logo

ggvenn's Introduction

ggvenn

Venn Diagram by ggplot2, with really easy-to-use API. This package is inspired by Venny

Screenshots

Venn 2 Venn 3 Venn 4

Installation

install.packages("ggvenn") # install via CRAN

or

if (!require(devtools)) install.packages("devtools")
devtools::install_github("yanlinlin82/ggvenn") # install via GitHub (for latest version)

Quick Start

This package supports both list and data.frame type data as input.

For list data (each element is a set):

library(ggvenn)

a <- list(`Set 1` = c(1, 3, 5, 7, 9),
          `Set 2` = c(1, 5, 9, 13),
          `Set 3` = c(1, 2, 8, 9),
          `Set 4` = c(6, 7, 10, 12))
ggvenn(a, c("Set 1", "Set 2"))            # draw two-set venn
ggvenn(a, c("Set 1", "Set 2", "Set 3"))   # draw three-set venn
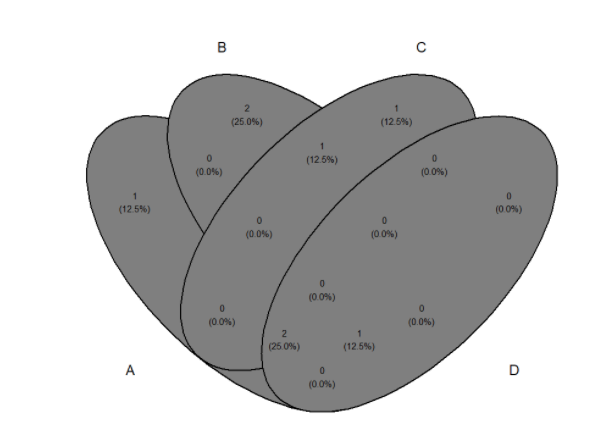
ggvenn(a)   # without set names, the first 4 elements in list will be chose to draw four-set venn

For data.frame data (each logical column is a set):

d <- tibble(value   = c(1,     2,     3,     5,     6,     7,     8,     9),
            `Set 1` = c(TRUE,  FALSE, TRUE,  TRUE,  FALSE, TRUE,  FALSE, TRUE),
            `Set 2` = c(TRUE,  FALSE, FALSE, TRUE,  FALSE, FALSE, FALSE, TRUE),
            `Set 3` = c(TRUE,  TRUE,  FALSE, FALSE, FALSE, FALSE, TRUE,  TRUE),
            `Set 4` = c(FALSE, FALSE, FALSE, FALSE, TRUE,  TRUE,  FALSE, FALSE))
ggvenn(d, c("Set 1", "Set 2"))           # draw two-set venn
ggvenn(d, c("Set 1", "Set 2", "Set 3"))  # draw three-set venn
ggvenn(d)   # without set names, the first 4 logical column in data.frame will be chose to draw four-set venn

For data.frame data, there is also another way to plot in ggplot grammar:

# draw two-set venn (use A, B in aes)
ggplot(d, aes(A = `Set 1`, B = `Set 2`)) +
  geom_venn() + theme_void() + coord_fixed()

# draw three-set venn (use A, B, C in aes)
ggplot(d, aes(A = `Set 1`, B = `Set 2`, C = `Set 3`)) +
  geom_venn() + theme_void() + coord_fixed()

# draw four-set venn (use A, B, C, D in aes)
ggplot(d, aes(A = `Set 1`, B = `Set 2`, C = `Set 3`, D = `Set 4`)) +
  geom_venn() + theme_void() + coord_fixed()

More Options

There are more options for customizing the venn diagram.

  1. Tune the color and size

    For filling:

    • fill_color - default is c("blue", "yellow", "green", "red")
    • fill_alpha - default is 0.5

    For stroke:

    • stroke_color - default is "black"
    • stroke_alpha - default is 1
    • stroke_size - default is 1
    • stroke_linetype - default is "solid"

    For set name:

    • set_name_color - default is "black"
    • set_name_size - default is 6

    For text:

    • text_color - default is "black"
    • text_size - default is 4

    All parameters above could be used in both ggvenn() and geom_venn().

    For example:

    a <- list(A = 1:4, B = c(1,3,5))
    ggvenn(a, stroke_linetype = 2, stroke_size = 0.5,
      set_name_color = "red", set_name_size = 15,
      fill_color = c("pink", "gold"))
    
  2. Show elements

    • show_elements - default is FALSE
    • label_sep - text used to concatenate elements, default is ","

    For example:

    a <- list(A = c("apple", "pear", "peach"),
              B = c("apple", "lemon"))
    ggvenn(a, show_elements = TRUE)
    
    ggvenn(a, show_elements = TRUE, label_sep = "\n")  # show elements in line
    
  3. Hide percentage

    • show_percentage - default is TRUE

    For example:

    a <- list(A = 1:5, B = 1:2)
    ggvenn(a, show_percentage = FALSE)
    
  4. Change digits of percentage

    • digits - default is 1

    For example:

    a <- list(A = 1:5, B = 1:2)
    ggvenn(a, digits = 2)
    

Data Format

The ggvenn support two types of input data: list and data.frame. Two functions (data_frame_to_list() and list_to_data_frame()) can convert data between the two types.

a <- list(A = 1:5, B = 4:6)
d <- tibble(key = 1:6,
            A = c(rep(TRUE, 5), FALSE),
            B = rep(c(FALSE, TRUE), each = 3))

identical(a, data_frame_to_list(d))  # TRUE
identical(d, list_to_data_frame(a))  # TRUE

ggvenn's People

Contributors

emanuelsoda avatar konradzdeb avatar olivroy avatar williamlai2 avatar yanlinlin82 avatar

Stargazers

 avatar  avatar  avatar  avatar  avatar  avatar  avatar  avatar  avatar  avatar  avatar  avatar  avatar  avatar  avatar  avatar  avatar  avatar  avatar  avatar  avatar  avatar  avatar  avatar  avatar  avatar  avatar  avatar  avatar  avatar  avatar  avatar  avatar  avatar  avatar  avatar  avatar  avatar  avatar  avatar  avatar  avatar  avatar  avatar  avatar  avatar  avatar  avatar  avatar  avatar  avatar  avatar  avatar  avatar  avatar  avatar  avatar  avatar  avatar  avatar  avatar  avatar  avatar  avatar  avatar  avatar  avatar  avatar  avatar  avatar  avatar  avatar  avatar  avatar  avatar  avatar  avatar  avatar  avatar  avatar  avatar  avatar  avatar  avatar  avatar  avatar  avatar  avatar  avatar  avatar  avatar  avatar  avatar  avatar  avatar  avatar  avatar  avatar  avatar  avatar

Watchers

 avatar  avatar  avatar  avatar  avatar  avatar

ggvenn's Issues

Display options: percentages?

First of all, thank you for the really nice piece of work! At the moment, I’m trying to draw a Venn diagram for a research article and I wonder whether it is possible to display the percentages based on the total number of observations of the data (instead of observations included in the diagram)?

For example, let say I have data of 1000 observations and I create a Venn diagram of its logical variables A, B, C and D. However, values of 100 observations are false regarding all of those four variables and thus they are not included in the diagram. The intersection of ABCD consists of 90 observations and when displaying the percentages, it shows 10% (90 out of 900 observations). However, I would like to show the proportion of ABCD in relation to the total data, which in this case would be 9% (90/1000). Is that somehow possible?

I would really appreciate if someone could help me out with this.

feature request

When arranging with cowplot::plot_grid, two venn plot will change the ratio for each plot. Could the ggvenn fix the ratio of width and height for each plots?
Thanks!
Below is what I got.
image

number of sets

Hello
thank you for this nice package.

it is exactly what I was looking for with one limitation.. I have a dataset made of 6 lists of overlapping genes across 6 tissues
can we increase the number of sets above 4? I found other packages like 'venn' doing it but they do not offer all your nice options

thank you!

using full plot area

Dear @yanlinlin82,

Thank you for the package!

I have a minor question regarding the plot size. Namely, if you try to align couple of plots using i.e. patchwork it seems like the venn diagrams are not occupying the full plot area.

Following code:

library(ggvenn)
library(patchwork)

a <- list(`Set 1` = c(1, 3, 5, 7, 9),
          `Set 2` = c(1, 5, 9, 13),
          `Set 3` = c(1, 2, 8, 9),
          `Set 4` = c(6, 7, 10, 12))

p1 <- ggvenn(a, c("Set 1", "Set 2"))

p2 <- iris %>% ggplot(aes(x = Sepal.Length, y = Sepal.Width)) + geom_point()

p1 / p2

produces this figure from which it seems like the venn diagrams are not in the full plot area:

Screen Shot 2021-03-18 at 18 07 57

I would expect the plots to occupy full ploting area, like in the example bellow:

p2 / p2

Screen Shot 2021-03-18 at 18 10 56

I tried following:

p1 <- ggvenn(a, c("Set 1", "Set 2")) + theme(plot.margin = unit(c(0,0,0,0), "cm"))

p1/p2

but seems like it has no effect.

Do you have any suggestion how to expend ggvens to occupy full plot area?

Thank you in advance
Amel

Could the function adjust the distance between the setname and the circle?

I used the function:
ggvenn(venn_list, fill_color = c("#1F77B4FF", "#FF7F0EFF"), fill_alpha = .7, stroke_size = 0.3, stroke_alpha = .5, show_percentage = FALSE, text_size = 8, set_name_size = 6) + labs(title = 'TNK') + theme(plot.title = element_text(size=18, face="bold", hjust=0.5))
The output is like this:
image
I want to adjust the distance between the setnames (such as HCC and ICC) and the circle, or do something which making the title (TNK) will not cover the setnames.

Set names not shown fully

Hi,
Thanks for the beautiful package.
Any ideas on how can I adjust the position of the set names? for longer set names it doesn't show them fully no matter the plot size. (e.g test1test2test3test4 in this example)
Thanks

image

Does not work without tidyverse loaded

I get various errors when trying to use the package by itself wit ggplot2 loaded, for example:

  • Error in data %>% select_if(is.logical) %>% names: could not find function "%>%"
  • could not find function "as_tibble"

They go away if I explicitly load entire tidyverse (library(tidyverse)) which is a thing I would prefer to avoid. Wold you please consider declaring the imports that you use, e.g. with @importFrom or manual NAMESPACE curation?

Also, would you consider submitting the package for CRAN? I think it has a great potential because it has the cleanest API from several R packages implementing venn diagrams I looked at.

Prepare personal data

Hi Yan,

I am using your ggvenn for my own data analysis. However, I can't convert my dataset from the list “a" to dataframe "d" as you showed on your GitHub. Could you tell me how to convert this list to the tibble?

image

error from masked dplyr::count

Thanks for making this package.

I was getting the following error for any input, including the example data:

Error in count(., A, B, C, D) : Argument 'x' must be a vector: list

The issue was from another loaded package (DESeq2) that masked dplyr::count. It works if I copy the ggvenn code and replace "count" with "dplyr::count" or if I detach DESeq2 before calling ggvenn.

Not sure that's worth an update, but someone may find this if they run into the same issue.

Zero (0) or NA values are recognized.

Is there a way, that values like 0 and NA are not recognized in an intersection in a list? I believe that zero should be recognized as nothing, or null.

ggplot labels with linebreaks inn ggvenn venn diagram

Thank Anders for posting this question: https://support.bioconductor.org/p/133731/

library(ggvenn)
d<-data.frame(id=paste(LETTERS[1:9]),
           A=c(TRUE,TRUE,TRUE,FALSE,FALSE,TRUE,TRUE,FALSE,FALSE),
           B=c(FALSE,FALSE,TRUE,TRUE,TRUE,TRUE,TRUE,FALSE,FALSE),
           C=c(FALSE,FALSE,TRUE,TRUE,FALSE,TRUE,TRUE,TRUE,FALSE))

p<-ggplot(d) +
  geom_venn(aes(A=A,B=B,C=C,label=id)) +
  coord_fixed()
  theme_void()
p

In the above code, the label of each intersection is collapsed by comma (,). It would be better to allow customize it.

Show values (sums) in venn diagram

It would be good to be able to show values.

Something like this (not sure if I am representing this correctly):

a <- c(1, 3) # A, AB
b <- c(1, 2) # AB, B

venn <- c(a[1], # A
          a[2] + b[1], # AB
          b[2]) # B

> venn
[1] 1 4 2

Getting gray areas in venn diagram

Hi,

I am trying to run ggvenn with 3 areas, this is my code:

ggvenn(
  y, 
  fill_color = c("#0073C2FF", "#EFC000FF", "#868686FF"),
  stroke_size = 0.4, set_name_size = 6
)

but I am getting gray areas, and also the following warning:

Warning message:
`guides(<scale> = FALSE)` is deprecated. Please use `guides(<scale> = "none")` instead. 

Any ideas how to fix this?
I do have the latest version, 0.1.9.

Warning Message when show_percentage = FALSE

Hi, when show_percentage = FALSE the function geom_venn() return a warning. Is there a way to avoid this and still use show_percentage = FALSE. Thanks in advance

Warning message:
Problem while computing text = sprintf("%d", n, 100 * n/sum(n)).
ℹ one argument not used by format '%d'

Scale circles to reflect overlap

Hi,
Thank you for creating this. I was wondering if there's an option to make the circle areas represent the percentage of overlap, like the scale parameter in VennDiagram. Thank you!

Color adjustment

Nice package.
How can I adjust the colors of circles/elipses and borders with either ggvenn or geom_venn?
Also any way to change transparency, border thickness, etc. Thanks.

How do you create a table with each segment of the Venn diagram

Hello

Thank you for your code - it is very nice. I am using the code to look at 3 gene sets with the overlapping and unique genes represented by the Venn diagram. I have used show_elements to look at these genes directly on the Venn diagram but I am wondering whether there is a convenient way to have them in a table?

I am especially interested in a way to view the unique genes in each set (i.e. not overlapping with either of the other 2 sets).

Best wishes,
Jane

Add ggvenn to conda-forge

Please add ggvenn to conda-forge, it would get a lot more users and people could better integrate into their environments and software dists

problem with the diagramm

Hello,

I use your package but I have a bug when I use the diagramme in 4d, there is an intersection where the number is false.

Take this test file test.txt,

library(data.table)
library(tidyverse)
library(ggvenn)

test = fread(test.txt)

test %>% ggvenn()

nrow(test[A == T & B == T & C == F & D==T])

The problem is on the intersection of A, B and D, your diagramme indicate 2 instead of 13 like the nrow(test[A == T & B == T & C == F & D==T]) indicate. This is the image I obtained with this test : test.png.

Thanks,

Can I change font family?

I'm Hanbeen Kim.

Thank you for developing helpful tool "ggvenn".

I would like to change the font family from default setting to "Times New Roman".

Is there any possible way to change?

Sincerely,

Hanbeen Kim

remove total count from plot

--Hi,

i use this code below:
ven <- ggplot(d, aes(A = x, B = y, C = z, D = f)) +
geom_venn(
stroke_color="grey",
stroke_size = 0.5,
stat = "identity",
position = "identity",
show_percentage = FALSE,
fill_color=c("#8fd1b2", "#c4b3ab", "#a18073", "#409c9e"),
set_name_color=c("#8fd1b2", "#c4b3ab", "#a18073", "#409c9e"),
set_name_size = 6,
text_size = 6,
text_color = "black",
fill_alpha = 0.5,
stroke_alpha = 0.8,
label_sep = ",",
count_column = NULL,
show_outside = c("auto", "none", "always"),
auto_scale = FALSE) +
theme_void() +
ggtitle("blabla") +
theme(plot.title = element_text(hjust = 0.5, size = rel(1.5))) +
theme(legend.position="none")

and on my plot i have a total count (see on attached picture number 21615),
How to remove this count from picture ?

Thank you --
venn

Error in prepare_venn_data when use this packages

Hi,
I get follows error when use this packages to plot a veen figure.

> list(A=1:3,B=3:6) %>%
+     ggvenn(show_elements=TRUE)
Using `n` as weighting variable
i Quiet this message with `wt = n` or count rows with `wt = 1`
Error in prepare_venn_data(data, columns, show_elements, show_percentage) : 
  (d1 %>% count(A, B) %>% with(n)) == 1 are not all TRUE

Great Pkg but get error msg in example code.

Hi LinLin!

ggVenn is really a GREAT Pkg,
but I get an error msg
using the GIThub page example code:

# use data.frame as input...
d <- tibble(value = c(1, 2, 3, 5, 6, 7, 8, 9, 10, 12, 13),
Set 1 = c(T, F, T, T, F, T, F, T, F, F, F),
Set 2 = c(T, F, F, T, F, F, F, T, F, F, T),
Set 3 = c(T, T, F, F, F, F, T, T, F, F, F),
Set 4 = c(F, F, F, F, T, T, F, F, T, T, F))

d %>% ggvenn(aes(A = `Set 1`, B = `Set 2`))
Error: Must subset columns with a valid subscript vector.
x Subscript columns[[1]] has the wrong type quosure/formula.
It must be logical, numeric, or character.

Help!
Sfd99
San Francisco
R / Rstudio / Ubuntu Linux 20.04 (all latest versions).

ggvenn - warning message - guides(<scale> = FALSE)` is deprecated

Hello, I was using the ggvenn function without any problems before, but I recently got this error messsage with the same code. Please find an example that give me the same wrning message.

`A=c("blue", "green", 'purple', "orange")
B=c("blue", "yellow", "black", "pink")
C=c("pink", "red", "orange", "green")
D=c("green", "blue", "orange")

ListeVenn=list(A=A, B=B, C=C, D=D)

ggvenn(ListeVenn)

"Warning message:
guides(<scale> = FALSE) is deprecated. Please use guides(<scale> = "none") instead." `

The veen diagramm is made but without any colours and some lines are missing

Below is the plot I am obtaining following the warning message

8545

Annotate Venn diagram

Apart from the standard venn diagram plot:

  • How would I add separate labels within and outside the overlap areas?
  • Can there be a possibility of doing this similar to what ggrepel does?
  • Are you planning to add a scaling functionality where the size of overlap and circles scales to the number of the elements being represented?
  • How do I change the font of the text, how would I do it separately for the set names and within the venn diagram?

Fantastic package btw! This has been missing for a while for ggplot2.

using ggvenn in jamovi

Dear @yanlinlin82,
I am developing some modules for jamovi.org
I think ggvenn will be useful for clinical researchers, so I have added your package to see if it will work inside jamovi.
I will try to add arguments as well.
Please let me know what you think, and please check if the reference I have given is appropriate.

Best wishes

Screen Shot 2021-02-08 at 12 22 12

Screen Shot 2021-02-08 at 12 34 54

Recommend Projects

  • React photo React

    A declarative, efficient, and flexible JavaScript library for building user interfaces.

  • Vue.js photo Vue.js

    🖖 Vue.js is a progressive, incrementally-adoptable JavaScript framework for building UI on the web.

  • Typescript photo Typescript

    TypeScript is a superset of JavaScript that compiles to clean JavaScript output.

  • TensorFlow photo TensorFlow

    An Open Source Machine Learning Framework for Everyone

  • Django photo Django

    The Web framework for perfectionists with deadlines.

  • D3 photo D3

    Bring data to life with SVG, Canvas and HTML. 📊📈🎉

Recommend Topics

  • javascript

    JavaScript (JS) is a lightweight interpreted programming language with first-class functions.

  • web

    Some thing interesting about web. New door for the world.

  • server

    A server is a program made to process requests and deliver data to clients.

  • Machine learning

    Machine learning is a way of modeling and interpreting data that allows a piece of software to respond intelligently.

  • Game

    Some thing interesting about game, make everyone happy.

Recommend Org

  • Facebook photo Facebook

    We are working to build community through open source technology. NB: members must have two-factor auth.

  • Microsoft photo Microsoft

    Open source projects and samples from Microsoft.

  • Google photo Google

    Google ❤️ Open Source for everyone.

  • D3 photo D3

    Data-Driven Documents codes.