Giter Club home page Giter Club logo

ggpicrust2's Introduction

ggpicrust2 vignettes

🌟 If you find ggpicrust2 helpful, please consider giving us a star on GitHub! Your support greatly motivates us to improve and maintain this project. 🌟

ggpicrust2 is a comprehensive package designed to provide a seamless and intuitive solution for analyzing and interpreting the results of PICRUSt2 functional prediction. It offers a wide range of features, including pathway name/description annotations, advanced differential abundance (DA) methods, and visualization of DA results.

One of the newest additions to ggpicrust2 is the capability to compare the consistency and inconsistency across different DA methods applied to the same dataset. This feature allows users to assess the agreement and discrepancy between various methods when it comes to predicting and sequencing the metagenome of a particular sample. It provides valuable insights into the consistency of results obtained from different approaches and helps users evaluate the robustness of their findings.

By leveraging this functionality, researchers, data scientists, and bioinformaticians can gain a deeper understanding of the underlying biological processes and mechanisms present in their PICRUSt2 output data. This comparison of different methods enables them to make informed decisions and draw reliable conclusions based on the consistency evaluation of macrogenomic predictions or sequencing results for the same sample.

If you are interested in exploring and analyzing your PICRUSt2 output data, ggpicrust2 is a powerful tool that provides a comprehensive set of features, including the ability to assess the consistency and evaluate the performance of different methods applied to the same dataset.

CRAN version Downloads License: MIT

News

🌟 Introducing MicrobiomeStat: Generate Dozens of Pages of Detailed Reports in a Single Click

We’re pleased to introduce MicrobiomeStat, our latest R package tailored for longitudinal microbiome data analysis. Designed to work efficiently with 16s rRNA microbiome data, MicrobiomeStat integrates comprehensive statistical tests and clear visualizations, offering a practical solution for microbiome researchers.

MicrobiomeStat aims to simplify the complexities of microbiome data analysis. It’s well-suited for various research needs, whether you’re dealing with multi-omics data or cross-sectional studies. The package is designed to be user-friendly, accommodating both new and experienced researchers in the field.

For those engaged in microbiome research, MicrobiomeStat provides a straightforward approach to data analysis. Discover its full capabilities and learn more about how it can enhance your research at the MicrobiomeStat Wiki. You can also access the tool directly on GitHub: MicrobiomeStat GitHub Repository.

We appreciate your support and interest in our tools and look forward to seeing the contributions MicrobiomeStat can make to your research endeavors.

Table of Contents

Citation

If you use ggpicrust2 in your research, please cite the following paper:

Chen Yang and others. (2023). ggpicrust2: an R package for PICRUSt2 predicted functional profile analysis and visualization. Bioinformatics, btad470. DOI link

BibTeX entry: Download here

ResearchGate link: Click here

Bioinformatics link: Click here

Installation

You can install the stable version of ggpicrust2 from CRAN with:

install.packages("ggpicrust2")

To install the latest development version of ggpicrust2 from GitHub, you can use:

# Install the devtools package if not already installed
# install.packages("devtools")

# Install ggpicrust2 from GitHub
devtools::install_github("cafferychen777/ggpicrust2")

Dependent CRAN Packages

Package Description
aplot Create interactive plots
dplyr A fast consistent tool for working with data frame like objects both in memory and out of memory
ggplot2 An implementation of the Grammar of Graphics in R
grid A rewrite of the graphics layout capabilities of R
MicrobiomeStat Statistical analysis of microbiome data
readr Read rectangular data (csv tsv fwf) into R
stats The R Stats Package
tibble Simple Data Frames
tidyr Easily tidy data with spread() and gather() functions
ggprism Interactive 3D plots with ‘prism’ graphics
cowplot Streamlined Plot Theme and Plot Annotations for ‘ggplot2’
ggforce Easily add secondary axes, zooms, and image overlays to ‘ggplot2’
ggplotify Convert complex plots into ‘grob’ or ‘ggplot’ objects
magrittr A Forward-Pipe Operator for R
utils The R Utils Package

Dependent Bioconductor Packages

Package Description
phyloseq Handling and analysis of high-throughput microbiome census data
ALDEx2 Differential abundance analysis of taxonomic and functional features
SummarizedExperiment SummarizedExperiment container for storing data and metadata together
Biobase Base functions for Bioconductor
devtools Tools to make developing R packages easier
ComplexHeatmap Making Complex Heatmaps in R
BiocGenerics S4 generic functions for Bioconductor
BiocManager Access the Bioconductor Project Package Repositories
metagenomeSeq Statistical analysis for sparse high-throughput sequencing
Maaslin2 Tools for microbiome analysis
edgeR Empirical Analysis of Digital Gene Expression Data in R
lefser R implementation of the LEfSE method for microbiome biomarker discovery
limma Linear Models for Microarray and RNA-Seq Data
KEGGREST R Interface to KEGG REST API
DESeq2 Differential gene expression analysis using RNA-seq data
if (!requireNamespace("BiocManager", quietly = TRUE))
    install.packages("BiocManager")

pkgs <- c("phyloseq", "ALDEx2", "SummarizedExperiment", "Biobase", "devtools", 
          "ComplexHeatmap", "BiocGenerics", "BiocManager", "metagenomeSeq", 
          "Maaslin2", "edgeR", "lefser", "limma", "KEGGREST", "DESeq2")

for (pkg in pkgs) {
  if (!requireNamespace(pkg, quietly = TRUE))
    BiocManager::install(pkg)
}

Stay Updated

Stay up to date with the latest ggpicrust2 developments by following me on Twitter:

On my Twitter account, you’ll find regular updates, announcements, and insights related to ggpicrust2. By following me, you’ll ensure that you never miss any important information or new features.

Feel free to join the conversation, ask questions, and engage with other users who are also interested in ggpicrust2. Twitter is a great platform to stay connected and be a part of the community.

Click on the Twitter follow button above or visit https://twitter.com/CafferyYang to follow me now!

Thank you for your interest in ggpicrust2, and I look forward to keeping you informed about all the exciting updates!

Workflow

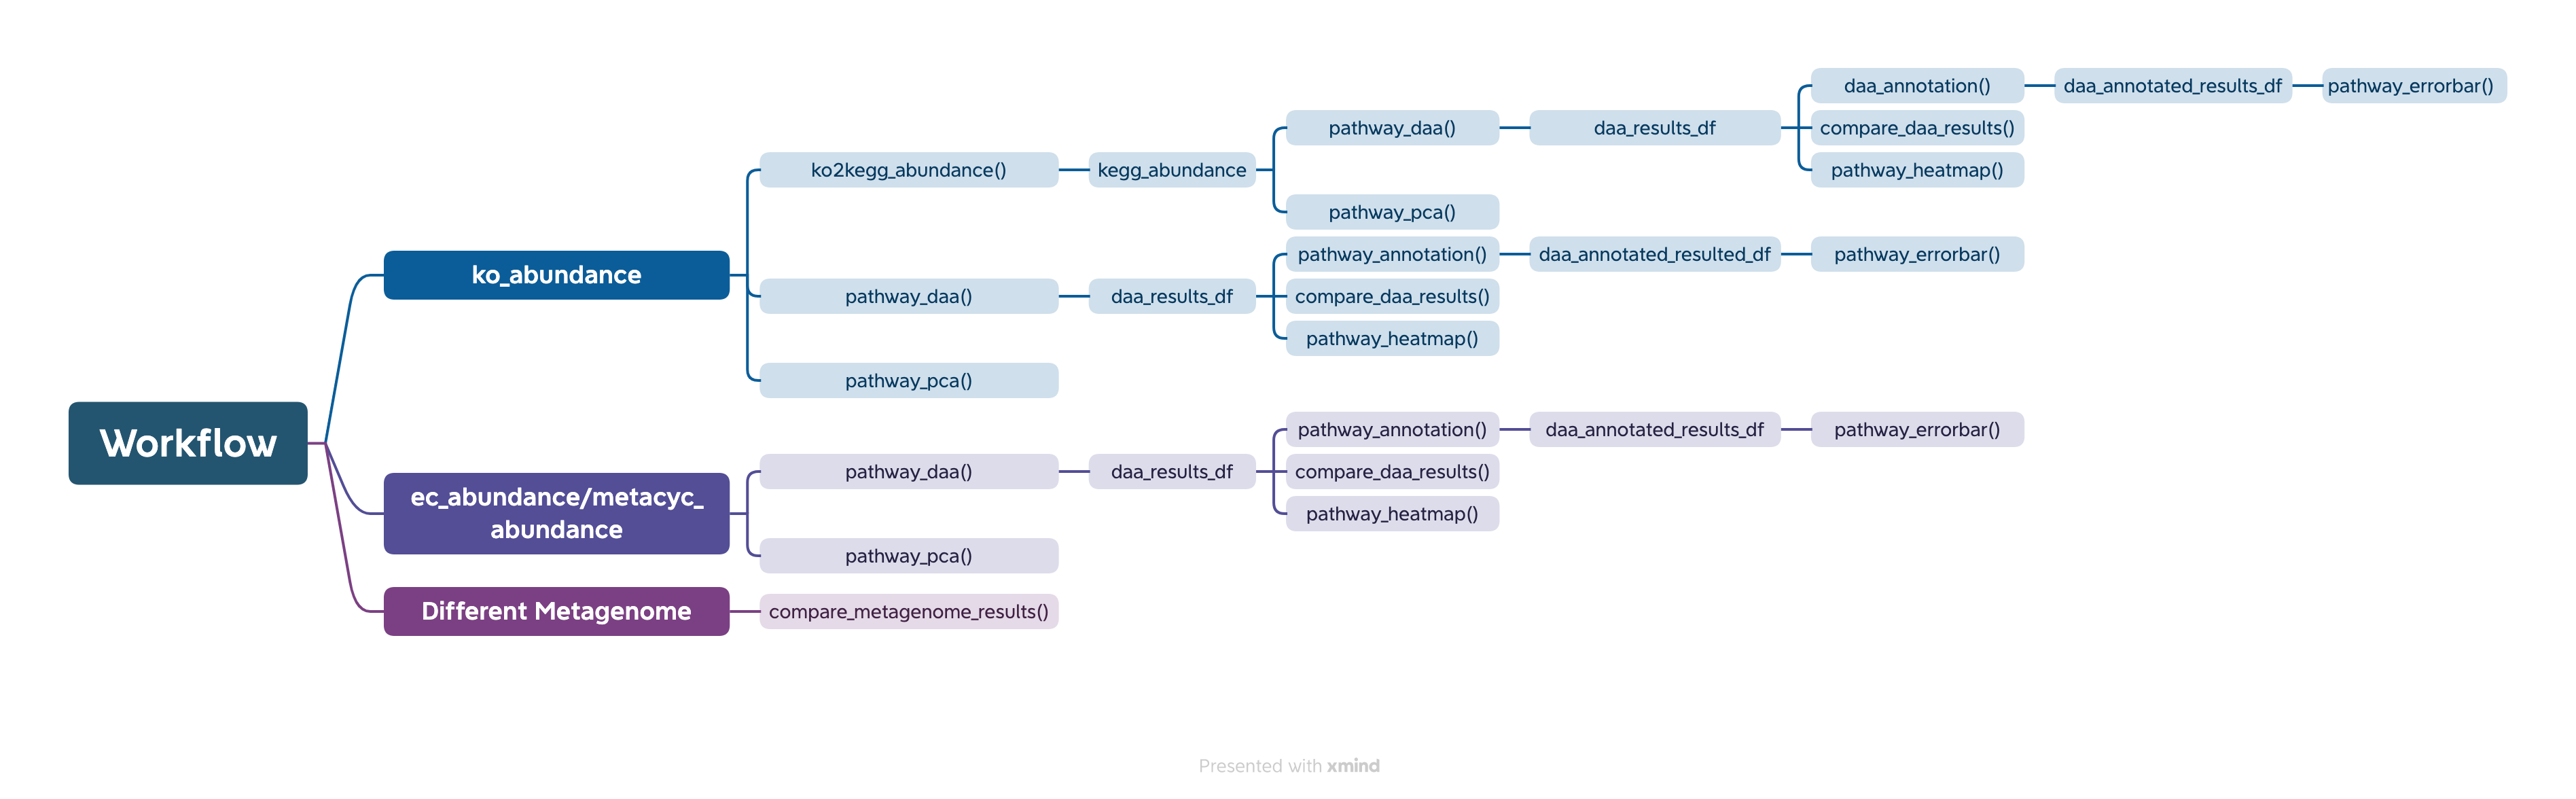
The easiest way to analyze the PICRUSt2 output is using ggpicrust2() function. The main pipeline can be run with ggpicrust2() function.

ggpicrust2() integrates ko abundance to kegg pathway abundance conversion, annotation of pathway, differential abundance (DA) analysis, part of DA results visualization. When you have trouble running ggpicrust2(), you can debug it by running a separate function, which will greatly increase the speed of your analysis and visualization.

ggpicrust2()

You can download the example dataset from the provided Github link and Google Drive link or use the dataset included in the package.

# If you want to analyze the abundance of KEGG pathways instead of KO within the pathway, please set `ko_to_kegg` to TRUE.
# KEGG pathways typically have more descriptive explanations.

library(readr)
library(ggpicrust2)
library(tibble)
library(tidyverse)
library(ggprism)
library(patchwork)

# Load necessary data: abundance data and metadata
abundance_file <- "path/to/your/abundance_file.tsv"
metadata <- read_delim(
    "path/to/your/metadata.txt",
    delim = "\t",
    escape_double = FALSE,
    trim_ws = TRUE
)

# Run ggpicrust2 with input file path
results_file_input <- ggpicrust2(file = abundance_file,
                                 metadata = metadata,
                                 group = "your_group_column", # For example dataset, group = "Environment"
                                 pathway = "KO",
                                 daa_method = "LinDA",
                                 ko_to_kegg = TRUE,
                                 order = "pathway_class",
                                 p_values_bar = TRUE,
                                 x_lab = "pathway_name")

# Run ggpicrust2 with imported data.frame
abundance_data <- read_delim(abundance_file, delim = "\t", col_names = TRUE, trim_ws = TRUE)

# Run ggpicrust2 with input data
results_data_input <- ggpicrust2(data = abundance_data,
                                 metadata = metadata,
                                 group = "your_group_column", # For example dataset, group = "Environment"
                                 pathway = "KO",
                                 daa_method = "LinDA",
                                 ko_to_kegg = TRUE,
                                 order = "pathway_class",
                                 p_values_bar = TRUE,
                                 x_lab = "pathway_name")

# Access the plot and results dataframe for the first DA method
example_plot <- results_file_input[[1]]$plot
example_results <- results_file_input[[1]]$results

# Use the example data in ggpicrust2 package
data(ko_abundance)
data(metadata)
results_file_input <- ggpicrust2(data = ko_abundance,
                                 metadata = metadata,
                                 group = "Environment",
                                 pathway = "KO",
                                 daa_method = "LinDA",
                                 ko_to_kegg = TRUE,
                                 order = "pathway_class",
                                 p_values_bar = TRUE,
                                 x_lab = "pathway_name")

# Analyze the EC or MetaCyc pathway
data(metacyc_abundance)
results_file_input <- ggpicrust2(data = metacyc_abundance,
                                 metadata = metadata,
                                 group = "Environment",
                                 pathway = "MetaCyc",
                                 daa_method = "LinDA",
                                 ko_to_kegg = FALSE,
                                 order = "group",
                                 p_values_bar = TRUE,
                                 x_lab = "description")
results_file_input[[1]]$plot
results_file_input[[1]]$results

If an error occurs with ggpicrust2, please use the following workflow.

library(readr)
library(ggpicrust2)
library(tibble)
library(tidyverse)
library(ggprism)
library(patchwork)

# If you want to analyze KEGG pathway abundance instead of KO within the pathway, turn ko_to_kegg to TRUE.
# KEGG pathways typically have more explainable descriptions.

# Load metadata as a tibble
# data(metadata)
metadata <- read_delim("path/to/your/metadata.txt", delim = "\t", escape_double = FALSE, trim_ws = TRUE) 

# Load KEGG pathway abundance
# data(kegg_abundance)
kegg_abundance <- ko2kegg_abundance("path/to/your/pred_metagenome_unstrat.tsv") 

# Perform pathway differential abundance analysis (DAA) using ALDEx2 method
# Please change group to "your_group_column" if you are not using example dataset
daa_results_df <- pathway_daa(abundance = kegg_abundance, metadata = metadata, group = "Environment", daa_method = "ALDEx2", select = NULL, reference = NULL) 

# Filter results for ALDEx2_Welch's t test method
# Please check the unique(daa_results_df$method) and choose one
daa_sub_method_results_df <- daa_results_df[daa_results_df$method == "ALDEx2_Wilcoxon rank test", ]

# Annotate pathway results using KO to KEGG conversion
daa_annotated_sub_method_results_df <- pathway_annotation(pathway = "KO", daa_results_df = daa_sub_method_results_df, ko_to_kegg = TRUE)

# Generate pathway error bar plot
# Please change Group to metadata$your_group_column if you are not using example dataset
p <- pathway_errorbar(abundance = kegg_abundance, daa_results_df = daa_annotated_sub_method_results_df, Group = metadata$Environment, p_values_threshold = 0.05, order = "pathway_class", select = NULL, ko_to_kegg = TRUE, p_value_bar = TRUE, colors = NULL, x_lab = "pathway_name")

# If you want to analyze EC, MetaCyc, and KO without conversions, turn ko_to_kegg to FALSE.

# Load metadata as a tibble
# data(metadata)
metadata <- read_delim("path/to/your/metadata.txt", delim = "\t", escape_double = FALSE, trim_ws = TRUE)

# Load KO abundance as a data.frame
# data(ko_abundance)
ko_abundance <- read.delim("path/to/your/pred_metagenome_unstrat.tsv")

# Perform pathway DAA using ALDEx2 method
# Please change column_to_rownames() to the feature column if you are not using example dataset
# Please change group to "your_group_column" if you are not using example dataset
daa_results_df <- pathway_daa(abundance = ko_abundance %>% column_to_rownames("#NAME"), metadata = metadata, group = "Environment", daa_method = "ALDEx2", select = NULL, reference = NULL)

# Filter results for ALDEx2_Kruskal-Wallace test method
daa_sub_method_results_df <- daa_results_df[daa_results_df$method == "ALDEx2_Wilcoxon rank test", ]

# Annotate pathway results without KO to KEGG conversion
daa_annotated_sub_method_results_df <- pathway_annotation(pathway = "KO", daa_results_df = daa_sub_method_results_df, ko_to_kegg = FALSE)

# Generate pathway error bar plot
# Please change column_to_rownames() to the feature column
# Please change Group to metadata$your_group_column if you are not using example dataset
p <- pathway_errorbar(abundance = ko_abundance %>% column_to_rownames("#NAME"), daa_results_df = daa_annotated_sub_method_results_df, Group = metadata$Environment, p_values_threshold = 0.05, order = "group",
select = daa_annotated_sub_method_results_df %>% arrange(p_adjust) %>% slice(1:20) %>% dplyr::select(feature) %>% pull(), 
ko_to_kegg = FALSE, 
p_value_bar = TRUE, 
colors = NULL, 
x_lab = "description")

# Workflow for MetaCyc Pathway and EC

# Load MetaCyc pathway abundance and metadata
data("metacyc_abundance")
data("metadata")

# Perform pathway DAA using LinDA method
# Please change column_to_rownames() to the feature column if you are not using example dataset
# Please change group to "your_group_column" if you are not using example dataset
metacyc_daa_results_df <- pathway_daa(abundance = metacyc_abundance %>% column_to_rownames("pathway"), metadata = metadata, group = "Environment", daa_method = "LinDA")

# Annotate MetaCyc pathway results without KO to KEGG conversion
metacyc_daa_annotated_results_df <- pathway_annotation(pathway = "MetaCyc", daa_results_df = metacyc_daa_results_df, ko_to_kegg = FALSE)

# Generate pathway error bar plot
# Please change column_to_rownames() to the feature column
# Please change Group to metadata$your_group_column if you are not using example dataset
pathway_errorbar(abundance = metacyc_abundance %>% column_to_rownames("pathway"), daa_results_df = metacyc_daa_annotated_results_df, Group = metadata$Environment, ko_to_kegg = FALSE, p_values_threshold = 0.05, order = "group", select = NULL, p_value_bar = TRUE, colors = NULL, x_lab = "description")

# Generate pathway heatmap
# Please change column_to_rownames() to the feature column if you are not using example dataset
# Please change group to "your_group_column" if you are not using example dataset
feature_with_p_0.05 <- metacyc_daa_results_df %>% filter(p_adjust < 0.05)
pathway_heatmap(abundance = metacyc_abundance %>% filter(pathway %in% feature_with_p_0.05$feature) %>% column_to_rownames("pathway"), metadata = metadata, group = "Environment")

# Generate pathway PCA plot
# Please change column_to_rownames() to the feature column if you are not using example dataset
# Please change group to "your_group_column" if you are not using example dataset
pathway_pca(abundance = metacyc_abundance %>% column_to_rownames("pathway"), metadata = metadata, group = "Environment")

# Run pathway DAA for multiple methods
# Please change column_to_rownames() to the feature column if you are not using example dataset
# Please change group to "your_group_column" if you are not using example dataset
methods <- c("ALDEx2", "DESeq2", "edgeR")
daa_results_list <- lapply(methods, function(method) {
  pathway_daa(abundance = metacyc_abundance %>% column_to_rownames("pathway"), metadata = metadata, group = "Environment", daa_method = method)
})

# Compare results across different methods
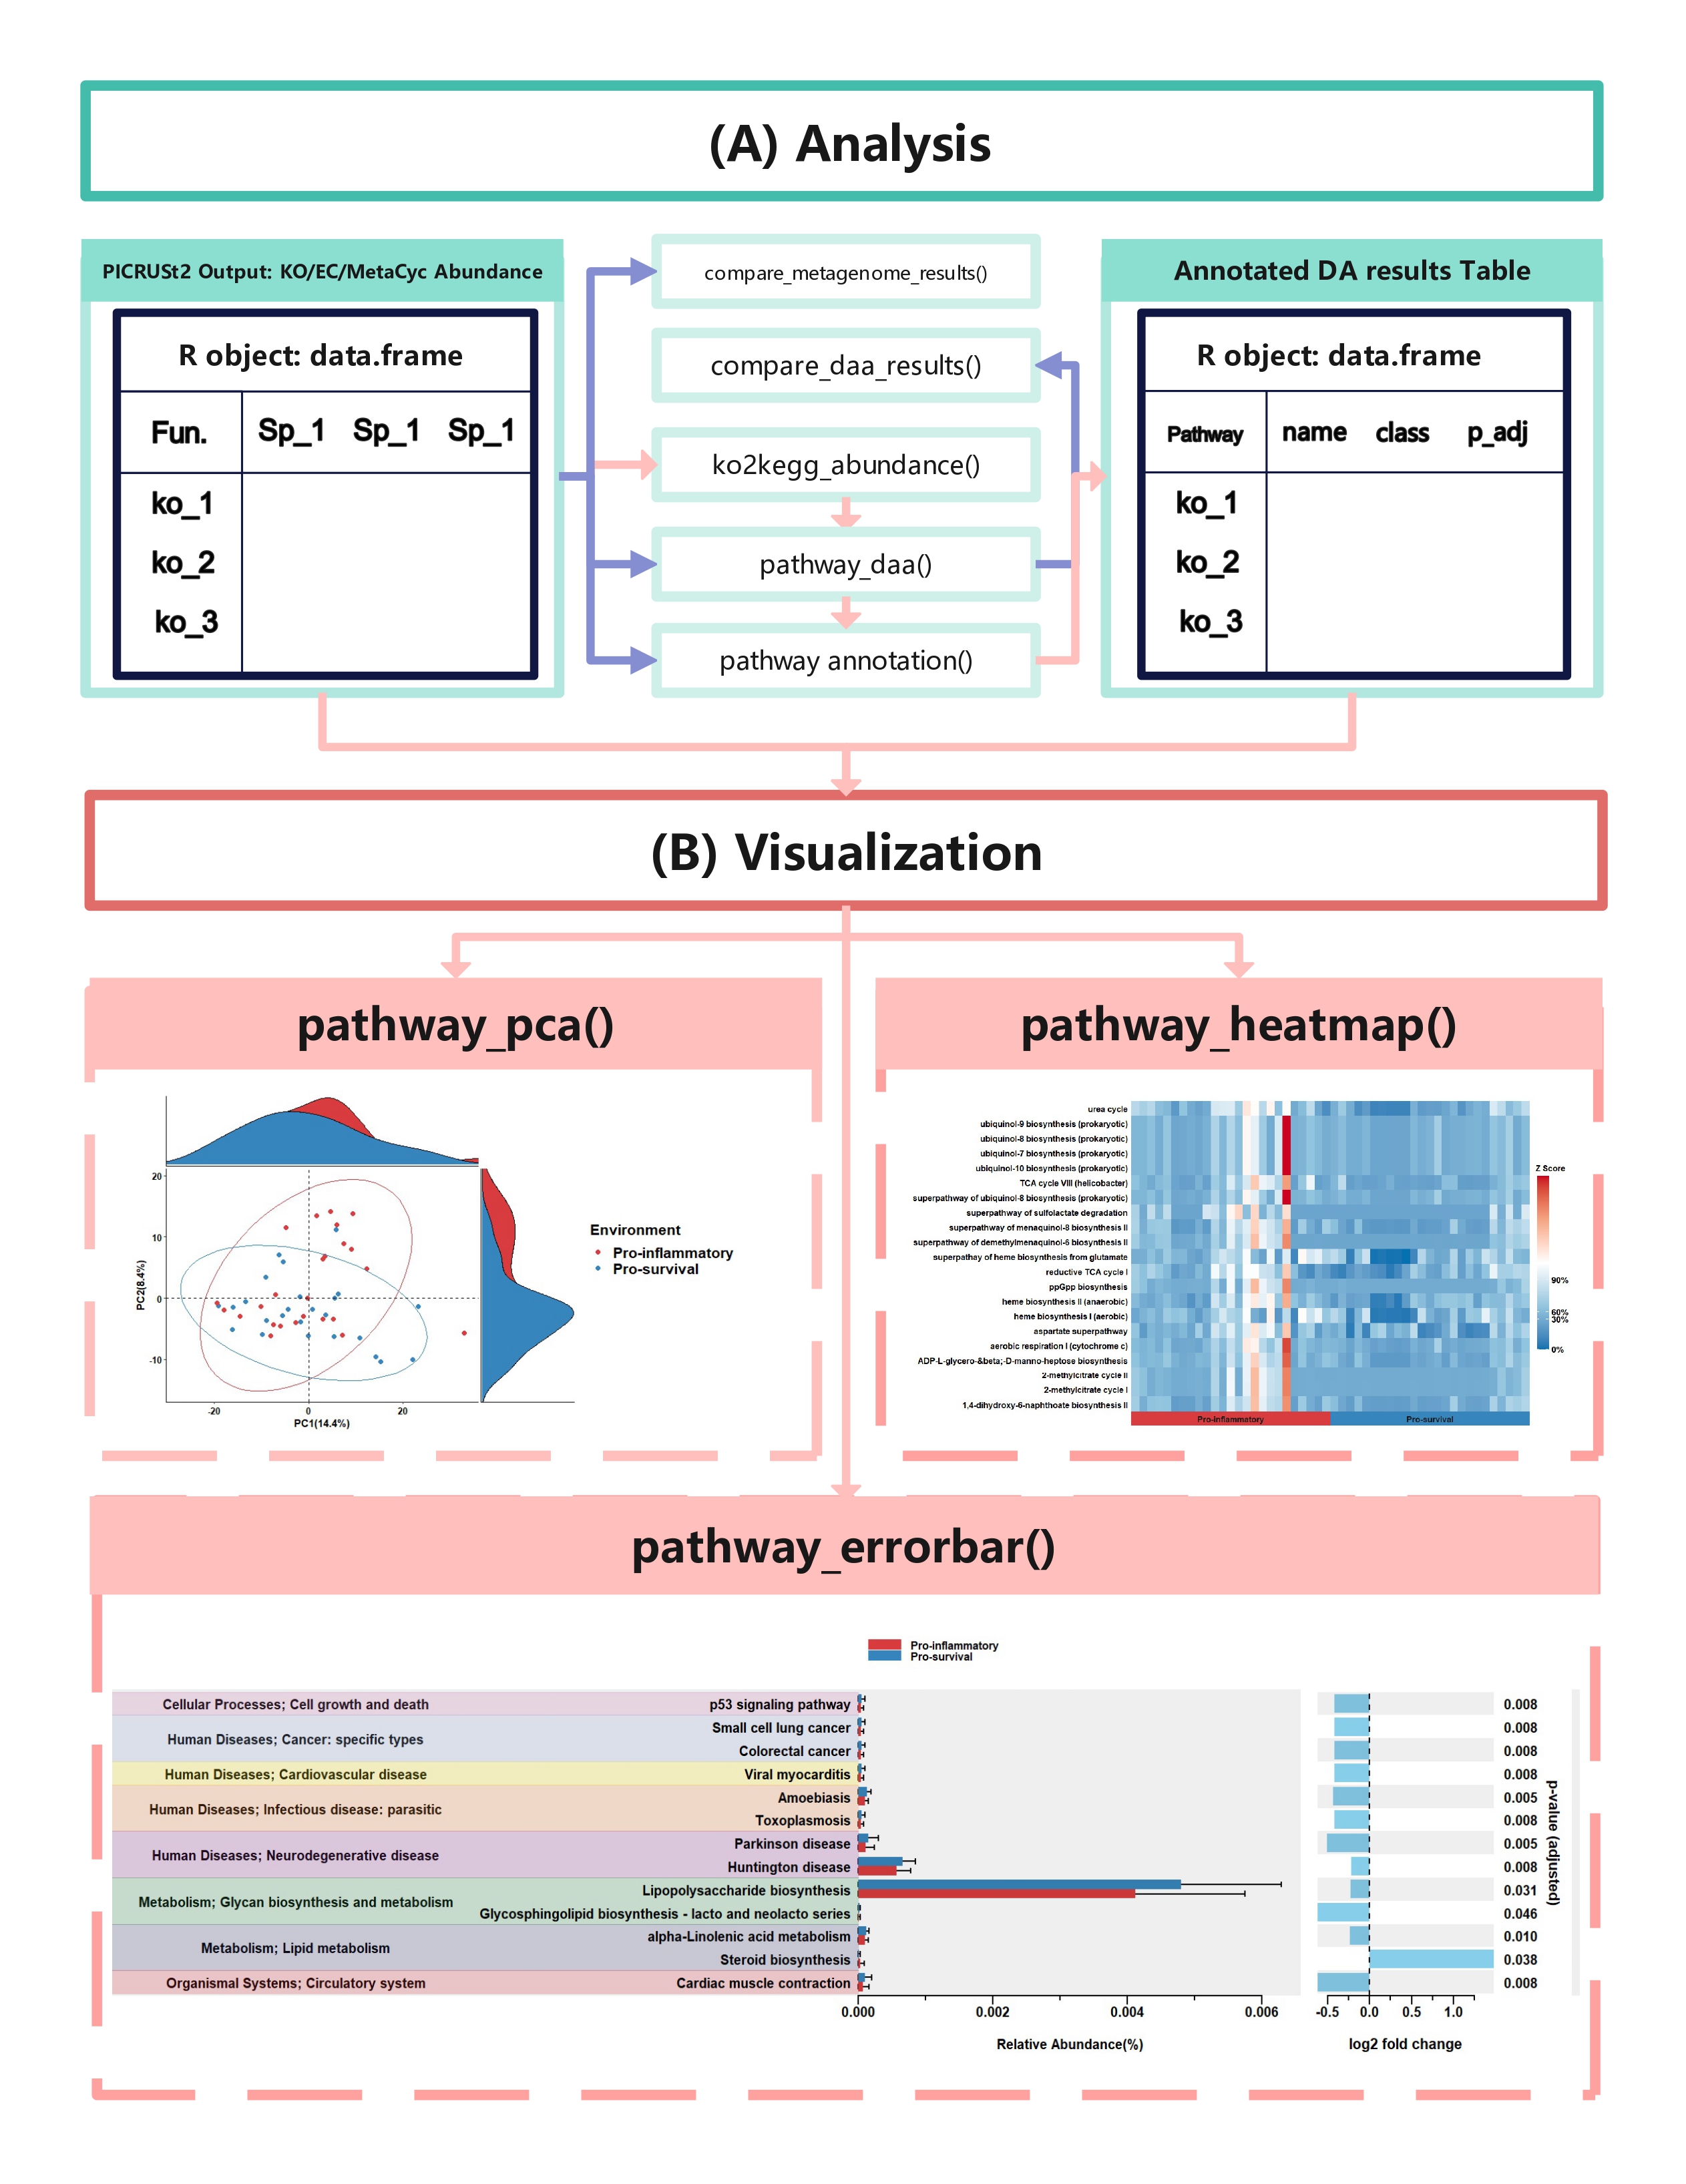
comparison_results <- compare_daa_results(daa_results_list = daa_results_list, method_names = c("ALDEx2_Welch's t test", "ALDEx2_Wilcoxon rank test", "DESeq2", "edgeR"))

Output

The typical output of the ggpicrust2 is like this.

function details

ko2kegg_abundance()

KEGG Orthology(KO) is a classification system developed by the Kyoto Encyclopedia of Genes and Genomes (KEGG) data-base(Kanehisa et al., 2022). It uses a hierarchical structure to classify enzymes based on the reactions they catalyze. To better understand pathways’ role in different groups and classify the pathways, the KO abundance table needs to be converted to KEGG pathway abundance. But PICRUSt2 removes the function from PICRUSt. ko2kegg_abundance() can help convert the table.

# Sample usage of the ko2kegg_abundance function
devtools::install_github('cafferychen777/ggpicrust2')

library(ggpicrust2)

# Assume that the KO abundance table is stored in a file named "ko_abundance.tsv"
ko_abundance_file <- "ko_abundance.tsv"

# Convert KO abundance to KEGG pathway abundance
kegg_abundance <- ko2kegg_abundance(file = ko_abundance_file)

# Alternatively, if the KO abundance data is already loaded as a data frame named "ko_abundance"
data("ko_abundance")
kegg_abundance <- ko2kegg_abundance(data = ko_abundance)

# The resulting kegg_abundance data frame can now be used for further analysis and visualization.

pathway_daa()

Differential abundance(DA) analysis plays a major role in PICRUSt2 downstream analysis. pathway_daa() integrates almost all DA methods applicable to the predicted functional profile which there excludes ANCOM and ANCOMBC. It includes ALDEx2(Fernandes et al., 2013), DESeq2(Love et al., 2014), Maaslin2(Mallick et al., 2021), LinDA(Zhou et al., 2022), edgeR(Robinson et al., 2010) , limma voom(Ritchie et al., 2015), metagenomeSeq(Paulson et al., 2013), Lefser(Segata et al., 2011).

# The abundance table is recommended to be a data.frame rather than a tibble.
# The abundance table should have feature names or pathway names as row names, and sample names as column names.
# You can use the output of ko2kegg_abundance
ko_abundance_file <- "path/to/your/pred_metagenome_unstrat.tsv"
kegg_abundance <- ko2kegg_abundance(ko_abundance_file) # Or use data(kegg_abundance)

metadata <- read_delim("path/to/your/metadata.txt", delim = "\t", escape_double = FALSE, trim_ws = TRUE)

# The default DAA method is "ALDEx2"
# Please change group to "your_group_column" if you are not using example dataset
daa_results_df <- pathway_daa(abundance = kegg_abundance, metadata = metadata, group = "Environment", daa_method = "linDA", select = NULL, p.adjust = "BH", reference = NULL)

# If you have more than 3 group levels and want to use the LinDA, limma voom, or Maaslin2 methods, you should provide a reference.
metadata <- read_delim("path/to/your/metadata.txt", delim = "\t", escape_double = FALSE, trim_ws = TRUE)

# Please change group to "your_group_column" if you are not using example dataset
daa_results_df <- pathway_daa(abundance = kegg_abundance, metadata = metadata, group = "Group", daa_method = "LinDA", select = NULL, p.adjust = "BH", reference = "Harvard BRI")

# Other example
data("metacyc_abundance")
data("metadata")
metacyc_daa_results_df <- pathway_daa(abundance = metacyc_abundance %>% column_to_rownames("pathway"), metadata = metadata, group = "Environment", daa_method = "LinDA", select = NULL, p.adjust = "BH", reference = NULL)

compare_daa_results()

library(ggpicrust2)
library(tidyverse)
data("metacyc_abundance")
data("metadata")

# Run pathway_daa function for multiple methods
# Please change column_to_rownames() to the feature column if you are not using example dataset
# Please change group to "your_group_column" if you are not using example dataset
methods <- c("ALDEx2", "DESeq2", "edgeR")
daa_results_list <- lapply(methods, function(method) {
  pathway_daa(abundance = metacyc_abundance %>% column_to_rownames("pathway"), metadata = metadata, group = "Environment", daa_method = method)
})

method_names <- c("ALDEx2","DESeq2", "edgeR")
# Compare results across different methods
comparison_results <- compare_daa_results(daa_results_list = daa_results_list, method_names = method_names)

pathway_annotation()

If you are in China and you are using kegg pathway annotation, Please make sure your internet can break through the firewall.

# Make sure to check if the features in `daa_results_df` correspond to the selected pathway

# Annotate KEGG Pathway
data("kegg_abundance")
data("metadata")
# Please change group to "your_group_column" if you are not using example dataset
daa_results_df <- pathway_daa(abundance = kegg_abundance, metadata = metadata, group = "Environment", daa_method = "LinDA")
daa_annotated_results_df <- pathway_annotation(pathway = "KO", daa_results_df = daa_results_df, ko_to_kegg = TRUE)

# Annotate KO
data("ko_abundance")
data("metadata")
# Please change column_to_rownames() to the feature column if you are not using example dataset
# Please change group to "your_group_column" if you are not using example dataset
daa_results_df <- pathway_daa(abundance = ko_abundance %>% column_to_rownames("#NAME"), metadata = metadata, group = "Environment", daa_method = "LinDA")
daa_annotated_results_df <- pathway_annotation(pathway = "KO", daa_results_df = daa_results_df, ko_to_kegg = FALSE)

# Annotate KEGG
# daa_annotated_results_df <- pathway_annotation(pathway = "EC", daa_results_df = daa_results_df, ko_to_kegg = FALSE)

# Annotate MetaCyc Pathway
data("metacyc_abundance")
data("metadata")
# Please change column_to_rownames() to the feature column if you are not using example dataset
# Please change group to "your_group_column" if you are not using example dataset
metacyc_daa_results_df <- pathway_daa(abundance = metacyc_abundance %>% column_to_rownames("pathway"), metadata = metadata, group = "Environment", daa_method = "LinDA")
metacyc_daa_annotated_results_df <- pathway_annotation(pathway = "MetaCyc", daa_results_df = metacyc_daa_results_df, ko_to_kegg = FALSE)

pathway_errorbar()

data("ko_abundance")
data("metadata")
kegg_abundance <- ko2kegg_abundance(data = ko_abundance) # Or use data(kegg_abundance)
# Please change group to "your_group_column" if you are not using example dataset
daa_results_df <- pathway_daa(kegg_abundance, metadata = metadata, group = "Environment", daa_method = "LinDA")
daa_annotated_results_df <- pathway_annotation(pathway = "KO", daa_results_df = daa_results_df, ko_to_kegg = TRUE)
# Please change Group to metadata$your_group_column if you are not using example dataset
p <- pathway_errorbar(abundance = kegg_abundance,
           daa_results_df = daa_annotated_results_df,
           Group = metadata$Environment,
           ko_to_kegg = TRUE,
           p_values_threshold = 0.05,
           order = "pathway_class",
           select = NULL,
           p_value_bar = TRUE,
           colors = NULL,
           x_lab = "pathway_name")

# If you want to analysis the EC. MetaCyc. KO without conversions. 
data("metacyc_abundance")
data("metadata")
metacyc_daa_results_df <- pathway_daa(abundance = metacyc_abundance %>% column_to_rownames("pathway"), metadata = metadata, group = "Environment", daa_method = "LinDA")
metacyc_daa_annotated_results_df <- pathway_annotation(pathway = "MetaCyc", daa_results_df = metacyc_daa_results_df, ko_to_kegg = FALSE)
p <- pathway_errorbar(abundance = metacyc_abundance %>% column_to_rownames("pathway"),
           daa_results_df = metacyc_daa_annotated_results_df,
           Group = metadata$Environment,
           ko_to_kegg = FALSE,
           p_values_threshold = 0.05,
           order = "group",
           select = NULL,
           p_value_bar = TRUE,
           colors = NULL,
           x_lab = "description")

pathway_heatmap()

In this section, we will demonstrate how to create a pathway heatmap using the pathway_heatmap function in the ggpicrust2 package. This function visualizes the relative abundance of pathways in different samples.

Use the fake dataset

# Create example functional pathway abundance data
abundance_example <- matrix(rnorm(30), nrow = 3, ncol = 10)
colnames(abundance_example) <- paste0("Sample", 1:10)
rownames(abundance_example) <- c("PathwayA", "PathwayB", "PathwayC")

# Create example metadata
# Please change your sample id's column name to sample_name
metadata_example <- data.frame(sample_name = colnames(abundance_example),
                               group = factor(rep(c("Control", "Treatment"), each = 5)))

# Create a heatmap
pathway_heatmap(abundance_example, metadata_example, "group")

Use the real dataset

library(tidyverse)
library(ggh4x)
library(ggpicrust2)
# Load the data
data("metacyc_abundance")

# Load the metadata
data("metadata")

# Perform differential abundance analysis
metacyc_daa_results_df <- pathway_daa(
  abundance = metacyc_abundance %>% column_to_rownames("pathway"),
  metadata = metadata,
  group = "Environment",
  daa_method = "LinDA"
)

# Annotate the results
annotated_metacyc_daa_results_df <- pathway_annotation(
  pathway = "MetaCyc",
  daa_results_df = metacyc_daa_results_df,
  ko_to_kegg = FALSE
)

# Filter features with p < 0.05
feature_with_p_0.05 <- metacyc_daa_results_df %>% 
  filter(p_adjust < 0.05)

# Create the heatmap
pathway_heatmap(
  abundance = metacyc_abundance %>% 
    right_join(
      annotated_metacyc_daa_results_df %>% select(all_of(c("feature","description"))),
      by = c("pathway" = "feature")
    ) %>% 
    filter(pathway %in% feature_with_p_0.05$feature) %>% 
    select(-"pathway") %>% 
    column_to_rownames("description"),
  metadata = metadata, 
  group = "Environment"
)

pathway_pca()

In this section, we will demonstrate how to perform Principal Component Analysis (PCA) on functional pathway abundance data and create visualizations of the PCA results using the pathway_pca function in the ggpicrust2 package.

Use the fake dataset

# Create example functional pathway abundance data
abundance_example <- matrix(rnorm(30), nrow = 3, ncol = 10)
colnames(abundance_example) <- paste0("Sample", 1:10)
rownames(kegg_abundance_example) <- c("PathwayA", "PathwayB", "PathwayC")

# Create example metadata
metadata_example <- data.frame(sample_name = colnames(kegg_abundance_example),
                                group = factor(rep(c("Control", "Treatment"), each = 5)))
# Perform PCA and create visualizations
pathway_pca(abundance = abundance_example, metadata = metadata_example, "group")

Use the real dataset

# Create example functional pathway abundance data
data("metacyc_abundance")
data("metadata")

pathway_pca(abundance = metacyc_abundance %>% column_to_rownames("pathway"), metadata = metadata, group = "Environment")

compare_metagenome_results()

library(ComplexHeatmap)
set.seed(123)
# First metagenome
metagenome1 <- abs(matrix(rnorm(1000), nrow = 100, ncol = 10))
rownames(metagenome1) <- paste0("KO", 1:100)
colnames(metagenome1) <- paste0("sample", 1:10)
# Second metagenome
metagenome2 <- abs(matrix(rnorm(1000), nrow = 100, ncol = 10))
rownames(metagenome2) <- paste0("KO", 1:100)
colnames(metagenome2) <- paste0("sample", 1:10)
# Put the metagenomes into a list
metagenomes <- list(metagenome1, metagenome2)
# Define names
names <- c("metagenome1", "metagenome2")
# Call the function
results <- compare_metagenome_results(metagenomes, names)
# Print the correlation matrix
print(results$correlation$cor_matrix)
# Print the p-value matrix
print(results$correlation$p_matrix)

Share

Twitter

Facebook

LinkedIn

Reddit

FAQ

Issue 1: pathway_errorbar error

When using pathway_errorbar with the following parameters:

pathway_errorbar(abundance = abundance,
                 daa_results_df = daa_results_df,
                 Group = metadata$Environment,
                 ko_to_kegg = TRUE,
                 p_values_threshold = 0.05,
                 order = "pathway_class",
                 select = NULL,
                 p_value_bar = TRUE,
                 colors = NULL,
                 x_lab = "pathway_name")

You may encounter an error:

Error in `ggplot_add()`:
! Can't add `e2` to a <ggplot> object.
Run `rlang::last_trace()` to see where the error occurred.

Make sure you have the patchwork package loaded:

library(patchwork)

Issue 2: guide_train.prism_offset_minor error

You may encounter an error with guide_train.prism_offset_minor:

Error in guide_train.prism_offset_minor(guide, panel_params[[aesthetic]]) : 
  No minor breaks exist, guide_prism_offset_minor needs minor breaks to work

Error in get(as.character(FUN),mode = "function"object envir = envir)
guide_prism_offset_minor' of mode'function' was not found

Ensure that the ggprism package is loaded:

library(ggprism)

Issue 3: SSL certificate problem

When encountering the following error:

SSL peer certificate or SSH remote key was not OK: [rest.kegg.jp] SSL certificate problem: certificate has expired

If you are in China, make sure your computer network can bypass the firewall.

Issue 4: Bad Request (HTTP 400)

When encountering the following error:

Error in .getUrl(url, .flatFileParser) : Bad Request (HTTP 400).

Please restart R session.

Issue 5: Error in grid.Call(C_textBounds, as.graphicsAnnot(xlabel),x$x, x$y, :

When encountering the following error:

Error in grid.Call(C_textBounds, as.graphicsAnnot(xlabel),x$x, x$y, :

Please having some required fonts installed. You can refer to this thread.

Issue 6: Visualization becomes cluttered when there are more than 30 features of statistical significance.

When faced with this issue, consider the following solutions:

Solution 1: Utilize the ‘select’ parameter

The ‘select’ parameter allows you to specify which features you wish to visualize. Here’s an example of how you can apply this in your code:

ggpicrust2::pathway_errorbar(
  abundance = kegg_abundance,
  daa_results_df = daa_results_df_annotated,
  Group = metadata$Day,
  p_values_threshold = 0.05,
  order = "pathway_class",
  select = c("ko05340", "ko00564", "ko00680", "ko00562", "ko03030", "ko00561", "ko00440", "ko00250", "ko00740", "ko04940", "ko00010", "ko00195", "ko00760", "ko00920", "ko00311", "ko00310", "ko04146", "ko00600", "ko04141", "ko04142", "ko00604", "ko04260", "ko00909", "ko04973", "ko00510", "ko04974"),
  ko_to_kegg = TRUE,
  p_value_bar = FALSE,
  colors = NULL,
  x_lab = "pathway_name"
)

Solution 2: Limit to the Top 20 features

If there are too many significant features to visualize effectively, you might consider limiting your visualization to the top 20 features with the smallest adjusted p-values:

daa_results_df_annotated <- daa_results_df_annotated[!is.na(daa_results_df_annotated$pathway_name),]

daa_results_df_annotated$p_adjust <- round(daa_results_df_annotated$p_adjust,5)

low_p_feature <- daa_results_df_annotated[order(daa_results_df_annotated$p_adjust), ]$feature[1:20]


p <- ggpicrust2::pathway_errorbar(
  abundance = kegg_abundance,
  daa_results_df = daa_results_df_annotated,
  Group = metadata$Day,
  p_values_threshold = 0.05,
  order = "pathway_class",
  select = low_p_feature,
  ko_to_kegg = TRUE,
  p_value_bar = FALSE,
  colors = NULL,
  x_lab = "pathway_name"
)

Issue 7: There are no statistically significant biomarkers

If you are not finding any statistically significant biomarkers in your analysis, there could be several reasons for this:

  1. The true difference between your groups is small or non-existent. If the microbial communities or pathways you’re comparing are truly similar, then it’s correct and expected that you won’t find significant differences.

  2. Your sample size might be too small to detect the differences. Statistical power, the ability to detect differences if they exist, increases with sample size.

  3. The variation within your groups might be too large. If there’s a lot of variation in microbial communities within a single group, it can be hard to detect differences between groups.

Here are a few suggestions:

  1. Increase your sample size: If possible, adding more samples to your analysis can increase your statistical power, making it easier to detect significant differences.

  2. Decrease intra-group variation: If there’s a lot of variation within your groups, consider whether there are outliers or subgroups that are driving this variation. You might need to clean your data, or to stratify your analysis to account for these subgroups.

  3. Change your statistical method or adjust parameters: Depending on the nature of your data and your specific question, different statistical methods might be more or less powerful. If you’re currently using a parametric test, consider using a non-parametric test, or vice versa. Also, consider whether adjusting the parameters of your current test might help.

Remember, not finding significant results is also a result and can be informative, as it might indicate that there are no substantial differences between the groups you’re studying. It’s important to interpret your results in the context of your specific study and not to force statistical significance where there isn’t any.

With these strategies, you should be able to create a more readable and informative visualization, even when dealing with a large number of significant features.

Author’s Other Projects

  1. MicrobiomeStat: The MicrobiomeStat package is a dedicated R tool for exploring longitudinal microbiome data. It also accommodates multi-omics data and cross-sectional studies, valuing the collective efforts within the community. This tool aims to support researchers through their extensive biological inquiries over time, with a spirit of gratitude towards the community’s existing resources and a collaborative ethos for furthering microbiome research.

If you’re interested in helping to test and develop MicrobiomeStat, please contact [email protected].

  1. MicrobiomeGallery: This is a web-based platform currently under development, which aims to provide a space for sharing microbiome data visualization code and datasets.

We look forward to sharing more updates as these projects progress.

ggpicrust2's People

Contributors

allcontributors[bot] avatar cafferychen777 avatar olivroy avatar

Stargazers

 avatar  avatar  avatar  avatar  avatar  avatar  avatar  avatar  avatar  avatar  avatar  avatar  avatar  avatar  avatar  avatar  avatar  avatar  avatar  avatar  avatar  avatar  avatar  avatar  avatar  avatar  avatar  avatar  avatar  avatar  avatar  avatar  avatar  avatar  avatar  avatar  avatar  avatar  avatar  avatar  avatar  avatar  avatar  avatar  avatar  avatar  avatar  avatar  avatar  avatar  avatar  avatar  avatar  avatar  avatar  avatar  avatar  avatar  avatar  avatar  avatar  avatar  avatar  avatar  avatar  avatar  avatar  avatar  avatar  avatar  avatar  avatar  avatar  avatar  avatar  avatar  avatar  avatar  avatar  avatar  avatar  avatar  avatar  avatar  avatar  avatar  avatar  avatar  avatar  avatar  avatar  avatar  avatar  avatar  avatar  avatar  avatar

Watchers

 avatar  avatar

ggpicrust2's Issues

Error after pathway_errorbar

Hi (and thanks for creating this tool!)

I am running ggpicrust2 one function at a time but struggling with the pathway_errorbar function.

My code
kegg_abundance <- ko2kegg_abundance(abundance_file)

daa_results <- pathway_daa(kegg_abundance, meta_table, 'Day', daa_method = 'ALDEx2', select = NULL,
p.adjust = 'bonferroni', reference = NULL)

daa_results_method <- daa_results[daa_results$method == 'ALDEx2_Kruskal-Wallace test', ]

daa_results_method1 <- daa_results_method[1:100,]
daa_results_method2 <- daa_results_method[101:200,]
daa_results_method3 <- daa_results_method[201:253,]

pa_results1 <- pathway_annotation(pathway = 'KO', daa_results_df = daa_results_method1, ko_to_kegg = TRUE)
pa_results2 <- pathway_annotation(pathway = 'KO', daa_results_df = daa_results_method2, ko_to_kegg = TRUE)
pa_results3 <- pathway_annotation(pathway = 'KO', daa_results_df = daa_results_method3, ko_to_kegg = TRUE)

pa_results <- rbind(pa_results1, pa_results2, pa_results3)

pa_results_padj <- subset(pa_results, p_adjust < 0.001)

Group <- meta_table$Day

daa_results_list <- pathway_errorbar(abundance = kegg_abundance, daa_results_df = pa_results,
Group = Group,
ko_to_kegg = TRUE, p_values_threshold = 0.05, order = "pathway_class",
select = 'NULL',
p_value_bar = TRUE,
colors = NULL,
x_lab = 'description')

Output of pathway_errorbar
The feature with statistically significance is zero, pathway_errorbar can't do the visualization.
Error in h(simpleError(msg, call)) :
error in evaluating the argument 'physeq' in selecting a method for function 'taxa_are_rows': invalid class “otu_table” object:
OTU abundance data must have non-zero dimensions.

Can you please help me with this error? Everything else worked fine! My pa_results table doesn't have a column called x_lab. Is this the problem?

pathway_annotation(): Error in curl::curl_fetch_memory(url, handle = handle) : Failure when receiving data from the peer

Dear Caffery,

Thank you for developing the ggpicrust2 package!
I followed the codes on the tutorial with my own dataset, I ran the command pathway_annotation():
daa_annotated_sub_method_results_df <- pathway_annotation(pathway = "KO", daa_results_df = daa_sub_method_results_df[1:50,], ko_to_kegg = TRUE)
but encountered the following error:
Error in curl::curl_fetch_memory(url, handle = handle) : Failure when receiving data from the peer
May I have some advice on how to solve it, thank you!

Best regards,
Ivan

Error in differential abundance analysis

Hi,
I tried to use your package for my dataset and only got it to work partly. The requirements for the input format for the functions are quite rigid, and then also not the same for all the functions. It would be nice if you could harmonise this.
Until then, for everyone with the same problem, here's the code that worked for me:

library(ggpicrust2)
#I used the picrust2_pipeline.py script, so those are the path and name automatically given to the file.
abundance_file <- "picrust2_out_pipeline/KO_metagenome_out/pred_metagenome_unstrat.tsv"
abundance <- ko2kegg_abundance(abundance_file)

#using metadata from a phyloseq object, so first converting to a normal dataframe
meta <- data.frame(sample_data(physeq))
meta$sample_name <- rownames(meta) #important to name the column sample_name
meta <- tibble(meta)

#I'm comparing different water bodies
group <- "water_body"

#this is the only command that needs the abundance table as a matrix and metadata as a dataframe.
#Additionally, the sample names need to be in a column which is called "sample_names", although this is nowhere stated in the documentation. 
pathway_heatmap(as.matrix(abundance), data.frame(meta), group)+
               theme(axis.text.x = element_text(size = 8, color = "black")) #to add sample names

pathway_pca(abundance = abundance, metadata = meta, group = group)

daa <- pathway_daa(abundance = abundance, metadata = meta, group = group,
                   daa_method = "ALDEx2")
daa_kegg <- pathway_annotation(daa_results_df = daa, ko_to_kegg = TRUE)

This is how far I got.
pathway_errorbar() needs the package ggprism to be installed, maybe this should be added as a dependency?
But it still doesn't work, here's the code I tried:

pathway_errorbar(abundance = abundance,
                 daa_results_df = daa_kegg[1:20,],  #subsetting to have less than 30
                 Group = meta$water_body,
                 ko_to_kegg = TRUE,
                 p_values_threshold = 0.05,
                 order = "group",
                 select = NULL,
                 p_value_bar = TRUE,
                 colors = NULL,
                 x_lab = NULL)

The error message is: Insufficient values in manual scale. 3 needed but only 2 provided.
Doesn't work either when I provide colors manually by setting colors = c("blue", "green", "red"). Any idea how to fix this?
In addition, I couldn't figure out how to use the select parameter, tried select = c("ko05340", "ko00562") but that didn't work, so I resorted to subsetting the input dataframe.

Other remarks:
It would be cool if you could select to plot PC3 and PC4 in the PCA, not only PC1 and PC2.
How to add the group labels in the heatmap as you did in the paper preprint?

Thanks for creating this package!

pathway_errorbar(): `levels<-`(`*tmp*`, value = as.character(levels)) : factor level [3] is duplicated

Creating pathway error bar plots...
Error in `levels<-`(`*tmp*`, value = as.character(levels)) : 
  factor level [3] is duplicated

when running

results_file <- ggpicrust2(file = abundance_file,
                                 metadata = metadata,
                                 group = "treatment", 
                                 pathway = "KO",
                                 daa_method = "LinDA",
                                 ko_to_kegg = TRUE,
                                 order = "pathway_class",
                                 p_values_bar = TRUE,
                                 x_lab = "pathway_name",
                                reference = "C")

My metadata consists of a column "treatment" with 6 different levels. levels(metadata$treatment) NULL . Same error occurs after applying levels. metadata$treatment <- factor(metadata$treatment, levels=c("A", "B", "C", "D", "E", "F"))
I can run ggpicrust2 with reference "A" and "B" without any issues and I can run it with another dataset with similar metadata structure without any issues.
Could you please help me fix this error?
Thank you!

pathway_heatmap not returning as expected

I ran the following code

pathway_heatmap(t(abundance_matrix), metadata, "Txt")

with these files.

metadata.txt
abundance_matrix.csv

I then got something that looks like this:

image

Even ignoring the crazy size, it looks like all the cells of the heatmap are approximately the same color, so there's no range represented. I know that there are significant differences between my VEH and MOR level of the Txt group (see below).

image

What is going on?

heat map issues

here is my metadata
metadata2.csv

and my ko adundances
HPabun.csv

code for map:
heatmap_plot <- pathway_heatmap(t(SAUN_matrix), metadata, "CST")
print(heatmap_plot)

what I get
image

it doesn't have CST and isn't normalized

what it looks like when I normalize with ggplot:
image

trying to figure out what is happening

ko2kegg_abundance(): KO2Kegg abundance returning empty output.

I am running the following:

`kegg_abundance <- ko2kegg_abundance("Dropbox/CSIRO_Picrustrun/picrust2_out_pipeline_CSIRO2/KO_predicted.tsv")
Rows: 7130 Columns: 10544
── Column specification ───────────────────────────────────────────────────────────────────────────────────────
Delimiter: "\t"
chr (1): sequence
dbl (10543): K00001, K00002, K00003, K00004, K00005, K00006, K00007, K00008, K00009, K00010, K00011, K00012...

ℹ Use spec() to retrieve the full column specification for this data.
ℹ Specify the column types or set show_col_types = FALSE to quiet this message.
Calculation may take a long time, please be patient.
The kegg pathway with zero abundance in all the different samples has been removed.

Perform pathway differential abundance analysis (DAA) using ALDEx2 method

Please change group to "your_group_column" if you are not using example dataset

daa_results_df2 <- pathway_daa(abundance = kegg_abundance,

  •                           metadata = metdata.tab, 
    
  •                           group = "Treatment",
    
  •                           daa_method = "ALDEx2", 
    
  •                           select = NULL, 
    
  •                           reference = NULL) 
    

Error in metadata[, matching_columns]:
! Can't subset columns with matching_columns.
✖ Subscript matching_columns can't contain missing values.
✖ It has a missing value at location 1.`

I have run metacyc analysis no problem but wanted to see why this could be?

finding KO's that contributed to KEGG pathway, KO_to_kegg=FALSE, and Implementing LEfSe

I have four different questions - I hope it's not too much to post them here all at once! :)

  1. I successfully used ggpicrust2 to run a DESeq2 analysis on my data (code below):

results_DESeq2_BH <- ggpicrust2(file = ko_abundance, metadata = metadata, group = "case_control_status", pathway = "KO", daa_method = "DESeq2", reference = "Control", p.adjust = "BH", ko_to_kegg = TRUE, order = "pathway_class", p_values_bar = TRUE, x_lab = "pathway_name")

This gives me an output with graphics and stuff, HOWEVER, I also get this printed out:

Performing pathway differential abundance analysis... DESeq2 is only suitable for comparison between two groups. converting counts to integer mode it appears that the last variable in the design formula, 'Group_group_nonsense', has a factor level, 'Control', which is not the reference level. we recommend to use factor(...,levels=...) or relevel() to set this as the reference level before proceeding. for more information, please see the 'Note on factor levels' in vignette('DESeq2').

Control is, in fact, a level in "cause_control_status," so I'm not quite sure what to do to fix that.

  1. I get 3 KEGG pathways that are significantly differently expressed from the above code, which is great. I would like to know which KO's contributed to that KEGG pathway - is there a way to find this out? For example, the pathway "Epithelial cell invasion" is unregulated in my treatment. How do I find out which KO's specifically contributed to this "Epithelial cell invasion" pathway?

  2. When I change KO_to_kegg to FALSE (as shown below), I get this error:

results_DESeq2_BH <- ggpicrust2(file = ko_abundance, metadata = metadata, group = "case_control_status", pathway = "KO", daa_method = "DESeq2", reference = "Control", p.adjust = "BH", ko_to_kegg = FALSE, order = "pathway_class", p_values_bar = TRUE, x_lab = "pathway_name")

Performing pathway differential abundance analysis... DESeq2 is only suitable for comparison between two groups. converting counts to integer mode it appears that the last variable in the design formula, 'Group_group_nonsense', has a factor level, 'Control', which is not the reference level. we recommend to use factor(...,levels=...) or relevel() to set this as the reference level before proceeding. for more information, please see the 'Note on factor levels' in vignette('DESeq2'). using pre-existing size factors estimating dispersions gene-wise dispersion estimates mean-dispersion relationship final dispersion estimates fitting model and testing -- replacing outliers and refitting for 1699 genes -- DESeq argument 'minReplicatesForReplace' = 7 -- original counts are preserved in counts(dds) estimating dispersions fitting model and testing Annotating pathways... Creating pathway error bar plots... Error in [.data.frame(daa_results_df, , x_lab) : undefined columns selected

I suspect I have the wrong label for the x-axis, but I don't know what the appropriate one is here.

  1. I would like to implement LEfSe to analyze this data as well, but when I put it in as a method the code won't run. Is there something I am doing wrong on input?

results_Lefse_BH <- ggpicrust2(file = ko_abundance, metadata = metadata, group = "case_control_status", pathway = "KO", daa_method = "Lefse", reference = "Control", p.adjust = "BH", ko_to_kegg = TRUE, order = "pathway_class", p_values_bar = TRUE, x_lab = "pathway_name")

Performing pathway differential abundance analysis... Error in p.adjust(p_values_df$p_values, method = "BH") : object 'p_values_df' not found

Thank you so much!

pathway_errorbar(): "Error in guide_train.prism_offset_minor" when ggprism loaded

Hi again, different issue this time!

Because the KEGG database annotation was taking so long for me, I decided to run through the workflow for the EC annotation. Much faster! But I am still running into some new errors at the pathway_errorbar() stage. Below is my code, and data so you can hopefully reproduce the issue.
But first, my environment is as follows:
package loadedversion
ape ape 5.7-1
dplyr dplyr 1.1.2
forcats forcats 1.0.0
genefilter genefilter 1.80.3
ggpicrust2 ggpicrust2 1.6.2
ggplot2 ggplot2 3.4.2
ggprism ggprism 1.0.4
ggpubr ggpubr 0.6.0
HTSSIP HTSSIP 1.4.1
lattice lattice 0.21-8
lubridate lubridate 1.9.2
patchwork patchwork 1.1.2
permute permute 0.9-7
phyloseq phyloseq 1.42.0
purrr purrr 1.0.1
readr readr 2.1.4
stringr stringr 1.5.0
tibble tibble 3.2.1
tidyr tidyr 1.3.0
tidyverse tidyverse 2.0.0
vegan vegan 2.6-4

Now my code:

library(phyloseq)
library(ggplot2)
library(ape)
library(vegan)
library(ggpubr)
library(tidyverse)
library(genefilter)
library(HTSSIP)
library(ggprism)
library(patchwork)
library(ggpicrust2)


metadata <- read_table("../Input files/ADWMBAT Combined Metadata.txt")

metadata <- metadata %>%
  filter(sex == "F" & all_data == "Y") %>%
  select(!X8) %>%
  mutate(genotype = as.factor(genotype))
# read in sample meta data as a tibble, and set genotype as a factor


ko_abundance <-
  read.delim(
    "../Data/For PICRUSt/picrust2_out_pipeline/EC_metagenome_out/pred_metagenome_unstrat.tsv"
  )
# load the EC count data in

rownames(ko_abundance) <- ko_abundance$function.
ko_abundance <- ko_abundance[, -1]
# remove the first column of function names by setting them as the row names. This is done because it's the format the next step, pathway_daa(), expects to see.

ko_abundance <- ko_abundance %>%
  rename('24' = X24,
         '26' = X26)
# rename some column names to match metadata file


daa_results_df <-
  pathway_daa(
    abundance = ko_abundance,
    metadata = metadata,
    group = "genotype",
    daa_method = "LinDA",
    select = NULL,
    reference = "WT",
    p.adjust = "none"
  )
# run the differential abundance calcualtion step using LinDA and no p-value adjustment

daa_annotated_sub_method_results_df <-
  pathway_annotation(pathway = "EC",
                     daa_results_df = daa_results_df,
                     ko_to_kegg = FALSE)

# select top 15 differentially expressed features 
# this done because there were too many "significant" without using FDR correction
daa_annotated_sub_method_results_df_filtered <- daa_annotated_sub_method_results_df %>%
  arrange(p_adjust) %>%
  slice_head(n = 15)

ko_abundance_plot <- ko_abundance %>%
  filter(rownames(ko_abundance) %in% daa_annotated_sub_method_results_df_filtered$feature)
# above was attempted to see if the ko_abundance object needed to be the same dimensions as the daa_results. didn't help.

daa_results_list <-
  pathway_errorbar(
    abundance = ko_abundance,
    daa_results_df = daa_annotated_sub_method_results_df_filtered,
    Group = "genotype",
    p_values_threshold = 0.05,
    order = "group",
    select = NULL,
    ko_to_kegg = FALSE,
    p_value_bar = TRUE,
    colors = NULL,
    x_lab = "description"
  )

print(daa_results_list)

For me executing all this code produces this error:
"Error in guide_train.prism_offset_minor(guide, panel_params[[aesthetic]]) :
No minor breaks exist, guide_prism_offset_minor needs minor breaks to work
In addition: Warning messages:
1: Removed 15 rows containing missing values (geom_bar()).
2: Removed 15 rows containing missing values (geom_stripped_cols()). "

Trying to view() the daa_results_list object issues the following error:
"Error: Index out of bounds"

Here are my files:
pred_metagenome_unstrat.tsv.gz

ADWMBAT Combined Metadata.txt

Thanks for any help you can provide!

A bug in the function pathway_errorbar()

Hi,

Thank you for developing this package.

As I ran through the workflow, I got an error with the funciton pathway_errorbar()
Error in daa_results_df$pathway_name$description : $ operator is invalid for atomic vectors

The problem comes from this line of code in the function:

      if (is.null(daa_results_df$pathway_name)&is.null(daa_results_df$pathway_name$description)){
        message("Please use pathway_annotation to annotate the daa_results_df")
      }

precisely: is.null(daa_results_df$pathway_name$description)

The output of daa_results_df has a description column but not under pathway_name.

This will work if I change it to is.null(daa_results_df$description).

Hope you can fix this.

Thanks,

ggpicrust2 installation dependency error

I tried to install "ggpicrust2" with "install.packages("ggpicrust2")".
ERROR: unable to collate and parse R files for package ‘ggfun’

  • removing ‘/home/xuan/R/x86_64-pc-linux-gnu-library/4.1/ggfun’
    ERROR: dependency ‘ggfun’ is not available for package ‘aplot’
  • removing ‘/home/xuan/R/x86_64-pc-linux-gnu-library/4.1/aplot’
    ERROR: dependency ‘aplot’ is not available for package ‘ggpicrust2’
  • removing ‘/home/xuan/R/x86_64-pc-linux-gnu-library/4.1/ggpicrust2’

Warning messages:
1: In install.packages("ggpicrust2") :
installation of package ‘ggfun’ had non-zero exit status
2: In install.packages("ggpicrust2") :
installation of package ‘aplot’ had non-zero exit status
3: In install.packages("ggpicrust2") :
installation of package ‘ggpicrust2’ had non-zero exit status

How do I fix it?

pathway_errorbar(): Error: Index out of bounds

Group <-metadata1$CST # column which you are interested in metadata

daa_results_list <-
pathway_errorbar(
abundance = kegg_abundance,
daa_results_df = daa_results_pt3,
Group = Group,
p_values_threshold = 0.05,
order = "pathway_class",
select = NULL,
ko_to_kegg = FALSE,
p_value_bar = TRUE,
colors = NULL,
x_lab = "pathway_name")
Error: Index out of bounds
daa_miscpt3.CSV
[metadataU.txt](https://github.
kegg_abundance.csv
com/cafferychen777/ggpicrust2/files/11314101/metadataU.txt)

Cannot visualize any data

pathway_pca(): Error in prcomp.default(t(abundance), center = TRUE, scale = TRUE) : cannot rescale a constant/zero column to unit variance

Hello,
I had posted in the past about a previous issue, but it has now been resolved.
I do have a new issue in making metacyc pca plots.
I originally was able to make PCA plots with all my data, but there was a certain set of samples I wanted to focus my analysis on, and so I modified my data files and have been doing analysis with them. I can make error bars and heatmaps, but the PCA is giving me trouble.
Here is my code

` setwd("/Users/mayagabitzsch/Desktop/microbiome2")

library(tidyverse)
library(ggh4x)
metcyc_abundance_file <- "path_abun_unstratroots.tsv"
metcyc_abundance_data <- read_delim(metcyc_abundance_file, delim = "\t", col_names = TRUE, trim_ws = TRUE)
view(metcyc_abundance_data)
metadataM<- read_delim(
"~/Desktop/microbiome2/MetadataROOTS.txt",
delim = "\t",
escape_double = FALSE,
trim_ws = TRUE)
view(metcyc_abundance_data)
view(metadataM)

#START HERE
metacyc_daa_results_df <- pathway_daa(abundance = metcyc_abundance_data%>% column_to_rownames("pathway"), metadata = metadataM, group = "ENV_ALT", daa_method = "ALDEx2")

Annotate the results

metacyc_daa_annotated_results_df <- pathway_annotation(pathway = "MetaCyc", daa_results_df = metacyc_daa_results_df, ko_to_kegg = TRUE)

feature_with_p_0.05 <- metacyc_daa_results_df %>% filter(p_adjust < 0.05)
pathway_heatmap(abundance = metcyc_abundance_data %>% filter(pathway %in% feature_with_p_0.05$feature) %>% column_to_rownames("pathway"), metadata = metadataM, group = "ENV_C")

pathway_pca(abundance = metcyc_abundance_data %>% column_to_rownames("pathway"), metadata = metadataM, group = "ENV_ALT")
`
Before I removed the samples I did not want to include in the analysis, I could make the PCA plots just fine, but now I get the error

Error in prcomp.default(t(abundance), center = TRUE, scale = TRUE) :
cannot rescale a constant/zero column to unit variance
I have tried multiple different groupings and I get the same error each time. I have also attached the meta data and Metacyc file here:
path_abun_unstratroots copy.txt
MetadataROOTS copy.txt

Also, one quick question about the annotation of KO abundance,
My samples are taken from the roots of plants, and for my error bars I have human diseases occur on one graph.
fixedA.pdf

How do these annotations work? I just think that is a strange group to have given the type of samples, and only occurs on the grouping ENV_A

pathway_errorbar(): Can't add `e2` to a <ggplot> object.

I ran the following lines of code and got an error while running thr pathway_errorbar code

If you want to analyze KEGG pathway abundance instead of KO within the pathway, turn ko_to_kegg to TRUE.

KEGG pathways typically have more explainable descriptions.

Load metadata as a tibble

data(metadata)

metadata <- read_delim("C:/Microbiome/picrust/Rhizo/check/rhizo_metadata.txt", delim = "\t", escape_double = FALSE, trim_ws = TRUE)

Load KEGG pathway abundance

data(kegg_abundance)

kegg_abundance <- ko2kegg_abundance("C:/Microbiome/picrust/Rhizo/check/pred_metagenome_unstrat.tsv")

Perform pathway differential abundance analysis (DAA) using ALDEx2 method

Please change group to "your_group_column" if you are not using example dataset

daa_results_df <- pathway_daa(abundance = kegg_abundance, metadata = metadata, group = "GDD", daa_method = "ALDEx2", select = NULL, reference = NULL)

Filter results for ALDEx2_Welch's t test method

Please check the unique(daa_results_df$method) and choose one

daa_sub_method_results_df <- daa_results_df[daa_results_df$method == "ALDEx2_Wilcoxon rank test", ]

Annotate pathway results using KO to KEGG conversion

daa_annotated_sub_method_results_df <- pathway_annotation(pathway = "KO", daa_results_df = daa_sub_method_results_df, ko_to_kegg = TRUE)

Generate pathway error bar plot

Please change Group to metadata$your_group_column if you are not using example dataset

p <- pathway_errorbar(abundance = kegg_abundance, daa_results_df = daa_annotated_sub_method_results_df, Group = metadata$GDD,
p_values_threshold = 0.05, order = "pathway_class", select = daa_annotated_sub_method_results_df %>% arrange(p_adjust) %>% slice(1:20) %>% dplyr::select(feature) %>% pull(),
ko_to_kegg = TRUE, p_value_bar = TRUE, colors = NULL, x_lab = "pathway_name")

I got hte following error while trying to generate the error bar plot

The following pathways are missing annotations and have been excluded: ko00281, ko00471, ko00472, ko00473
You can use the 'pathway_annotation' function to add annotations for these pathways.
Registered S3 method overwritten by 'GGally':
method from
+.gg ggplot2
Error in ggplot_add():
! Can't add e2 to a object.
Run rlang::last_trace() to see where the error occurred.

Please how can i resolve this?

pathway_errorbar(): color was not mapped on the road when saving

Hello @cafferychen777, I used the ggsave function to save the pathway_errorbar in pdf format, and found that the color was not mapped on the road, but was saved in png format, so the color could normally mapp in the road. What's the problem?
Code:
library(ggpicrust2)
library(tidyverse)
library(GGally)
library(ggprism)
library(patchwork)
library(ggh4x)
data("ko_abundance")
data("metadata")
kegg_abundance <- ko2kegg_abundance(data = ko_abundance)
daa_results_df <- pathway_daa(kegg_abundance, metadata = metadata,
group = "Environment", daa_method = "LinDA")
daa_annotated_results_df <- pathway_annotation(pathway = "KO",
daa_results_df = daa_results_df, ko_to_kegg = TRUE)
pathway_errorbar(abundance = kegg_abundance,
daa_results_df = daa_annotated_results_df,
Group = metadata$Environment,
ko_to_kegg = TRUE,
p_values_threshold = 0.05,
order = "pathway_class",
select = NULL,
p_value_bar = TRUE,
colors = NULL,
x_lab = "pathway_name")
ggsave(filename = "pathway_errobar1.pdf", width = 35, height = 15, units = "cm", dpi = 600)
ggsave(filename = "pathway_errobar1.png", width = 35, height = 15, units = "cm", dpi = 600)

pathway_errobar1.pdf
pathway_errobar1

ggpicrust2(): Error in .rowNamesDF<-(x, value = value) : invalid 'row.names' length

Hi there,

I'm trying out ggpicrust2 on a small subset of data (eight samples) to iron out any problems before using the entire dataset. It wouldn't read my .tsv, so I created the metadata tibble. Could this you provide me with more information on the following error?

alculation may take a long time, please be patient.
The kegg pathway with zero abundance in all the different samples has been removed.
Error in .rowNamesDF<-(x, value = value) : invalid 'row.names' length

#If you want to analysis kegg pathway abundance instead of ko within the pathway. You should turn ko_to_kegg to TRUE.
#The kegg pathway typically have the more explainable description.
library(readr)
library(ggpicrust2)
library(tibble)
library(tidyverse)
library(ggprism)
library(patchwork)
metadata <- tibble(
sample_name = c("lessQ1", "lessQ2", "lessQ3", "lessQ4", "moreQ1", "moreQ2", "moreQ3", "moreQ4"),
group = c("less", "less", "less", "less", "more", "more", "more", "more")
)

daa_results_list <-
ggpicrust2(
file = "h:/picrust2_out/KO_metagenome_out/pred_metagenome_unstrat.tsv",
metadata = metadata,
group = "group",
pathway = "KO",
daa_method = "LinDA",
p_values_bar = TRUE,
p.adjust = "BH",
ko_to_kegg = TRUE,
order = "pathway_class",
select = NULL,
reference = NULL # If your metadata[,group] has more than two levels, please specify a reference.
)

ggpicrust2 installation issue - which R version should I use?

Hi,

Thank you very much for such great tool for picrust2 results visualization. That is just I was looking for!

May I kindly ask you how to install it properly?

My recent attempt was to install in conda env with R inside:
I have tried R 3,6 and 4.2 versions, in both cases I had such error at the end of installation

✔ checking for file ‘/tmp/RtmpXY3yEs/remotes601e27a97bf1/cafferychen777-ggpicrust2-7671bf4/DESCRIPTION’ ...
─ preparing ‘ggpicrust2’:
✔ checking DESCRIPTION meta-information ...
─ checking for LF line-endings in source and make files and shell scripts
─ checking for empty or unneeded directories
Removed empty directory ‘ggpicrust2/data’
─ looking to see if a ‘data/datalist’ file should be added
NB: this package now depends on R (>= 3.5.0)
WARNING: Added dependency on R >= 3.5.0 because serialized objects in serialize/load version 3 cannot be read in older versions of R. File(s) containing such objects: 'ggpicrust2/inst/extdata/EC_reference.RData' WARNING: Added dependency on R >= 3.5.0 because serialized objects in serialize/load version 3 cannot be read in older versions of R. File(s) containing such objects: 'ggpicrust2/inst/extdata/KO_reference.RData' WARNING: Added dependency on R >= 3.5.0 because serialized objects in serialize/load version 3 cannot be read in older versions of R. File(s) containing such objects: 'ggpicrust2/inst/extdata/MetaCyc_reference.RData' WARNING: Added dependency on R >= 3.5.0 because serialized objects in serialize/load version 3 cannot be read in older versions of R. File(s) containing such objects: 'ggpicrust2/inst/extdata/kegg_reference.RData'
─ building 'ggpicrust2_1.4.7.9000.tar.gz'

ERROR: dependencies ‘ALDEx2’, ‘DESeq2’, ‘edgeR’, ‘lefser’, ‘limma’, ‘Maaslin2’, ‘metagenomeSeq’, ‘MicrobiomeStat’, ‘SummarizedExperiment’ are not available for package ‘ggpicrust2’

  • removing ‘/home/jang/anaconda3/envs/mamba/envs/ggpirust2_Renv/lib/R/library/ggpicrust2’
    Warning messages:
    1: In i.p(...) :
    installation of package ‘MicrobiomeStat’ had non-zero exit status
    2: In i.p(...) :
    installation of package ‘/tmp/RtmpXY3yEs/file601e777feae1/ggpicrust2_1.4.7.9000.tar.gz’ had non-zero exit status

Any hints?

Jan

pathway_errorbar(): Error: Index out of bounds

Hello @cafferychen777, I hope you are doing well. I have been trying ggpicrust2, which I find amazing. I started with the provided tutorials, and it worked correctly when plotting the results. However, I encountered a problem when analyzing my own results. Whenever I try to plot using either the suggested mode or step-by-step, it generates the following error: "Error: Index out of bounds," and the plot is not generated. I looked for past publications with the same error, but the solutions provided didn't work for me. I'm attaching the files
used for the analysis: https://drive.google.com/drive/folders/1G48A4LPkMy6Vko7zLx3egtDtPVOdBEm-?usp=sharing

/library(readr)
library(ggpicrust2)
library(tibble)
library(tidyverse)
library(ggprism)
library(patchwork)

 data(metadata)
metadata <- read_delim("analisis/metadata4.tsv", delim = "\t", escape_double = FALSE, trim_ws = TRUE) 

kegg_abundance <- ko2kegg_abundance("analisis/pred_metagenome_unstrat.tsv") 

daa_results_df <- pathway_daa(abundance = kegg_abundance, metadata = metadata, group = "Grupos", daa_method = "LinDA", select = NULL, reference = NULL) 

daa_sub_method_results_df <- daa_results_df[daa_results_df$method == "LinDA", ]

daa_annotated_sub_method_results_df <- pathway_annotation(pathway = "KO", daa_results_df = daa_sub_method_results_df, ko_to_kegg = TRUE)
daa_annotated_sub_method_results_df <- daa_annotated_sub_method_results_df[!is.na(daa_annotated_sub_method_results_df$pathway_name),]

daa_annotated_sub_method_results_df$p_adjust <- round(daa_annotated_sub_method_results_df$p_adjust,5)

low_p_feature <- daa_annotated_sub_method_results_df[order(daa_annotated_sub_method_results_df$p_adjust), ]$feature[1:20]

p <- ggpicrust2::pathway_errorbar(
  abundance = kegg_abundance,
  daa_results_df = daa_annotated_sub_method_results_df,
  Group = metadata$Grupos,
  p_values_threshold = 0.05,
  order = "pathway_class",
  select = low_p_feature,
  ko_to_kegg = TRUE,
  p_value_bar = FALSE,
  colors = NULL,
  x_lab = "pathway_name"
)

#Error result

> p <- ggpicrust2::pathway_errorbar(
+   abundance = kegg_abundance,
+   daa_results_df = daa_annotated_sub_method_results_df,
+   Group = metadata$Grupos,
+   p_values_threshold = 0.05,
+   order = "pathway_class",
+   select = low_p_feature,
+   ko_to_kegg = TRUE,
+   p_value_bar = FALSE,
+   colors = NULL,
+   x_lab = "pathway_name"
+ )
Error: Index out of bounds

I end up with 0 obs. for my kegg_abundance

##What I am running

ko_abundance_file <- '/Users/rachaelkramp/Desktop/Selection_paper/Picrust2_analysis/pred_metagenome_unstrat.tsv'

Run ko2kegg_abundance function

kegg_abundance <- ko2kegg_abundance(file = ko_abundance_file)

R-Console feedback:
"> kegg_abundance <- ko2kegg_abundance(file = ko_abundance_file)
Rows: 2286 Columns: 51
── Column specification ────────────────────────────────────────────────────────────────────────────
Delimiter: "\t"
chr (1): function
dbl (50): 142-Pre, 143-Pre, 147-Pre, 162-Pre, 165-Pre, 176P, 180-Pre, 181-Pre, 196-Pre, 197P, M1...

ℹ Use spec() to retrieve the full column specification for this data.
ℹ Specify the column types or set show_col_types = FALSE to quiet this message.
Calculation may take a long time, please be patient.
The kegg pathway with zero abundance in all the different samples has been removed."

Question:

Why am I ended up with zero obs. in the abundance file?

error_ggpicrust2

Hello,
I run the code below:

results <- ggpicrust2(file = ko_abundance,
metadata = metadata,
group = "Vaccine",
pathway = "KO",
daa_method = "LinDA",
order = "pathway_class",
ko_to_kegg = T,
x_lab = "pathway_name",
p.adjust = "BH",
select = NULL,
reference = NULL)

and I get this error: Error in switch(file_format, .txt = abundance <- readr::read_delim(file, :
EXPR must be a length 1 vector

What does it mean, and what do I do to correct it?

pathway_annotation(): Error in $<-.data.frame(*tmp*, "pathway_description"

Hi- thanks a ton for developing ggpicrust2.

I encounter the following error both when I use the full pipeline command, ggpicrust2() and the manual step-by-step mode suggested in case of errors. It looks like the issue is that there is a line break in the KEGG description for Ko04910.

https://www.genome.jp/dbget-bin/www_bget?ko04910

Is there a straightforward fix I can make locally? I'm fairly proficient in python but have very little experience with R.

We are connecting to the KEGG database to get the latest results, please wait patiently.
Error in $<-.data.frame(*tmp*, "pathway_description", value = c("Insulin binding to its receptor results in the tyrosine phosphorylation of insulin receptor substrates (IRS) by the insulin receptor tyrosine kinase (INSR). This allows association of IRSs with the regulatory subunit of phosphoinositide 3-kinase (PI3K). PI3K activates 3-phosphoinositide-dependent protein kinase 1 (PDK1), which activates Akt, a serine kinase. Akt in turn deactivates glycogen synthase kinase 3 (GSK-3), leading to activation of glycogen synthase (GYS) and thus glycogen synthesis. Activation of Akt also results in the translocation of GLUT4 vesicles from their intracellular pool to the plasma membrane, where they allow uptake of glucose into the cell. Akt also leads to mTOR-mediated activation of protein synthesis by eIF4 and p70S6K. The translocation of GLUT4 protein is also elicited through the CAP/Cbl/TC10 pathway, once Cbl is phosphorylated by INSR.", :
replacement has 2 rows, data has 1

pathway_daa(): Error in metadata[, matching_columns]: ! Can't subset columns with matching_columns. ✖ Subscript matching_columnscan't contain missing values. ✖ It has a missing value at location 1. Runrlang::last_trace()

hello,
I am trying to follow the example code with my data. I used the file path_abun_unstrat.tsv and a file titled Metadata.txt
When I try to run the ggpicrust with the input file path, I get an error stating that the subscript matching columns can't contain missing values, It has a missing value at location 1. Here is what the code Looks like

and the error that is given is
Calculation may take a long time, please be patient. The kegg pathway with zero abundance in all the different samples has been removed. Performing pathway differential abundance analysis... Error in metadata[, matching_columns]: ! Can't subset columns with matching_columns. ✖ Subscript matching_columnscan't contain missing values. ✖ It has a missing value at location 1. Runrlang::last_trace()` to see where the error occurred.

I went through the step by step approach in the read me and this is the command where the error is popping up
daa_results_df <- pathway_daa(abundance = kegg_abundance, metadata = metadata, group = "ENVIRONMENT", daa_method = "ALDEx2", select = NULL, reference = NULL)

I found another post that had the same error as me, and I tried to follow the advice there and the issue is still not resolving. I am not sure if I am understanding the solutions correctly. I transposed my metadata file so that the sample name was the columns, matching the kegg_abundance, The first column in my meta data is the sample_name with the following groups I am putting my data in. That column does not show up on the kegg abundance columns and I think that might be the issue? But then I lose my samples groupings. I am unsure how to make them match.

Questions about KEGG pathways

Hi again!

I have two questions about converting KOs to KEGG pathways.

Regardless if I am analyzing KOs or KEGG pathways, I am using the "pred_metagenome_unstrat.tsv" as my input (please let me know if this is correct), and now I want to extract the description of each KO/KEGG pathway together with their abundance. This was easy to do for the KOs, but I am not sure how to do it for the pathways. Can you please help me with that?

I am also struggling with the pathway_annotation for a different project (pathway_annotation(pathway = 'KO', daa_results_df = daa_results_kegg_DNA2_1, ko_to_kegg = TRUE)). Due to the size, I split my dataframe in 3 before using pathway_annotation (df1, df2, and df3). Somehow, df2 and df3 are promptly annotated but not df1. I even left my computer overnight and nothing happened. I have no idea why this is happening since the dataframes are quite similar. Do you have any thoughts on this?

Thanks,
Andressa

ggpicrust2(): Error in metadata_mat[, group] : subscript out of bounds

Hi Caffery
This is Frank from Penn State University. Your development of ggpicrust2 is really impressive! I feel blessed to have such a package that can help visualize the picrust2 output.
I encountered a problem while running the package, hope you can help
I run picrust2 following the pipeline on https://github.com/picrust/picrust2/wiki/PICRUSt2-Tutorial-%28v2.5.0%29. Then use the output from this pipeline as the input to ggpicrust2. Then I run the ggpicrust2 script you wrote on the website:

   metadata <-
  read_delim(
    "metadata.tsv",
    delim = "\t",
    escape_double = FALSE,
    trim_ws = TRUE
  )

group <- "Enviroment"

daa_results_list <-
  ggpicrust2(
    file = "pred_metagenome_unstrat.tsv",
    metadata = metadata,
    group = "Environment",
    pathway = "KO",
    daa_method = "LinDA",
    p_values_bar = TRUE,
    p.adjust = "BH",
    ko_to_kegg = TRUE,
    order = "pathway_class",
    select = NULL,
    reference = NULL # If your metadata[,group] has more than two levels, please specify a reference.
  )

It gives the following error message: Error in metadata_mat[, group] : subscript out of bounds
Do you have any suggestions on how to fix this error? Maybe I need to make some change on the group parameter? Thank you.
Best
Frank

Error in pathway_errorbar(abundance = metcyc_abundance_data %>% column_to_rownames("pathway"), : The feature with statistically significance is zero, pathway_errorbar can't do the visualization.

Sorry for constantly posting issues, but I was able to make PCA plots of my metacyc data, but I cannot form error bars of the pathways. Here is my code

`metcyc_abundance_file <- "path_abun_unstratroots.tsv"
metcyc_abundance_data <- read_delim(metcyc_abundance_file, delim = "\t", col_names = TRUE, trim_ws = TRUE)
view(metcyc_abundance_data)
metadataM<- read_delim(
"~/Desktop/microbiome2/MetadataROOTS.txt",
delim = "\t",
escape_double = FALSE,
trim_ws = TRUE)
view(metcyc_abundance_data)
view(metadataM)

This is the process of getting an error bar,heat map and hopefully pca of metacyc abundance

Perform differential abundance analysis

#START HERE
metacyc_daa_results_df <- pathway_daa(abundance = metcyc_abundance_data%>% column_to_rownames("pathway"), metadata = metadataM, group = "ENV_C", daa_method = "ALDEx2")

Annotate the results

metacyc_daa_annotated_results_df <- pathway_annotation(pathway = "MetaCyc", daa_results_df = metacyc_daa_results_df, ko_to_kegg = FALSE)

view(meta)
metacyc_daa_annotated_results_df <- metacyc_daa_annotated_results_df [!is.na(metacyc_daa_annotated_results_df$description),]
metacyc_daa_annotated_results_df$p_adjust <- round(metacyc_daa_annotated_results_df$p_adjust,5)
low_p_feature <- metacyc_daa_annotated_results_df[order(metacyc_daa_annotated_results_df$p_adjust), ]$description[1:20]

pathway_errorbar(abundance = metcyc_abundance_data %>% column_to_rownames("pathway"), daa_results_df = metacyc_daa_annotated_results_df, Group = metadataM$ENV_C, ko_to_kegg = FALSE, p_values_threshold = 0.05, order = "group", select = low_p_feature, p_value_bar = TRUE, colors = NULL, x_lab = "description")
`

I get the error Error in pathway_errorbar(abundance = metcyc_abundance_data %>% column_to_rownames("pathway"), :
The feature with statistically significance is zero, pathway_errorbar can't do the visualization.
Does that mean that I cannot visualize these error bars at all? I was able to make error bars with the KEGG pathways, and for my project having the descriptions of the Metacyc pathways would be good as well.

Thank you for your quick and helpful responses to my errors.

add a parameter to select top significant pathways

Hi Caffery,

Thank you for fixing the bug.

I have a request for the pathway_errorbar(), is it possible to add a parameter to select top significant pathways or top pathways by other criteria. Because I got a different error when using the wrapper ggpicrust2

Error in pathway_errorbar(abundance = abundance, daa_results_df = daa_sub_method_results_df,  : 
  The feature with statistically significance are more than 30, the visualization will be terrible.
 Please use select to reduce the number.

I could go step by step using each function, but doing so makes the wrapper lose its convenience and its function in preliminary data exploration, don't you think?

Also is it possible to add parameters in the wrapper to choose or turn on or off the existing visualization methods?

Best regards,

ggpicrust Install Issues

Hello! I really like the idea of ggpicrust. It looks like an efficient means of quickly analyzing picrust. Are there any plans to dockerize the package? I'm having an extremely hard time installing this package with endless dependency problems. I've tried just in R - just in Conda - in R and Conda and from renv::restore (renv.lock) all to no avail. For each dependency problem I install that package and try again and every time there is a different dependency problem. I'm at the point of giving up and writing something myself to analyze picrust data. I've read the other two issue post on dependency problems none of which have been able to solve my problem. If this package was dockerized I think it would help not only me but future people looking to use this package.

pathway_annotation issue

Thank you for the nice package!
However, when I did pathway_annotation(), data loss occurred.
When I subset about 242 KO data into 80 lines and divided them into 3 pieces of data, then ran the pathway_annotation().

My data is in the link below.
mydata

f1 <- ko_daa_sub_method_results_df[1:80, ] # 121
f2 <- ko_daa_sub_method_results_df[81:161, ] # 121
f3 <- ko_daa_sub_method_results_df[162:242, ] # 121

d1 <-pathway_annotation(pathway = "KO",daa_results_df = f1, ko_to_kegg = TRUE) # 53 × 11
d2 <-pathway_annotation(pathway = "KO",daa_results_df = f2, ko_to_kegg = TRUE) # 58 × 11
d3 <-pathway_annotation(pathway = "KO",daa_results_df = f3, ko_to_kegg = TRUE) # 50 × 11
annotation <- rbind(d1, d2, d3)
dim(annotation) # 161

The result left only 161 rows out of 242 KO data.
output is here result

I thought it was a problem with keggGet(), so I took the contents inside the pathway_annotation()and ran it separately.


ko_id <- ko_daa_sub_method_results_df$feature # 242
pathway_table <-  data.frame(row.names = ko_id)


KeggGet_results <- list()
for ( i in ko_id) {
  KeggGet_results[[i]] <- tryCatch(keggGet(i), error=function(e) NULL) # https://www.biostars.org/p/366463/
}

ko_result_id <- KeggGet_results %>% names # 236

for (i in ko_result_id){
        pathway_table[i, "Level1"]         <- strsplit( KeggGet_results[[i]][[1]]$CLASS, "; ")[[1]][1]
        pathway_table[i, "Level2"]         <- strsplit( KeggGet_results[[i]][[1]]$CLASS, "; ")[[1]][2]
        pathway_table[i, "Level3"]         <-  KeggGet_results[[i]][[1]]$PATHWAY_MAP
        if ( !is.null(KeggGet_results[[i]][[1]]$DESCRIPTION)) {
          pathway_table[i, "pathway_description"] <-  KeggGet_results[[i]][[1]]$DESCRIPTION
          }
}

The following message appeared.

_

Error in [<-.data.frame(*tmp*, i, "pathway_description", value = c("Type I diabetes mellitus is a disease that results from autoimmune destruction of the insulin-producing beta-cells. Certain beta-cell proteins act as autoantigens after being processed by antigen-presenting cell (APC), such as macrophages and dendritic cells, and presented in a complex with MHC-II molecules on the surface of the APC. Then immunogenic signals from APC activate CD4+ T cells, predominantly of the Th1 subset. Antigen-activated Th1 cells produce IL-2 and IFNgamma. They activate macrophages and cytotoxic CD8+ T cells, and these effector cells may kill islet beta-cells by one or both of two types of mechanisms: (1) direct interactions of antigen-specific cytotoxic T cells with a beta-cell autoantigen-MHC-I complex on the beta-cell, and (2) non-specific inflammatory mediators, such as free radicals/oxidants and cytokines (IL-1, TNFalpha, TNFbeta, IFNgamma).", :
replacement has 2 rows, data has 1

_

The error did not appear because I excluded the DESCRIPTION column.

for (i in ko_result_id){
        pathway_table[i, "Level1"]         <- strsplit( KeggGet_results[[i]][[1]]$CLASS, "; ")[[1]][1]
        pathway_table[i, "Level2"]         <- strsplit( KeggGet_results[[i]][[1]]$CLASS, "; ")[[1]][2]
        pathway_table[i, "Level3"]         <-  KeggGet_results[[i]][[1]]$PATHWAY_MAP
        # if ( !is.null(KeggGet_results[[i]][[1]]$DESCRIPTION)) {
        #   pathway_table[i, "pathway_description"] <-  KeggGet_results[[i]][[1]]$DESCRIPTION
        #   }
}

Is there any way to get rid of these loss of data in ggpicrust as well?
I will be grateful if you answer.

pathway_errorbar(): "The 'group1' or 'group2' column in the 'daa_results_df' data frame contains more than one group. Please filter each to contain only one group."

Hello!

I am having an issue when running ggpicrust2 function and, when I tried to explore the possible source of error, I found out that the error is happening with the pathway_errorbar function. The title of the issue is the error message I am getting... no details...

Then I looked into the pathway_errorbar function and saw that I can have an error if my target variable has more then 2 categories (I have 4, and used Group 1 as reference for LinDA:

if (nlevels(factor(daa_results_df$group1)) != 1 || nlevels(factor(daa_results_df$group2)) != 1) {
message(
"The 'group1' or 'group2' column in the 'daa_results_df' data frame contains more than one group. Please filter each to contain only one group."

I believe this is my error, but I am not getting this error message as output.

Do you have any suggestions (tutorial?) on how to perform this analysis, since I have 4 categories in my target atribute?

Amazing package! Thanks in advance for your attention!

My pred_metagenome_unstrat file has EC:1.1.1.1 and not KO format

For my pred_metagenome_unstrat file I have the EC:1.1.1.1 and not the Ko annotation and from the best of my knowledge, this file ought to be my abundance file. However, I had to take a long route to convert the EC annotation to KO annotation and one problem with that is that not all EC annotation had a corresponding KO annotation, so i had to drop some EC during conversion to KO. Is it possible to use ggpicrust2 to analyze EC annotated pred_metagenome_unstrat and if yes, is it possible that i use the following script:

ko_abundance_file <- "path/to/your/pred_metagenome_unstrat.tsv"
kegg_abundance <- ko2kegg_abundance(ko_abundance_file) # Or use data(kegg_abundance)

metadata <- read_delim("path/to/your/metadata.txt", delim = "\t", escape_double = FALSE, trim_ws = TRUE)

The default DAA method is "ALDEx2"

Please change group to "your_group_column" if you are not using example dataset

daa_results_df <- pathway_daa(abundance = kegg_abundance, metadata = metadata, group = "Environment", daa_method = "linDA", select = NULL, p.adjust = "BH", reference = NULL)

If you have more than 3 group levels and want to use the LinDA, limma voom, or Maaslin2 methods, you should provide a reference.

metadata <- read_delim("path/to/your/metadata.txt", delim = "\t", escape_double = FALSE, trim_ws = TRUE)

Please change group to "your_group_column" if you are not using example dataset

daa_results_df <- pathway_daa(abundance = kegg_abundance, metadata = metadata, group = "Group", daa_method = "LinDA", select = NULL, p.adjust = "BH", reference = "Harvard BRI")

daa_annotated_results_df <- pathway_annotation(pathway = "KO", daa_results_df = daa_results_df, ko_to_kegg = TRUE)

Please change Group to metadata$your_group_column if you are not using example dataset

p <- pathway_errorbar(abundance = kegg_abundance,
daa_results_df = daa_annotated_results_df,
Group = metadata$Environment,
ko_to_kegg = TRUE,
p_values_threshold = 0.05,
order = "pathway_class",
select = NULL,
p_value_bar = TRUE,
colors = NULL,
x_lab = "pathway_name")

Or do i use the pred_metagenome_unstrat_descrip for my Ko abundance file as it has a Column for description? Please i need clarification on this. Thanks

This image is an snapshot of the pred_metagenome_unstart.tsv file
image

compare_daa_results(): Maaslin2 method changed the names of the metacyc pathways, replacing a hyphen (-) with a dot (.)

I had an issue with this function with my own data, but also with the sample dataset

library(ggpicrust2)
library(tidyverse)
data("metacyc_abundance")
data("metadata")

methods <- c("ALDEx2", "DESeq2", "edgeR")
daa_results_list <- lapply(methods, function(method) {
  pathway_daa(abundance = metacyc_abundance %>% column_to_rownames("pathway"), metadata = metadata, group = "Environment", daa_method = method)
})

method_names <- c("ALDEx2_Welch's t test","ALDEx2_Wilcoxon rank test","DESeq2", "edgeR")

comparison_results <- compare_daa_results(daa_results_list = daa_results_list, method_names = method_names)

daa_results_list contains three elements, but later method_names has four elements. As a result, comparison results provide a table where the method names do not correspond to the actual method used. The two variations of ALDEx2 ("ALDEx2_Welch's t test","ALDEx2_Wilcoxon rank test") are in the same pathway_daa result, however in the comparison table they are considered separately and wrongfully assigned to another method result

pathway_daa(): object 'p_values_df' not found"

Hello,

I am new to picrust2 and ggpicrust2.

I have obtained the output files from picrust2 and wanted to analyse using ggpicrust2, however, keep receiving an error using the ggpicrust2 function.

Using this command obtained from the tutorial:

results_file_input <- ggpicrust2(file = abundance_file,
metadata = metadata,
group = "Disease",
pathway = "KO",
daa_method = "Maaslin2",
reference = "Healthy",
ko_to_kegg = TRUE,
p.adjust = "BH",
order = "pathway_class",
p_values_bar = FALSE,
x_lab = "pathway_name")

I receive some sort of error in every daa_method used.

For LinDA, "Error in ggpicrust2(file = abundance_file, metadata = metadata, group = "Disease", : There are no statistically significant biomarkers" which I know is not an actual error, rather the statistical output that there are no significant biomarkers.

For Maaslin2, "Error in p.adjust(p_values_df$p_values, method = "none") : object 'p_values_df' not found". Even when I set p_adjust = "none", I still recieve this error.

For Deseq2 and metagenomeseq, "Error in if (sum(as.numeric(daa_results_df$p_adjust <= 0.05)) == 0) { : missing value where TRUE/FALSE needed".

Ironically, the only daa method which works is "limma voom", however, I am not using RNA-seq data.

Are there any suggestions you can offer?

Thank you,
Carmen

pathway_annotation() long runtime, connecting to KEGG database

Question: Is there a, general, expected runtime for the KEGG database connection step of the pathway_annotation() command?

This is my first time using the package, and I am passing (what I think is) a relatively small number of features, 228, to the annotation step - yet it's been running at the "We are connecting to the KEGG database to get the latest results, please wait patiently." step for ~6 hours.

If this runtime is expected, would it be possible to download the annotations ourselves and pass them to the annotation() command locally?

Thanks for any help you can provide!

pathway_daa(): Error in contrasts<-(*tmp*, value = contr.funs[1 + isOF[nn]]) : contrasts can be applied only to factors with 2 or more levels

Hi, I have another question, now about the function pathway_daa

I am running the following codes. While the first works normally, I receive the following error in the second:

daa_results <- pathway_daa(kegg_abundance, meta_table, 'Day', daa_method = 'ALDEx2', select = NULL,
p.adjust = 'bonferroni', reference = NULL)

daa_results2 <- pathway_daa(ko_abundance, meta_table, 'Day', daa_method = 'ALDEx2', select = NULL,
p.adjust = 'bonferroni', reference = NULL)

ALDEx2 takes a long time to complete the calculation, please wait patiently.
operating in serial mode
computing center with all features
operating in serial mode
Error in contrasts<-(*tmp*, value = contr.funs[1 + isOF[nn]]) :
contrasts can be applied only to factors with 2 or more levels

I am confused about this error, since the only difference between the codes is the first dataframe. Can you please help me with this too?

Tiny bug in ggpicrust2 function?

Hi there,
thanks a lot for providing this nice package.
I think, I found a tiny bug in the ggpicrust2 function:

In line 80 (of ggpicrust2.R) it reads
if (select == "NULL"){
which gives the error "Error in if (select == "NULL") { : argument is of length zero"
shouldn't it be
if (is.null(select)){ ?

Question: how to annotate pathway information using the output file from PICRUSt2?

Dear developers,

Thank you for this tool!

I was wondering if there is an example file for using the patway_annotation function in the following case:

# Use case 1: Annotating pathway information using the output file from PICRUSt2
result1 <- pathway_annotation(file = "path/to/picrust2/export/file.txt",
pathway = "KO",
daa_results_df = NULL,
ko_to_kegg = FALSE)

I tried using the default output from PICRUST2, containing the pathways descriptions (i.e. path_abun_unstrat_descrip.tsv) as follows but it didnt work:

pathways <-
read_delim(
    "path_abun_unstrat_descrip.tsv",
    delim = "\t",
    escape_double = TRUE,
    trim_ws = TRUE
  )

daa_annotated_sub_method_results_df <- pathway_annotation(file = pathways,
pathway = "KO",
daa_results_df = NULL,
ko_to_kegg = FALSE)

Any suggestions?

Thank you in advance!

Cheers,

Lia

loading issue

library(ggpicrust2)
Error: package or namespace load failed for ‘ggpicrust2’ in loadNamespace(j <- i[[1L]], c(lib.loc, .libPaths()), versionCheck = vI[[j]]):
namespace ‘dplyr’ 1.0.8 is already loaded, but >= 1.0.10 is required

Recommend Projects

  • React photo React

    A declarative, efficient, and flexible JavaScript library for building user interfaces.

  • Vue.js photo Vue.js

    🖖 Vue.js is a progressive, incrementally-adoptable JavaScript framework for building UI on the web.

  • Typescript photo Typescript

    TypeScript is a superset of JavaScript that compiles to clean JavaScript output.

  • TensorFlow photo TensorFlow

    An Open Source Machine Learning Framework for Everyone

  • Django photo Django

    The Web framework for perfectionists with deadlines.

  • D3 photo D3

    Bring data to life with SVG, Canvas and HTML. 📊📈🎉

Recommend Topics

  • javascript

    JavaScript (JS) is a lightweight interpreted programming language with first-class functions.

  • web

    Some thing interesting about web. New door for the world.

  • server

    A server is a program made to process requests and deliver data to clients.

  • Machine learning

    Machine learning is a way of modeling and interpreting data that allows a piece of software to respond intelligently.

  • Game

    Some thing interesting about game, make everyone happy.

Recommend Org

  • Facebook photo Facebook

    We are working to build community through open source technology. NB: members must have two-factor auth.

  • Microsoft photo Microsoft

    Open source projects and samples from Microsoft.

  • Google photo Google

    Google ❤️ Open Source for everyone.

  • D3 photo D3

    Data-Driven Documents codes.