marcomusy / vedo Goto Github PK
View Code? Open in Web Editor NEWA python module for scientific analysis of 3D data based on VTK and Numpy
Home Page: https://vedo.embl.es
License: MIT License
A python module for scientific analysis of 3D data based on VTK and Numpy
Home Page: https://vedo.embl.es
License: MIT License


The plotter.add(actors) method adds actors to self.actors but does not add them to the renderer.
The plotter.remove and plotter.clear methods on the other hand do remove the actor from the renderer.
When running a plotter in qt this means that plotter.show() needs to be called to add the actors to the renderer.
Example:
"""
A sort of minimal example of how to embed a rendering window
into a qt application.
"""
print(__doc__)

import sys
from PyQt5 import Qt
from vtk.qt.QVTKRenderWindowInteractor import QVTKRenderWindowInteractor

from vtkplotter import Plotter, Cube, Torus, Cone, settings

settings.usingQt = True


class MainWindow(Qt.QMainWindow):
    def __init__(self, parent=None):

        Qt.QMainWindow.__init__(self, parent)
        self.frame = Qt.QFrame()
        self.vl = Qt.QVBoxLayout()
        self.vtkWidget = QVTKRenderWindowInteractor(self.frame)
        self.vl.addWidget(self.vtkWidget)

        vp = Plotter(offscreen=True, interactive=False, axes=2)

        vp.show()  # create renderer

        self.vtkWidget.GetRenderWindow().AddRenderer(vp.renderer)
        self.iren = self.vtkWidget.GetRenderWindow().GetInteractor()

        self.frame.setLayout(self.vl)
        self.setCentralWidget(self.frame)

        self.show()  # qt not Plotter method

        vp.renderer.ResetCamera()
        self.iren.Start()

        cn = Cone()
        cc = Cube().pos(1, 1, 1).color("pink")
        ss = Torus()

        vp.add([cn, cc, ss])

        #    vp.show()  # update create renderer <=== calling this (again) brings up the actors


if __name__ == "__main__":
    app = Qt.QApplication(sys.argv)
    window = MainWindow()
app.exec_()
A fix could be:
# Line 645 in plotter.py

    def add(self, actors):
        """Append input object to the internal list of actors to be shown.

        :return: returns input actor for possible concatenation.
        """
        if utils.isSequence(actors):
            for a in actors:
                if a not in self.actors:
                    self.actors.append(a)
                    if self.renderer:                # <---
                        self.renderer.AddActor(a)    # <---
            return None
        else:
            self.actors.append(actors)
            if self.renderer:                        # <---
                self.renderer.AddActor(actors)       # <---
            return actors
But again, I'm too new to this library to see if this would break anything else...
Hi!
First of thanks for this great tool!
I've been trying to get a non-blocking window to work using the examples/other/qt_window.py. While the example works just fine using the normal Python CLI, I ran into various issues when trying this in an IPython console.
I eventually got it to work with minimal modifications and I thought I'd leave a comment in case somebody else comes across similar issues.
This works fine in the standard Python console:
from PyQt5 import Qt
from vtk.qt.QVTKRenderWindowInteractor import QVTKRenderWindowInteractor

from vtkplotter import Plotter, Cone

class MainWindow(Qt.QMainWindow):
    def __init__(self, parent=None):

        Qt.QMainWindow.__init__(self, parent)
        self.frame = Qt.QFrame()
        self.vl = Qt.QVBoxLayout()
        self.vtkWidget = QVTKRenderWindowInteractor(self.frame)
        self.vl.addWidget(self.vtkWidget)

        vp = Plotter(qtWidget=self.vtkWidget, axes=4, bg='white')

        vp += Cone()
        vp.show()      # create renderer and add the actors

        # set-up the rest of the Qt window
        self.frame.setLayout(self.vl)
        self.setCentralWidget(self.frame)

        self.show()    # <--- show the Qt Window

app = Qt.QApplication([])
window = MainWindow()
And with these modifications it also works in IPython:
# Initialise the qt5 gui event loop
%gui qt5

# Tell vtkplotter not to embed the Window
from vtkplotter import embedWindow
embedWindow(False)

from PyQt5 import Qt
from vtk.qt.QVTKRenderWindowInteractor import QVTKRenderWindowInteractor

from vtkplotter import Plotter, Cone

class MainWindow(Qt.QMainWindow):
    def __init__(self, parent=None):

        Qt.QMainWindow.__init__(self, parent)
        self.frame = Qt.QFrame()
        self.vl = Qt.QVBoxLayout()
        self.vtkWidget = QVTKRenderWindowInteractor(self.frame)
        self.vl.addWidget(self.vtkWidget)

        vp = Plotter(qtWidget=self.vtkWidget, axes=4, bg='white')

        vp += Cone()
        vp.show()      # create renderer and add the actors

        # set-up the rest of the Qt window
        self.frame.setLayout(self.vl)
        self.setCentralWidget(self.frame)

        self.show()    # <--- show the Qt Window

window = MainWindow()
Tested on OSX Mojave (10.14.1) with Python 3.6.7, IPython 7.0.0, vtkplotter 2019.4.3, vtk 8.1.2, PyQt5 5.11.3 and PyQt5-sip 4.19.13.
Hello,
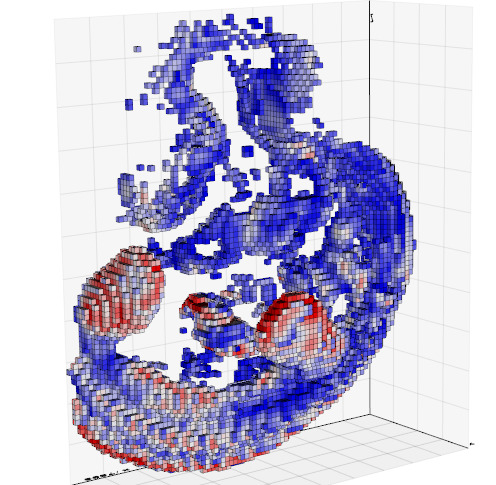
I have been using vtkplotter do develop an application to render anatomical data of the mouse brain in python (https://github.com/BrancoLab/BrainRender).
It has been working great so far, the only problem I have found is when I display multiple actors (brain regions) with alpha < 1. Then, when the scene is rendered it looks weird:

for instance here the two structures circled in blue should be behind the larger one circled in red.
This seems to be a consistent bug: with multiple semi-transparent object they are not rendered so that an object behind another is partially hidden. The effect is even more evident when the objects have multiple colors.
Because of how densely structured the brain is, it's crucial to be able to display structures with some transparency so that you can see what's behind the surface, so it would be great if you could advise a way to fix this.
Thank you,
Federico
Hallo,
How can I save high quality figures from the rendering window e.g. 300 dpi or more? When I save screenshot even with svg or eps, the quality is not good at all !
Thanks in advanced
Hakam Shams
Hello, I have succesfully build a FEniCS Docker container incluiding vedo, but when I try to use vedo I encounter the error:
ERROR: In /work/standalone-x64-build/VTK-source/Rendering/OpenGL2/vtkXOpenGLRenderWindow.cxx, line 1223 vtkXOpenGLRenderWindow (0x24992f0): bad X server connection. DISPLAY=Aborted (core dumped)
It appears that vedo or vtk can not run without the X server. Is there any way to solve this issue?
Hi, really great library! Many thanks for making this available.
One unexpected thing I ran into: I want to plot a colorcoded mesh (with values on the vertices, defined by colormaps). I computed the values for the vertices separately. I went through the mesh_coloring.py example. However, there seems to be a mismatch in the number of points returned by .N() with what is in the file, e.g. when I do vp.open("data/shuttle.obj") for instance, there are 660 points as output to .N(), whereas in the file, I see only 310 vertices. I run into this issue with some .STL files that I generated with the meshio library from NumPy.
Thanks for any pointers.
The results of the mesh_coloring.py example does not produce a colored man in the middle as would be expected, see image:

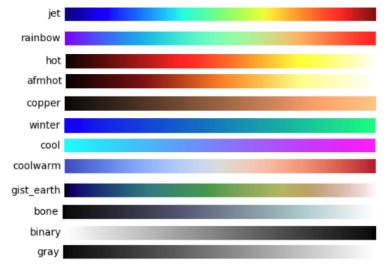
What I'd like to do is setting the colors per point of an polydata object based on my own colormap, so that I can define the scaling from min to max.
# myarr is a numpy float32 1D array with e.g. min=10, max = 20000
from vtkplotter import colorMap
r, g, b = colorMap(... name='jet', vmin=myarr.min(), vmax=myarr.max())
and somehow pass this to an actor:
man1.pointColors(myarr alpha=0.5, cmap=MyColormapAbove)
A working example would be very helpful.
After installing the last version of vtkplotter I can't plot normally. Trying a simple plot with
from vtkplotter.dolfin import *
plot(u)
gives me the error
Error in show(): wrong renderer index 0
I have a Jupyter notebook running on a server on a specific port and IP. The notebook runs fine locally however, the kernel dies when I run the notebook from another computer. The line that crashes is vp = Plotter(title='My title goes here').
I am running the notebook in the server with jupyter notebook --no-browser --port=8080 --ip 10.xxx.xx.xx. Access is done via http://10.xxx.xx.xx:8080/?token=xxx. Could you guys think of something else I can try? Thanks.
Hi, I am using vtkplotter with FEniCS and any option that i pass to vtkplotter.dolfin.plot() do not work. In my code I try to use the alpha=0.3 and lw=0 options but, the mesh always shows opaque and with lines.
I have installed vtkplotter with pip3 install vtkplotter in Ubuntu 18.04
My code is the following:
from fenics import *
from mshr import *
import vtkplotter as vtkp
import dolfin as df
import numpy as np
from math import sin, cos, pi, sqrt

# My domain is a cylinder
height_cylinder = 150.00
r = 25.0
my_domain = Cylinder(Point(0, 0, 0), Point(0, 0, height_cylinder), r, r)

# I generate the mesh
mesh = generate_mesh(my_domain, 100)

# I have one subdomains which is a cylindrical shell inside the domain
ri_shell = 13.00
ro_shell = 17.00
tol = 5e-1

class Shell(SubDomain):

    def __init__(self):
        super().__init__()
    def inside(self, x, on_boundary):
        if ((x[0]**2 + x[1]**2 <= (ro_shell + tol)**2) and (x[0]**2 + x[1]**2 >= (ri_shell - tol)**2 ) and between(x[2], (0, height_cylinder)) ):
            return True

shell = Shell()

# I have a second subdomain which is a small cylinder inside the shell in coordinates x = 3 y y = 2.1
r_small = 3

class SmallCylinder(SubDomain):

    def __init__(self):
        super().__init__()

    def inside(self, x, on_boundary):
        if ( ( (x[0] - 3.0)**2 + (x[1] - 2.1)**2 <= (r_small + tol)**2 ) and between(x[2], (0, height_cylinder)) ):
            return True

smallCylinder = SmallCylinder()

# After the subdomains have been created I make a MeshFunction to mark the subdomains
materials = MeshFunction("size_t", mesh, 0, mesh.domains())

shell.mark(materials, 1)
smallCylinder.mark(materials, 2)

# I generate the function spaces
V = FunctionSpace(mesh, 'P', 2)
dx = Measure('dx', domain=mesh, subdomain_data=materials)
V0 = FunctionSpace(mesh, 'DG', 0)

vtkp.dolfin.plot(materials, lw=0, alpha=0.35)
Hi Marco,
Am I wrong saying that embedding the plot into jupyter notebook cell output and setting infinity True or False has no effect and shows never a parallel projection?
Backend panel is always in parallel projection mode but does not show axes and cmap.
I was playing around with example markmesh.
markmesh.zip
Siegfried
I'm trying to add an outline to my actors. This is an attempt to create a cell-shading like appearance without having to manually edit the shaders.
I create an outline by adding a vtkPolyDataSilhouette to the polydata. This works fine in vtk, the outline updates when the camera changes position.
However when I create an vtkplotter Actor the outline no longer gets updated.
It does not matter whether I create the outline using the Actor.silhouette function or create an Actor from the vtkActor.
Somehow the update-connection is lost when the vtkActor is converted to a vtkplotter Actor.
As a work-around I tried adding the vtkActors to the rendered manually, but they get deleted from the render in the show().
from vtkplotter import *

# --------- 1. First attempt -------

p = Plotter()
a = Cone()
s = a.silhouette(direction=p.renderers[0].GetActiveCamera())  # p.camera is None until p.show is called
s.lw(3)

a.alpha(0.3)
p.add(a)
p.add(s)
p.show()  # <--- outline is not updated when camera position changes

# ------ 2. and now using raw vtk :: This works ------

import vtk

renderer = vtk.vtkRenderer()
renderer.SetBackground(1,1,0)

renderWindow = vtk.vtkRenderWindow()
renderWindow.SetSize(640, 480)
renderWindow.AddRenderer(renderer)

interactor = vtk.vtkRenderWindowInteractor()
interactor.SetRenderWindow(renderWindow)

dataset = a.GetMapper().GetInputAsDataSet()

outline = vtk.vtkPolyDataSilhouette()
outline.SetInputData(dataset)
outline.SetEnableFeatureAngle(True)
outline.SetBorderEdges(True)
outline.SetCamera(renderer.GetActiveCamera())
outlineMapper = vtk.vtkPolyDataMapper()
outlineMapper.SetInputConnection(outline.GetOutputPort())

actor = vtk.vtkActor()
actor.SetMapper(outlineMapper)
actor.GetProperty().SetColor(0,0,0)
actor.GetProperty().SetLineWidth(3)
renderer.AddActor(actor)

renderWindow.Render()
renderer.ResetCamera()
interactor.Start()   # <---- Outline updates when camera position changes

# --------- 3. and finally again with vtkplotter

vpa = Actor(actor)  # <-- Create an vtkplotter actor based on the vtkActor
p2 = Plotter()
p2.add(vpa)
p2.show()
Marco, I've been using spherical harmonics to represent 3D meshes. I am using a package called pyshtools that provides a very simple way of doing the decomposition into spherical harmonics via least square fitting of a list of points (x,y,z). Works fairly well for convex shapes, but it has a hard time to represent well more concave shapes. Before I go ahead and try to improve the reconstruction algorithm, I was wondering whether this sort of shape decomposition is something you are considering to incorporate into vtkPlotter.
Thanks a lot,
Hi @marcomusy,
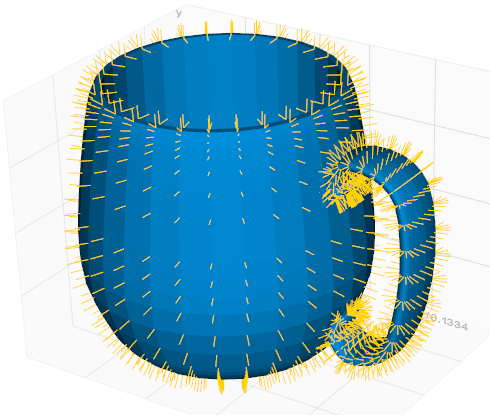
I am trying to use your library to visualize data from thermal comfort studies. I have several manikins like the one shown below and I intend to color individual polygons based on the amount of thermal radiation incident on them (as shown in the screencapture in the second picture)


The part about loading the geometry is super simple due to the methods in your vtkPlotter class. I could not find a way to interact with the individual faces of the obj through any of the methods. I also tried to understand the methods and attributes available at runtime through the debugger in Pycharm but could not get much far. Any suggestions?
Thanks,
Sarith
I get an error when I want to write actors to a pickle file.
import vtkplotter
import pickle

obj = vtkplotter.Sphere()

data = {'actors': obj}
with open('actors.pickle', 'wb') as f:
    pickle.dump(data, f)
TypeError: can't pickle Actor objects
Hello!
Ok, first of all, congrats! this is a great effort!
Second, Ok, I normally work with fenics running on docker containers and often use jupyter notebooks as interface. I am not a docker expert and despite being able to install vtkplotter in my containers its proven to be quite tricky to get it to work with jupyter in a container. So leaving this on the side for a second . I then installed fenics using anaconda, which at the minute its tha same release as my docker images 2018.1.0, which its great as I am more competent managing conda environments. which makes vtkplotter also straigthforward to install via pip. Up to here all its great
I started to play with notebooks again (as cli and scripts all work fine) and yes, at least in the most elementary cases the plotter works. (all this is under ubuntu 18)

However, as expected the new window does not close until it is killed, and the plotter of course becomes not usable (a new call kills the kernel). So my question is, is there a standard way in which the vtk windows should be handled (closed)? The snippet i use to create the pic above is:
`from vtkplotter.dolfin import datadir, plot
mesh = dolfin.Mesh(datadir+"dolfin_fine.xml")
pme=plot(mesh)
`
I really would appreaciate any help with this.
Thanks a lot and again, great module!
Regards
Carlos


I am new to vtkplotter. I attached a couple of pictures that explain the issue.
I can't get rid of those contour lines unless I manually uncheck visibility of "line #1" after the plot command is issued. I never explicitly issued a command to generate "line #1".
Is there a way to not get those lines by default? I checked all options; maybe I missed something.
Thanks for the help
Hi,
I used your lib to calc some cubes for vis, which was nice. However, It seems that you choose to omit normal computation with commit jupyter support,
which is one kind of nice choice to remove these somehow duplicated codes. However, the helper docs are not updated, Polygon/Disc/Box/Cube still have normal function helper. And what is more, Grid/Plane still keeps normal parameter.
So, why this somehow brute decision is made (break backward compatibility) and again, why behaviors are not constant? And is there a better replacement for transform with normal?
Looking forward to your reply.
Thank you for vtkplotter!
I am unable to clear or close the vtkplotter window after plotting by hitting the top right cross. Key strokes 'q' and 'e' deactivate the window but do not close it. Key stroke 'esc' yields to died jupyter kernel that restarts automatically afterwards followed by the following messages:
ERROR:root:Invalid alias: The name clear can't be aliased because it is another magic command.
ERROR:root:Invalid alias: The name more can't be aliased because it is another magic command.
ERROR:root:Invalid alias: The name less can't be aliased because it is another magic command.
ERROR:root:Invalid alias: The name man can't be aliased because it is another magic command.
I did several demos but above described behavior is always the same. I tried backends 'tk' and 'qt' with same result.
System: debian 10 (buster)
The version of the notebook server is: 5.7.8
Python 3.7.3rc1 (default, Mar 13 2019, 11:01:15) [GCC 8.3.0]
IPython 7.5.0
vtkplotter 2019.1.6, vtk 8.1.2, python 3.7
The only workaround I found for the moment is to restart the jupyter kernel (what closes also all open vtkplotter windows).
I am wondering for the moment if the error comes from vtkplotter, jupyter or system. Please let me know if you experience similar behavior or found a solution. I attach my jupyter file:
Best regards
Siegfried
Does it work with https://github.com/InsightSoftwareConsortium/itk-jupyter-widgets ?
I don't know how to implement the above without show(), thanks~
Ref: here,
It may just be my inexperience, but I am unable to get a background image to work properly for a plotter when N is greater than 3 or if the plotter shape is more than 1 row. I plan to eventually use the plotter to randomly place an actor on top of the image and save a screenshot so the ability to have more than one row is a major plus.
The below code will produce the desired output of the background image (N is less than 3).
from vtkplotter import *

vp = Plotter(N=2, axes=0, size=(600,800), bg=datadir+"images/tropical.jpg")

vp.show(interactive=1)

However, after running the following code, you see that rows of the plotter just turn black instead of displaying the background image.
from vtkplotter import *

vp = Plotter(N=9, axes=0, size=(600,800), bg=datadir+"images/tropical.jpg")

vp.show(interactive=1)

Any help is greatly appreciated!
Hi guys. First of all, thank you so much for developing vtkPlotter. I have been a VTK user (C++ and Python) for many years now and I found amazing what can be achieved using vtkPlotter with only a few lines of code.
Here is what I am working on. I have a time sequence of an object (closed mesh) with 32 timepoints. I want to animate the movement and deformation of this object in time. Usually I would export each timepoint as a vtk polydata file, open the sequence of files in paraview and play it. However, I want to do that in vtkPlotter if possible. The code bellow is my very first attempt -- no animation so far. Could you guys help me to improve it? I can help to turn this into an official example if you think it might be of interest of others. Thanks a lot,
n = 8
vp = Plotter()
coo = np.random.rand(n*12).reshape(n,12)
for i in range(n):
    u = coo[i,3:6]
    v = coo[i,6:9]
    q = coo[i,9:12]
    ell = Ellipsoid(pos=(2.5*coo[i,0], 2.5*coo[i,1], 2.5*coo[i,2]), axis1=u, axis2=v, axis3=q)
    scals = [i] * ell.N()
    ell.pointColors(scals, vmin=0, vmax=n)
    ell.VisibilityOff()
    vp += ell
vp.show()
Hi,
Thank you for the amazing resource.
I've been trying to export actors and whole scenes as .OBJ files, but I think I've found a bug.
In vtkplotter.vtkio both .write() and .save() should support .obj files:
def write(objct, fileoutput, binary=True):
    """
    Write 3D object to file. (same as `save()`).
    Possile extensions are:
        - vtk, vti, npy, ply, obj, stl, byu, vtp, vti, mhd, xyz, tif, png, bmp.
    """
but an error is thrown if one tries to save as .obj:
Unknown format scene.obj file not saved.
In write() in the if/else statements checking for the file format there is no if ".obj" in fr
so ".obj" is not recognized as a valid format.
Is ".obj" going to be supported in the future?
When embedding a plotter in a qt application, plotter.show() needs to be called to create a renderer instance.
This call fails for some axes types, among which the default axes=4.

import sys
from PyQt5 import Qt
from vtk.qt.QVTKRenderWindowInteractor import QVTKRenderWindowInteractor

from vtkplotter import Plotter, Cube, Torus, Cone, settings

settings.usingQt = True


class MainWindow(Qt.QMainWindow):
    def __init__(self, parent=None):

        Qt.QMainWindow.__init__(self, parent)
        self.frame = Qt.QFrame()
        self.vl = Qt.QVBoxLayout()
        self.vtkWidget = QVTKRenderWindowInteractor(self.frame)
        self.vl.addWidget(self.vtkWidget)

        # vp = Plotter(offscreen=True, interactive=False, axes=2) # <== works
        vp = Plotter(offscreen=True, interactive=False, axes=4) # <== fails

        vp += Cone()

        vp.show()  # to create renderer

        # further setup here - omitted for clarity

        self.show() # <-- just to be able to close the application

if __name__ == "__main__":
    app = Qt.QApplication(sys.argv)
    window = MainWindow()
app.exec_()
Hi I am getting the following error when I try to use vtkplotter in a Jupyter notebook. I am using ubuntu 19.04, and installed vtkplotter with pip3 install vtkplotter
---------------------------------------------------------------------------
ImportError                               Traceback (most recent call last)
/usr/local/lib/python3.6/dist-packages/vtk/vtkOpenGLKit.py in <module>
      4     # use relative import for installed modules
----> 5     from .vtkOpenGLKitPython import *
      6 except ImportError:

ImportError: libGL.so.1: cannot open shared object file: No such file or directory

During handling of the above exception, another exception occurred:

ModuleNotFoundError                       Traceback (most recent call last)
<ipython-input-1-521f4ae024dc> in <module>
      5 from math import sin, cos, pi, sqrt
      6
----> 7 import vtkplotter.dolfin as vtkplot
      8
      9 import matplotlib.pyplot as plt

/usr/local/lib/python3.6/dist-packages/vtkplotter/__init__.py in <module>
     51
     52 from vtkplotter.version import _version as __version__
---> 53 from vtkplotter.animation import Animation
     54 from vtkplotter.plotter import *
     55 from vtkplotter.analysis import *

/usr/local/lib/python3.6/dist-packages/vtkplotter/animation.py in <module>
      1 from __future__ import division, print_function
      2 import numpy as np
----> 3 import vtkplotter.utils as utils
      4 from vtkplotter.utils import ProgressBar, linInterpolate
      5 from vtkplotter.colors import printc, getColor

/usr/local/lib/python3.6/dist-packages/vtkplotter/utils.py in <module>
      1 from __future__ import division, print_function
----> 2 import vtk, sys
      3 from vtk.util.numpy_support import numpy_to_vtk, numpy_to_vtkIdTypeArray
      4 import numpy as np
      5 import vtkplotter.colors as colors

/usr/local/lib/python3.6/dist-packages/vtk/__init__.py in <module>
     10 from .vtkRenderingKit import *
     11 from .vtkIOKit import *
---> 12 from .vtkOpenGLKit import *
     13 from .vtkParallelKit import *
     14 from .vtkWrappingKit import *

/usr/local/lib/python3.6/dist-packages/vtk/vtkOpenGLKit.py in <module>
      7     # during build and testing, the modules will be elsewhere,
      8     # e.g. in lib directory or Release/Debug config directories
----> 9     from vtkOpenGLKitPython import *

ModuleNotFoundError: No module named 'vtkOpenGLKitPython'
Thanks for this amazing software. However, it appears that the plot functionality only works for jupyter notebook, and will not work for jupyter lab. When trying to execute "show" command for function plotting, it will simply fail with an error message saying "error displaying widget module not found". Any possibility to correct this issue? Thanks!
Hey Marco.
I am trying to come up with a simple example where I use ipywidget to control an actor, but I had no success so far. Would you have any suggestion?
This is what my code looks like right now:
from vtkplotter import *
from ipywidgets import interact

vp = Plotter()
s = Sphere()
vp.add(s)
def f(x):
    s.pos(x,x,x)
interact(f, x=10)
vp.show()
Bother again ~~~
How to browse the mesh sequence like browsing pictures under the folder in a simple and elegant way! Sometimes it's useful. Maybe it can be put into the basic examples.
By the way, when I loaded the mesh with texture, the result was incorrect, what is the reason for this?
THANKS!!!
Hi, Marco Musy,
How are you doing there ?
I am new using vtkplotter, trying to calculate the inner volume of my .stl files.
didn't see a ready use method yet.
Is there one ready developed by you ?
tks.
Henry
When an actor is made using Line(p0, p1) and later the number of vertices in increased using setPoints([p0,p1,p2]) then the polydata is updated but the additional line segment is not shown.
from vtkplotter import *

p0 = (0,0,0)
p1 = (1,1,1)
p2 = (-2,4,0)

L = Line(p0,p1, lw=4)    # <-- setup using two points
L.setPoints([p0,p1,p2])   # <-- increase to three points
print(L.getPoint(2))         # <-- the point is there

vp = Plotter(verbose=0)
vp += L

Lexpected = Line([p0,p1,p2]).c('black')
vp += Lexpected

vp.show()
I would expect the red line (initialized with two points, one added later) to overlap the black one (created from three points).

Hello Marco,
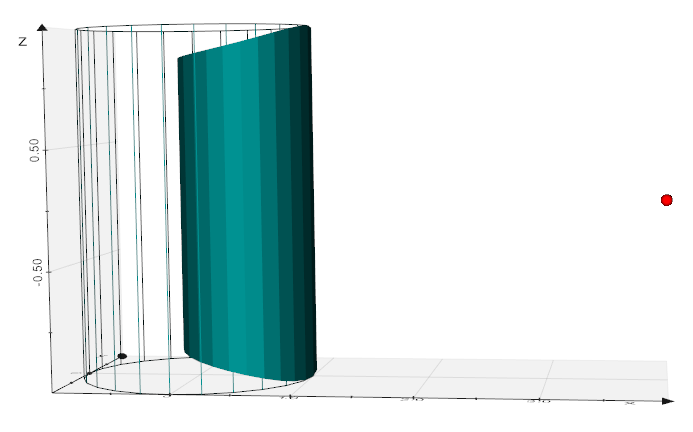
I am expensively using dolfin and therefore like vtkplotter for "inSitu" display of simulation results. Everything works well as long as I start the python script with mpi support (For example: mpiexec -np 4 navier-Stokes-lshape.py). In the later case 4 vtkplotter windows open showing the results for each dolfin mesh partition.
Kindly ask you if there is any functionality within vtkplotter to bring all the partitions together and show them just in one window.
Regards
Siegfried
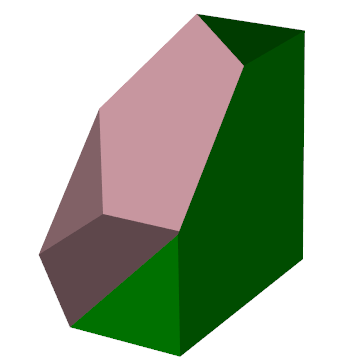
Is this a problem of meshes?
from vtkplotter import *
s1 = load('BWom0317-HD2-O02P01-S-1.obj')
s2 = load('rp_alexandra_rigged_004_yup_t-1.obj', alpha=0.4)
#s1 = load('1_n.obj')
#s2 = load('2_n.obj', alpha=0.4)
s1.distanceToMesh(s2, signed=True, negate=False)
s1.addScalarBar(title='Signed\nDistance', c='black')

show([s1, [s1, s2]], N=2, bg='white')


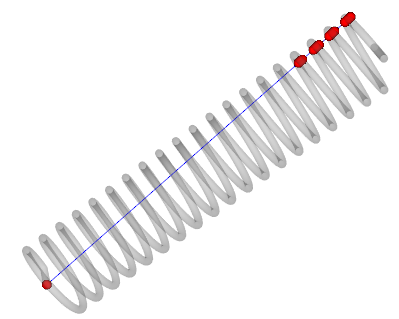


When running thinplate_grid.py, I have the following error. @marcomusy , could you have a look?
Python 3.7.3 (default, Mar 27 2019, 09:23:15)
IPython 7.4.0 -- An enhanced Interactive Python. Type '?' for help.

from vtkplotter import *
import numpy as np

np.random.seed(2)

grids = []
for i in range(10):
    grids.append(Grid([0, 0, i / 10.0], resx=100, resy=100))
act = mergeActors(grids)  # merge grids into a single object

idxs = np.random.randint(0, act.N(), 10)  # pick 10 indexes

ptsource, pttarget = [], []
for i in idxs:
    ptold = act.getPoint(i) + np.random.randn(3) * 0.02
    ptsource.append(ptold)
    ptnew = ptold + [0, 0, np.random.randn(1) * 0.10]  # move in z
    pttarget.append(ptnew)

warped = thinPlateSpline(act, ptsource, pttarget)
warped.alpha(0.2).color("b")
# print(warped.getTransform())

apts = Points(ptsource, r=5, c="r")
arrs = Arrows(ptsource, pttarget)

show(warped, apts, arrs, Text(__doc__), axes=9, viewup="z", bg="w")

## -- End pasted text --
---------------------------------------------------------------------------
ValueError                                Traceback (most recent call last)
<ipython-input-1-369e5917c20a> in <module>
    23
    24 apts = Points(ptsource, r=5, c="r")
---> 25 arrs = Arrows(ptsource, pttarget)
    26
    27 show(warped, apts, arrs, Text(__doc__), axes=9, viewup="z", bg="w")

/usr/local/lib/python3.7/site-packages/vtkplotter/shapes.py in Arrows(startPoints, endPoints, s, scale, c, alpha, res)
    584     arrg = Glyph(pts, arr.GetOutput(),
    585                  orientationArray=orients, scaleByVectorSize=True,
--> 586                  c=c, alpha=alpha)
    587     settings.collectable_actors.append(arrg)
    588     return arrg

/usr/local/lib/python3.7/site-packages/vtkplotter/shapes.py in Glyph(actor, glyphObj, orientationArray, scaleByVectorSize, c, alpha)
    192     gly.SetColorModeToColorByScalar()
    193
--> 194     if orientationArray != "":
    195         gly.OrientOn()
    196         gly.SetScaleFactor(1)

ValueError: The truth value of an array with more than one element is ambiguous. Use a.any() or a.all()
Hi @marcomusy,
I have tried to run demo trail with Python 3.5.2 and VTK 7.0 on MacOS with latest version 2019.1.4
I have encountered at least two problems
f in front of formula string. Isn't it a r requested? I fixed it and could go further on.RenderPointsAsSpheresOn for vtkRenderingOpenGL2Python.vtkOpenGLPropertyThe logs are presented below.
Here is the log of the 1st problem
from vtkplotter import Plotter, sin, Sphere, Point

## -- End pasted text --
Traceback (most recent call last):

File "/Library/Frameworks/Python.framework/Versions/3.5/lib/python3.5/site-packages/IPython/core/interactiveshell.py", line 2963, in run_code
    exec(code_obj, self.user_global_ns, self.user_ns)

File "<ipython-input-1-2aa1e2f83d5e>", line 1, in <module>
    from vtkplotter import Plotter, sin, Sphere, Point

File "/Library/Frameworks/Python.framework/Versions/3.5/lib/python3.5/site-packages/vtkplotter/__init__.py", line 51, in <module>
    from vtkplotter.plotter import *

File "/Library/Frameworks/Python.framework/Versions/3.5/lib/python3.5/site-packages/vtkplotter/plotter.py", line 14, in <module>
    import vtkplotter.addons as addons

File "/Library/Frameworks/Python.framework/Versions/3.5/lib/python3.5/site-packages/vtkplotter/addons.py", line 6, in <module>
    import vtkplotter.shapes as shapes

File "/Library/Frameworks/Python.framework/Versions/3.5/lib/python3.5/site-packages/vtkplotter/shapes.py", line 1464
    plt.text(0.5, 0.5, f'${formula}$',
                                    ^
SyntaxError: invalid syntax
Here is the log of the 2nd problem
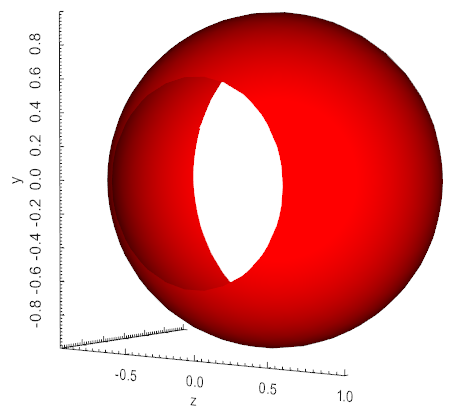
from vtkplotter import Plotter, sin, Sphere, Point
 vp = Plotter(axes=6, interactive=0)
 s = Sphere(c="green", res=24)
 ## -- End pasted text --
 ---------------------------------------------------------------------------
 AttributeError                            Traceback (most recent call last)
 <ipython-input-1-2aa1e2f83d5e> in <module>()
    4 vp = Plotter(axes=6, interactive=0)
    5
 ----> 6 s = Sphere(c="green", res=24)
    7 s.cutWithPlane([-0.9, 0, 0], showcut=True)  # cut left part of sphere
    8

/Library/Frameworks/Python.framework/Versions/3.5/lib/python3.5/site-packages/vtkplotter/shapes.py in Sphere(pos, r, c, alpha, res)
    697     ss.Update()
    698     pd = ss.GetOutput()
--> 699     actor = Actor(pd, c, alpha)
    700     actor.GetProperty().SetInterpolationToPhong()
    701     actor.SetPosition(pos)

/Library/Frameworks/Python.framework/Versions/3.5/lib/python3.5/site-packages/vtkplotter/actors.py in __init__(self, poly, c, alpha, wire, bc, texture, computeNormals, u)
    541
    542         if settings.renderPointsAsSpheres:
--> 543             prp.RenderPointsAsSpheresOn()
    544
    545         if alpha is not None:

AttributeError: 'vtkRenderingOpenGL2Python.vtkOpenGLProperty' object has no attribute 'RenderPointsAsSpheresOn'
Hi Marco, i have been trying to visualize a mesh segmentation. That is: vertices with y-coordinate bellow y_n get a color/class c_1, vertices with y-coordinate between y_n and y_m get a color c_2, and so forth but no success. The "bands" feature does not work because the intervals have the same length.
Is there a way to accomplish this?
in my installation of vtkplotter, the plotter class doesn't seem to have a camera attribute. I see it in the source code...
In [1]: import vtkplotter

In [2]: vp = vtkplotter.Plotter()

In [3]: vp.camera
---------------------------------------------------------------------------
AttributeError                            Traceback (most recent call last)
<ipython-input-3-f88340b80664> in <module>
----> 1 vp.camera

AttributeError: 'Plotter' object has no attribute 'camera'

In [4]: print(vtkplotter.__version__)
2019.3.5
any idea what might be going on?
When I run this example:
import vtk
import numpy as np
from vtkplotter import *

raw = np.random.rand(8**3).reshape(8,8,8)

img = vtk.vtkImageData()
img.SetDimensions(raw.shape)

raw = raw.transpose(2,1,0).flatten()
arr = vtk.util.numpy_support.numpy_to_vtk(raw, array_type=vtk.VTK_FLOAT)
img.GetPointData().SetScalars(arr)

cf = vtk.vtkContourFilter()
cf.SetInputData(img)
cf.SetValue(0, 0.5)
cf.Update()

polydata = cf.GetOutput()
print(polydata.GetNumberOfPoints())

writer = vtk.vtkPolyDataWriter()
writer.SetFileName('test.vtk')
writer.SetInputData(polydata)
writer.Write()

show(polydata)
show crashes with the error:
<ipython-input-1-b127f86b495e> in <module>
     25 writer.Write()
     26
---> 27 show(polydata)

~/anaconda3/envs/clustering/lib/python3.6/site-packages/vtkplotter/plotter.py in show(*actors, **options)
    249             interactive=interactive,
    250             interactorStyle=interactorStyle,
--> 251             q=q,
    252         )
    253

~/anaconda3/envs/clustering/lib/python3.6/site-packages/vtkplotter/plotter.py in show(self, *actors, **options)
   1521                                                  color_map=kcmap,
   1522                                                  opacity=iap.GetOpacity(),
-> 1523                                                  wireframe=(krep==1))
   1524
   1525                         if iap.GetInterpolation() == 0:

~/anaconda3/envs/clustering/lib/python3.6/site-packages/k3d/k3d.py in vtk_poly_data(poly_data, color, color_attribute, color_map, wireframe, opacity, name, compression_level, **kwargs)
    814
    815     if color_attribute is not None:
--> 816         attribute = numpy_support.vtk_to_numpy(poly_data.GetPointData().GetArray(color_attribute[0]))
    817         color_range = color_attribute[1:3]
    818     else:

~/anaconda3/envs/clustering/lib/python3.6/site-packages/vtk/util/numpy_support.py in vtk_to_numpy(vtk_array)
    213
    214     """
--> 215     typ = vtk_array.GetDataType()
    216     assert typ in get_vtk_to_numpy_typemap().keys(), \
    217            "Unsupported array type %s"%typ

AttributeError: 'NoneType' object has no attribute 'GetDataType'
The polydata loads just fine when I open test.vtk in Paraview. Any idea of what could be going on?
I am using vtkplotter in my PyQt5 application. When I close the application, a window shows up which contains some errors I can't understand.
I also tried the qt_window.py example but I got the same error.
A screenshot of the error is attached.
Is there any way to solve this?

When using the "show" command to display the polygon actor, I found that after using this command, the structure of the underlying polygon mesh is modified. That is, the number of vertices of the mesh is different after viewing the mesh.
Example: lungs_obj is an actor containing a mesh surface. print(np.max(lungs_obj.getConnectivity())) # before using "show" command, it outputs "8707"
show(lungs_obj)
print(np.max(lungs_obj.getConnectivity())) # now it outputs "11902"
This should not happen, because that the "show" command is not supposed to modify its inputs. I am wondering how to avoid this phenomenon?
I am trying to create a 3D dataset (I do not want to use existing) using python.
The output will be a vtk structured data format.
The size of the dataset is user input (currently I am trying with 216*216) over a domain from -50.0 to 50.0 in a. I am calculating the scalar value at each grid location by the circle formula sqrt(xx + yy + zz)
I have written the following code but it seems to be incorrect as no file is being generated.
import vtk
import math
x=0
y=0
z=0
print("enter size of the dataset ")
limit=int(input())
for i in range(0,limit):
for j in range(0,limit):
for k in range(0,limit):
x=i
y=j
z=k
vol=math.sqrt(pow(x,2)+pow(y,2)+pow(z,2))
w=vtk.vtkDataSetWriter()
w.SetFileName('C:/Users/prakhyati/datafile1.vtk')
w.Update()
w.Write()
File ".../anaconda3/lib/python3.7/site-packages/vtkplotter/backends.py", line 85, in getNotebookBackend
if vp.shape[0] != 1 or vp.shape[1] != 1:
AttributeError: 'Plotter' object has no attribute 'shape'
why do i get this error after installing k3d ? worked before that.
Hi, thanks for such a great tool!
I'm trying to have changing text in an animation and don't manage to properly make it appear and disappear. Consider this example:
from vtkplotter import Text, screenshot, Plotter

vp = Plotter(axes=0, interactive=0)

for i in [1,2,3]:
    text = Text('%03d' %i)
    # vp.actors = [text] # this produces different results
    vp.add(text)
    vp.show()
    screenshot('test_%03d.png' %i)
    vp.remove(text)
Output: test_000.png shows 001 instead of 002...
Thanks a lot!
Hi,
First of all thanks you for such a great library with so many examples.
I am trying to plot points from an array. However, the resulting pic is always a line for this specific datapoints.
from vtkplotter import show, Points
positions = array([[0.16621395, 0.28789101, 0.        ],
       [0.        , 0.        , 0.        ],
       [0.24386514, 0.        , 0.        ],
       [0.07767649, 0.04484654, 0.12684517],
       [0.        , 0.        , 0.        ],
       [0.02198013, 0.01269023, 0.0358934 ],
       [0.13108585, 0.00570134, 0.01612581],
       [0.36077809, 0.        , 0.        ],
       [0.22941974, 0.3399008 , 0.08126898],
       [0.15449964, 0.01249786, 0.03534928]])

plot_cba = Plotter()
points_cba = Points(positions, c='black', r=0.01)
plot_cba += points_cba
show(points_cba)
When I try different datapoints without 0 in x, y, z coordinates the points seem to be fine !.
Not sure its a bug or is there any parameter to be modified to draw points with 0 in any of the coordinates.
Thanks in advance for your help.
very convenient to explore VTK files inside jupyter.
The example gallery is great but I cannot find a simple example of a direct show of a vtu file while picking the right scalar field to be presented on the mesh.
Any hints ?
Hello Marco,
reading the vtkplotter documentation I found:
parallelScale (float),
scaling used for a parallel projection ...
and was wondering how to switch from perspective to parallel projection? For the moment I just get the perspective projection.
Best regards
Siegfried
Hi @marcomusy , are there any other dependencies besides VTK to get the scripts up and running?
(Great project by the way!)
Hello Marco,
I need to work with 3D meshes inside my PyQt GUI.
As you might know, using vtk.qt.QVTKRenderWindowInteractor we can add a vtk renderer window to our PyQt.
I was wondering if there is some way to do the same with vtkplotter.
thanks.
A declarative, efficient, and flexible JavaScript library for building user interfaces.
🖖 Vue.js is a progressive, incrementally-adoptable JavaScript framework for building UI on the web.
TypeScript is a superset of JavaScript that compiles to clean JavaScript output.
An Open Source Machine Learning Framework for Everyone
The Web framework for perfectionists with deadlines.
A PHP framework for web artisans
Bring data to life with SVG, Canvas and HTML. 📊📈🎉
JavaScript (JS) is a lightweight interpreted programming language with first-class functions.
Some thing interesting about web. New door for the world.
A server is a program made to process requests and deliver data to clients.
Machine learning is a way of modeling and interpreting data that allows a piece of software to respond intelligently.
Some thing interesting about visualization, use data art
Some thing interesting about game, make everyone happy.
We are working to build community through open source technology. NB: members must have two-factor auth.
Open source projects and samples from Microsoft.
Google ❤️ Open Source for everyone.
Alibaba Open Source for everyone
Data-Driven Documents codes.
China tencent open source team.