Giter Club home page Giter Club logo

manifold's Introduction

Gitpod Ready-to-Code Build Status CII Best Practices

Manifold

This project is stable and being incubated for long-term support.

Manifold

Manifold is a model-agnostic visual debugging tool for machine learning.

Understanding ML model performance and behavior is a non-trivial process, given the intrisic opacity of ML algorithms. Performance summary statistics such as AUC, RMSE, and others are not instructive enough for identifying what went wrong with a model or how to improve it.

As a visual analytics tool, Manifold allows ML practitioners to look beyond overall summary metrics to detect which subset of data a model is inaccurately predicting. Manifold also explains the potential cause of poor model performance by surfacing the feature distribution difference between better and worse-performing subsets of data.

Table of contents

Prepare Your Data

There are 2 ways to input data into Manifold:

In either case, data that's directly input into Manifold should follow this format:

const data = {
  x:     [...],         // feature data
  yPred: [[...], ...]   // prediction data
  yTrue: [...],         // ground truth data
};

Each element in these arrays represents one data point in your evaluation dataset, and the order of data instances in x, yPred and yTrue should all match. The recommended instance count for each of these datasets is 10000 - 15000. If you have a larger dataset that you want to analyze, a random subset of your data generally suffices to reveal the important patterns in it.

x: {Object[]}

A list of instances with features. Example (2 data instances):

[{feature_0: 21, feature_1: 'B'}, {feature_0: 36, feature_1: 'A'}];
yPred: {Object[][]}

A list of lists, where each child list is a prediction array from one model for each data instance. Example (3 models, 2 data instances, 2 classes ['false', 'true']):

[
  [{false: 0.1, true: 0.9}, {false: 0.8, true: 0.2}],
  [{false: 0.3, true: 0.7}, {false: 0.9, true: 0.1}],
  [{false: 0.6, true: 0.4}, {false: 0.4, true: 0.6}],
];
yTrue: {Number[] | String[]}

A list, ground truth for each data instance. Values must be numbers for regression models, must be strings that match object keys in yPred for classification models. Example (2 data instances, 2 classes ['false', 'true']):

['true', 'false'];

Interpret visualizations

This guide explains how to interpret Manifold visualizations.

Manifold consists of:

Performance Comparison View

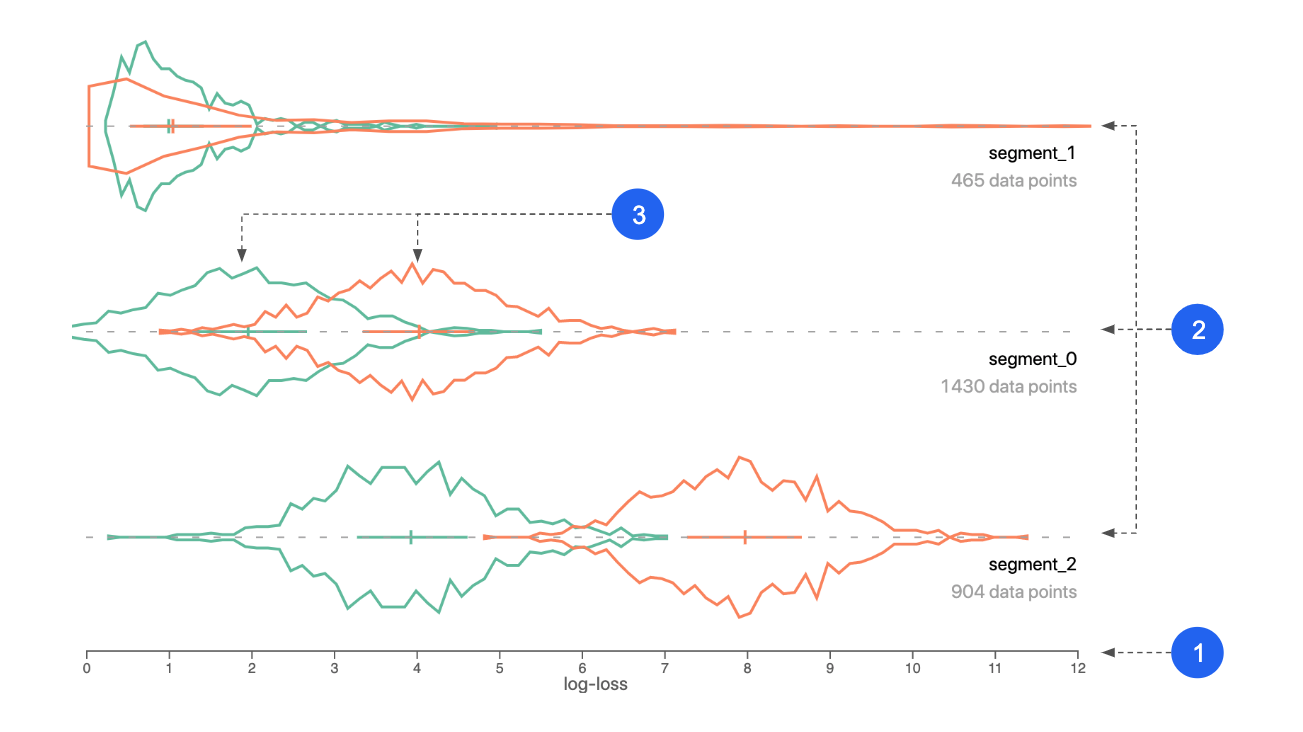
This visualization is an overview of performance of your model(s) across different segments of your data. It helps you identify under-performing data subsets for further inspection.

Reading the chart

performance comparison view

  1. X axis: performance metric. Could be log-loss, squared-error, or raw prediction.
  2. Segments: your dataset is automatically divided into segments based on performance similarity between instances, across models.
  3. Colors: represent different models.

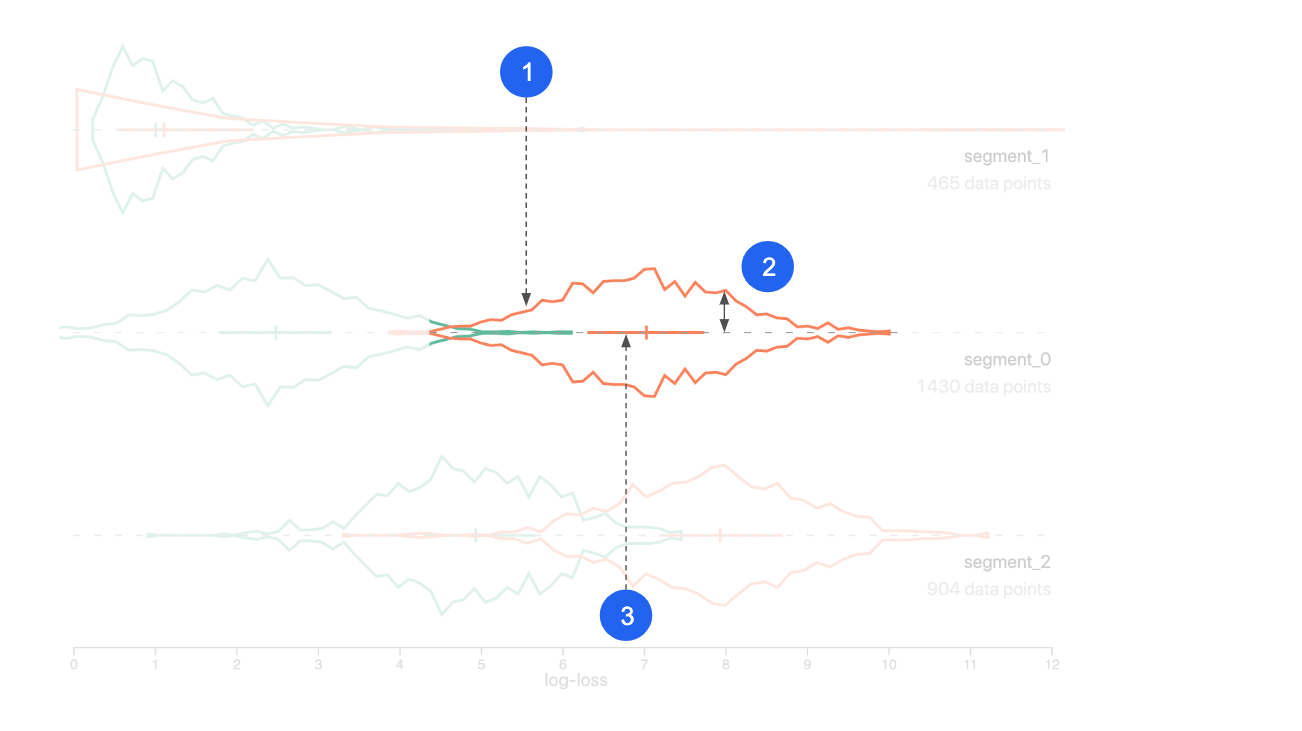
performance comparison view unit

  1. Curve: performance distribution (of one model, for one segment).
  2. Y axis: data count/density.
  3. Cross: the left end, center line, and right end are the 25th, 50th and 75th percentile of the distribution.

Explanation

Manifold uses a clustering algorithm (k-Means) to break prediction data into N segments based on performance similarity.

The input of the k-Means is per-instance performance scores. By default, that is the log-loss value for classification models and the squared-error value for regression models. Models with a lower log-loss/squared-error perform better than models with a higher log-loss/squared-error.

If you're analyzing multiple models, all model performance metrics will be included in the input.

Usage

  • Look for segments of data where the error is higher (plotted to the right). These are areas you should analyze and try to improve.

  • If you're comparing models, look for segments where the log-loss is different for each model. If two models perform differently on the same set of data, consider using the better-performing model for that part of the data to boost performance.

  • After you notice any performance patterns/issues in the segments, slice the data to compare feature distribution for the data subset(s) of interest. You can create two segment groups to compare (colored pink and blue), and each group can have 1 or more segments.

Example

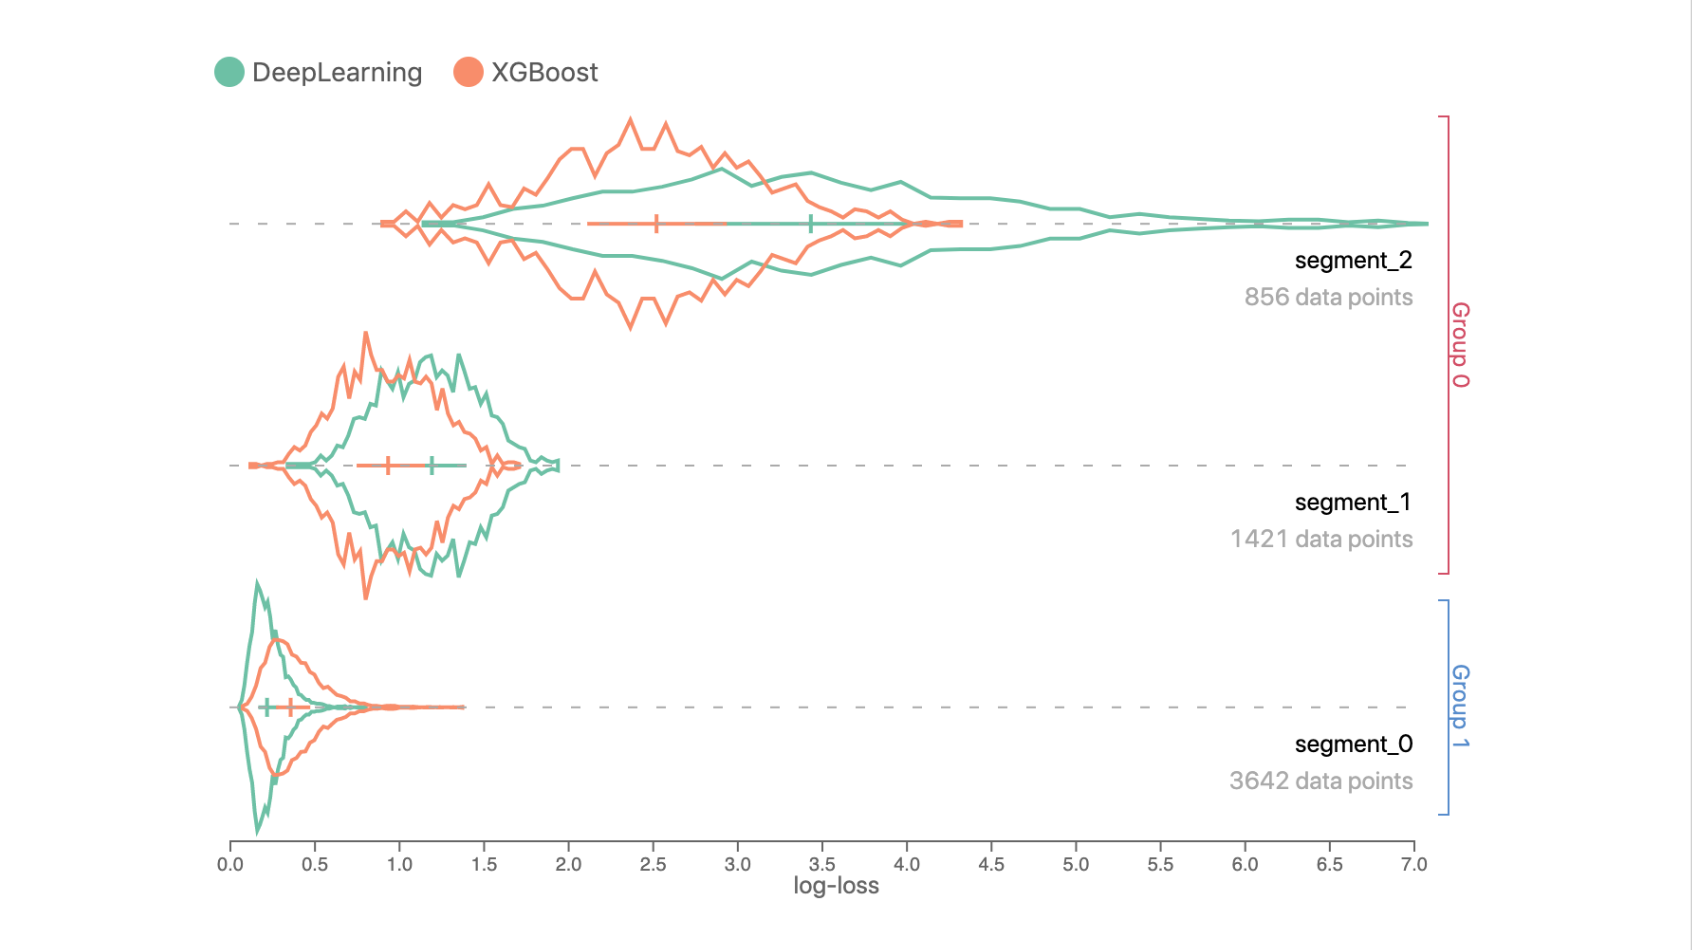
performance comparison view example

Data in Segment 0 has a lower log-loss prediction error compared to Segments 1 and 2, since curves in Segment 0 are closer to the left side.

In Segments 1 and 2, the XGBoost model performs better than the DeepLearning model, but DeepLearning outperforms XGBoost in Segment 0.


Feature Attribution View

This visualization shows feature values of your data, aggregated by user-defined segments. It helps you identify any input feature distribution that might correlate with inaccurate prediction output.

Reading the chart

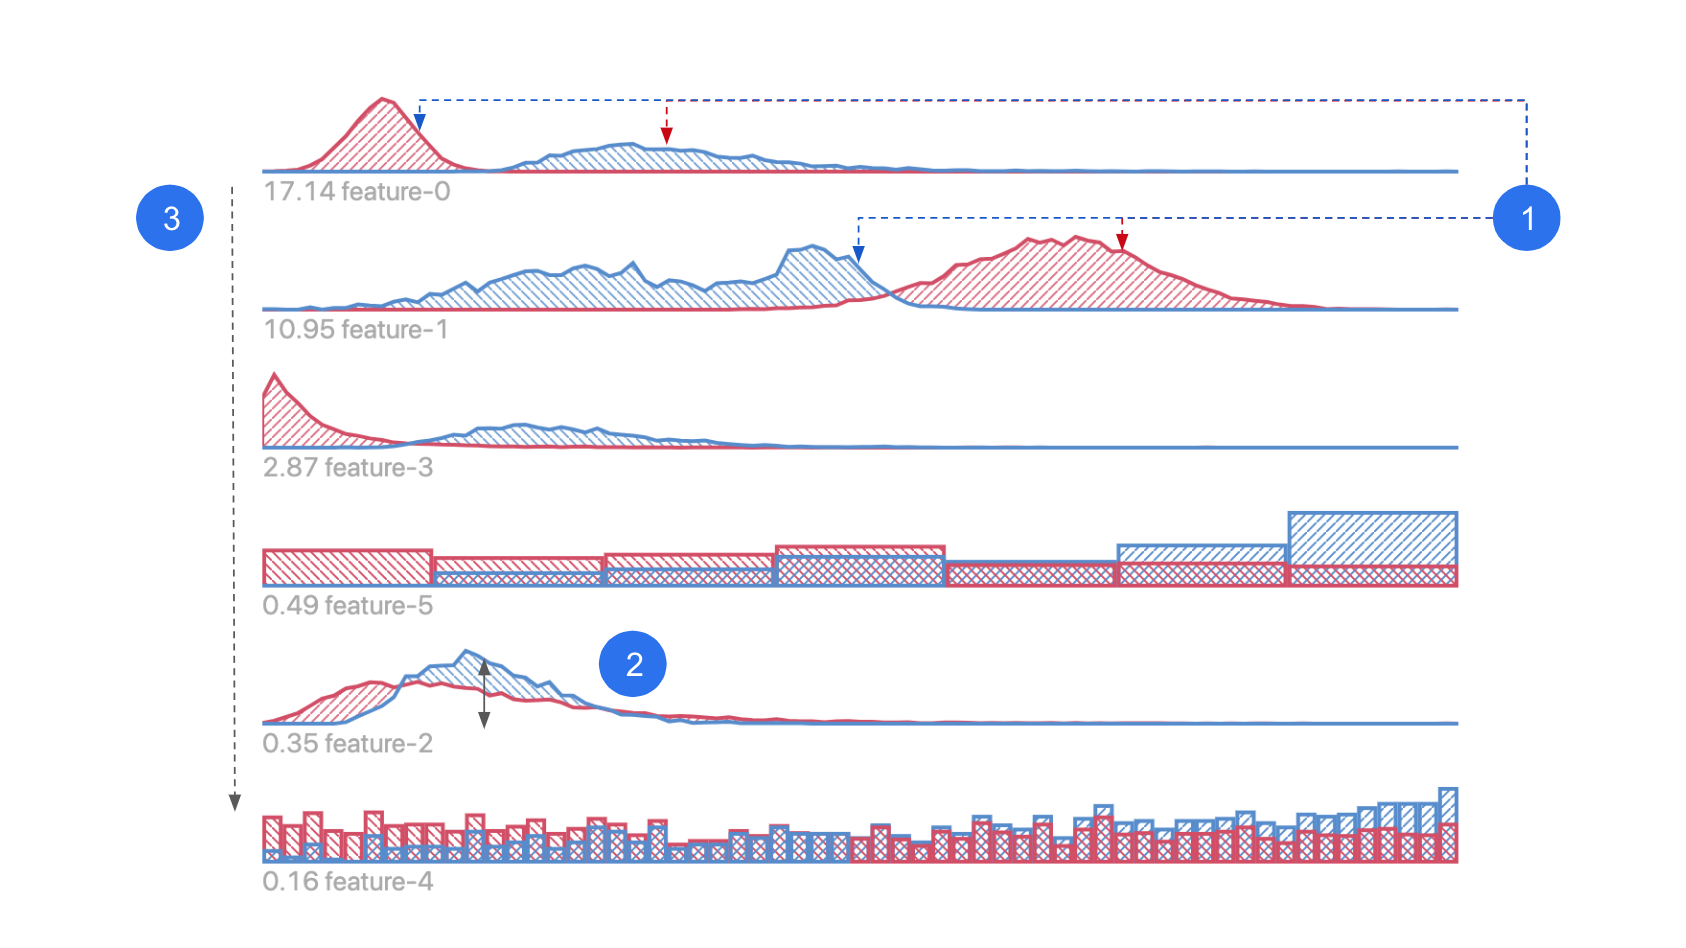
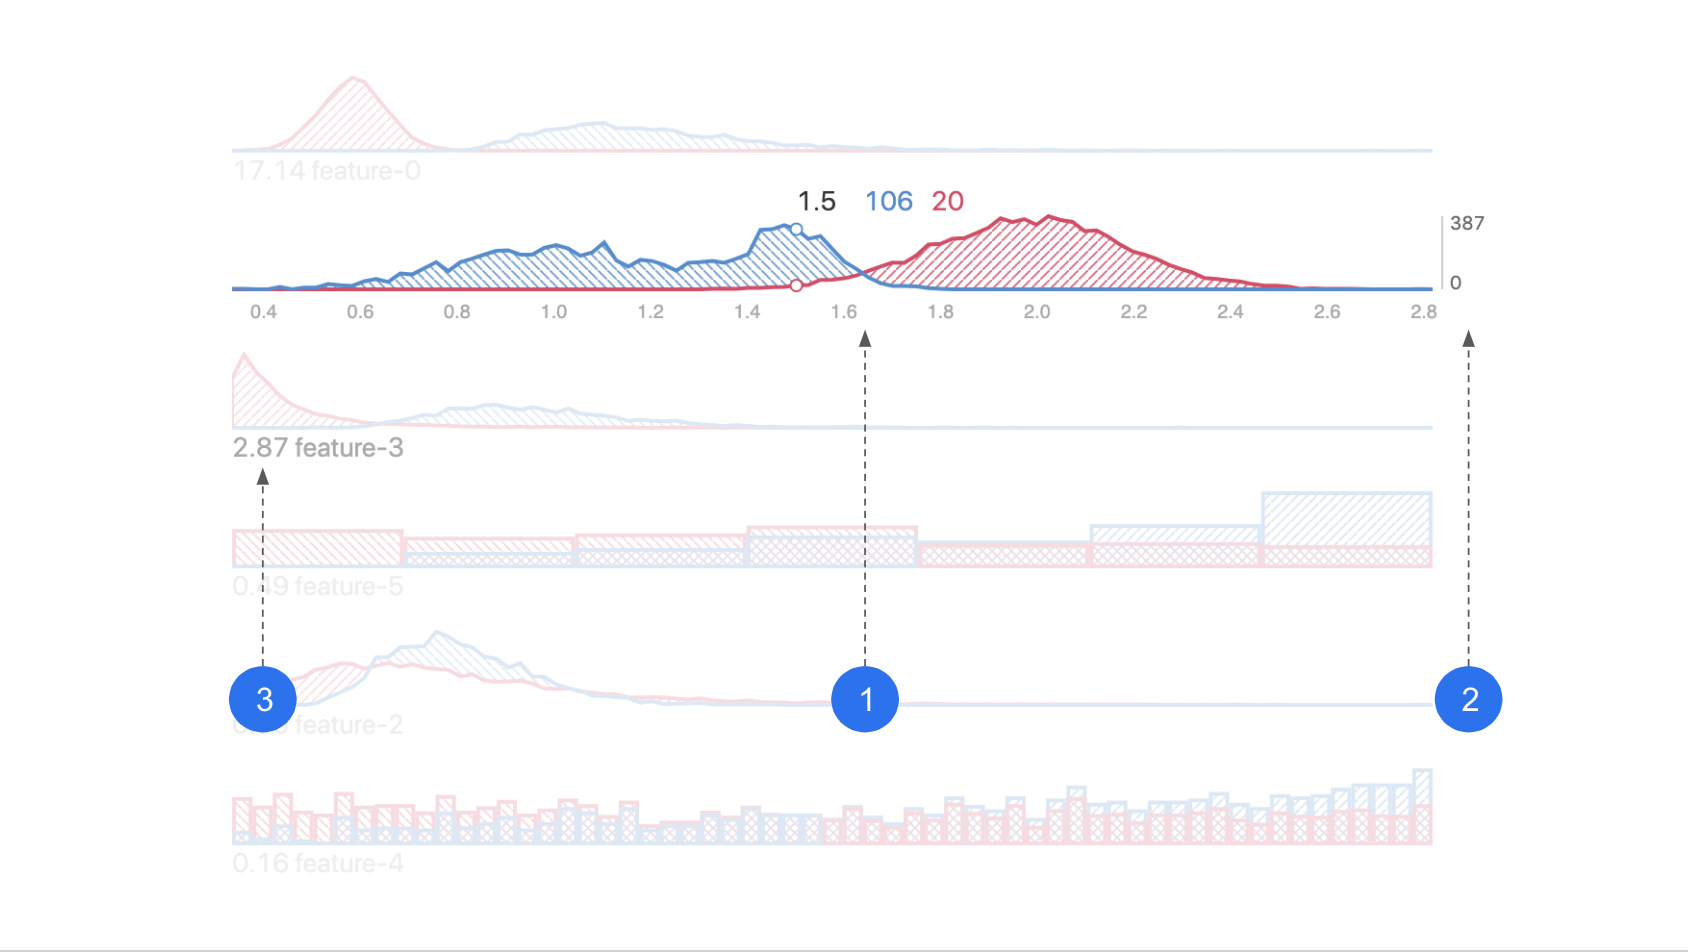
feature attribution view

  1. Histogram / heatmap: distribution of data from each data slice, shown in the corresponding color.
  2. Segment groups: indicates data slices you choose to compare against each other.
  3. Ranking: features are ranked by distribution difference between slices.

feature attribution view unit

  1. X axis: feature value.
  2. Y axis: data count/density.
  3. Divergence score: measure of difference in distributions between slices.

Explanation

After you slice the data to create segment groups, feature distribution histograms/heatmaps from the two segment groups are shown in this view.

Depending on the feature type, features can be shown as heatmaps on a map for geo features, distribution curve for numerical features, or distribution bar chart for categorical features. (In bar charts, categories on the x-axis are sorted by instance count difference. Look for differences between the two distributions in each feature.)

Features are ranked by their KL-Divergence - a measure of difference between the two contrasting distributions. The higher the divergence is, the more likely this feature is correlated with the factor that differentiates the two Segment Groups.

Usage

  • Look for the differences between the two distributions (pink and blue) in each feature. They represent the difference in data from the two segment groups you selected in the Performance Comparison View.

Example

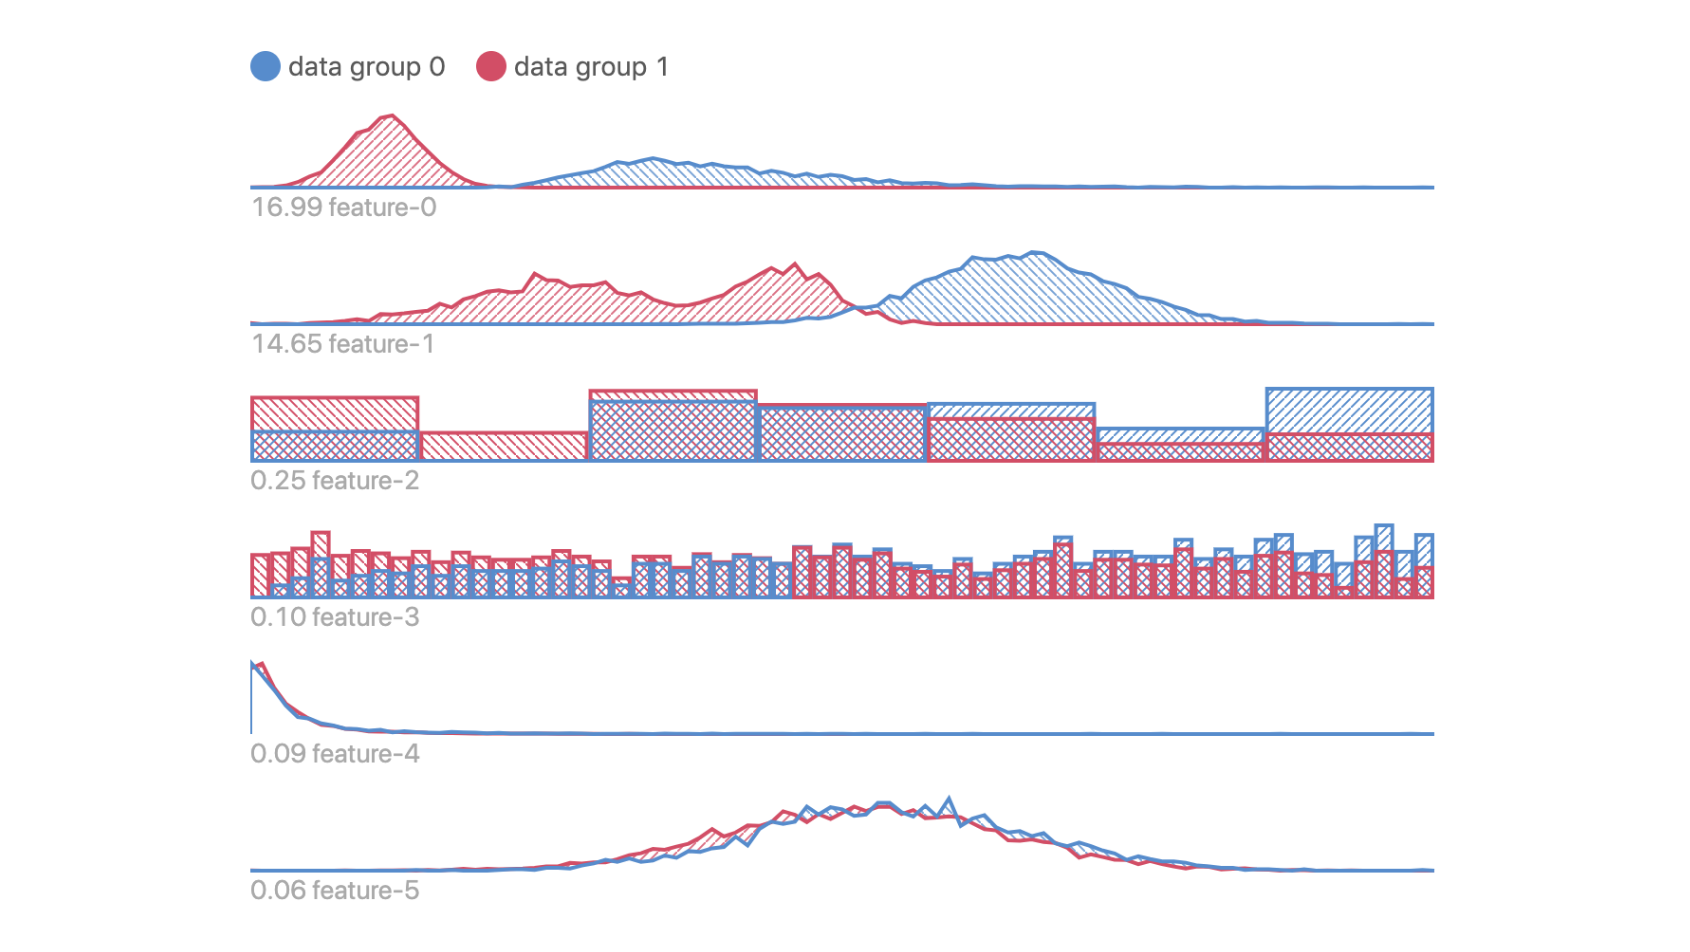
feature attribution view example

Data in Groups 0 and 1 have obvious differences in Features 0, 1, 2 and 3; but they are not so different in features 4 and 5.

Suppose Data Groups 0 and 1 correspond to data instances with low and high prediction error respectively, this means that data with higher errors tend to have lower feature values in Features 0 and 1, since peak of pink curve is to the left side of the blue curve.


Geo Feature View

If there are geospatial features in your dataset, they will be displayed on a map. Lat-lng coordinates and h3 hexagon ids are currently supoorted geo feature types.

Reading the chart

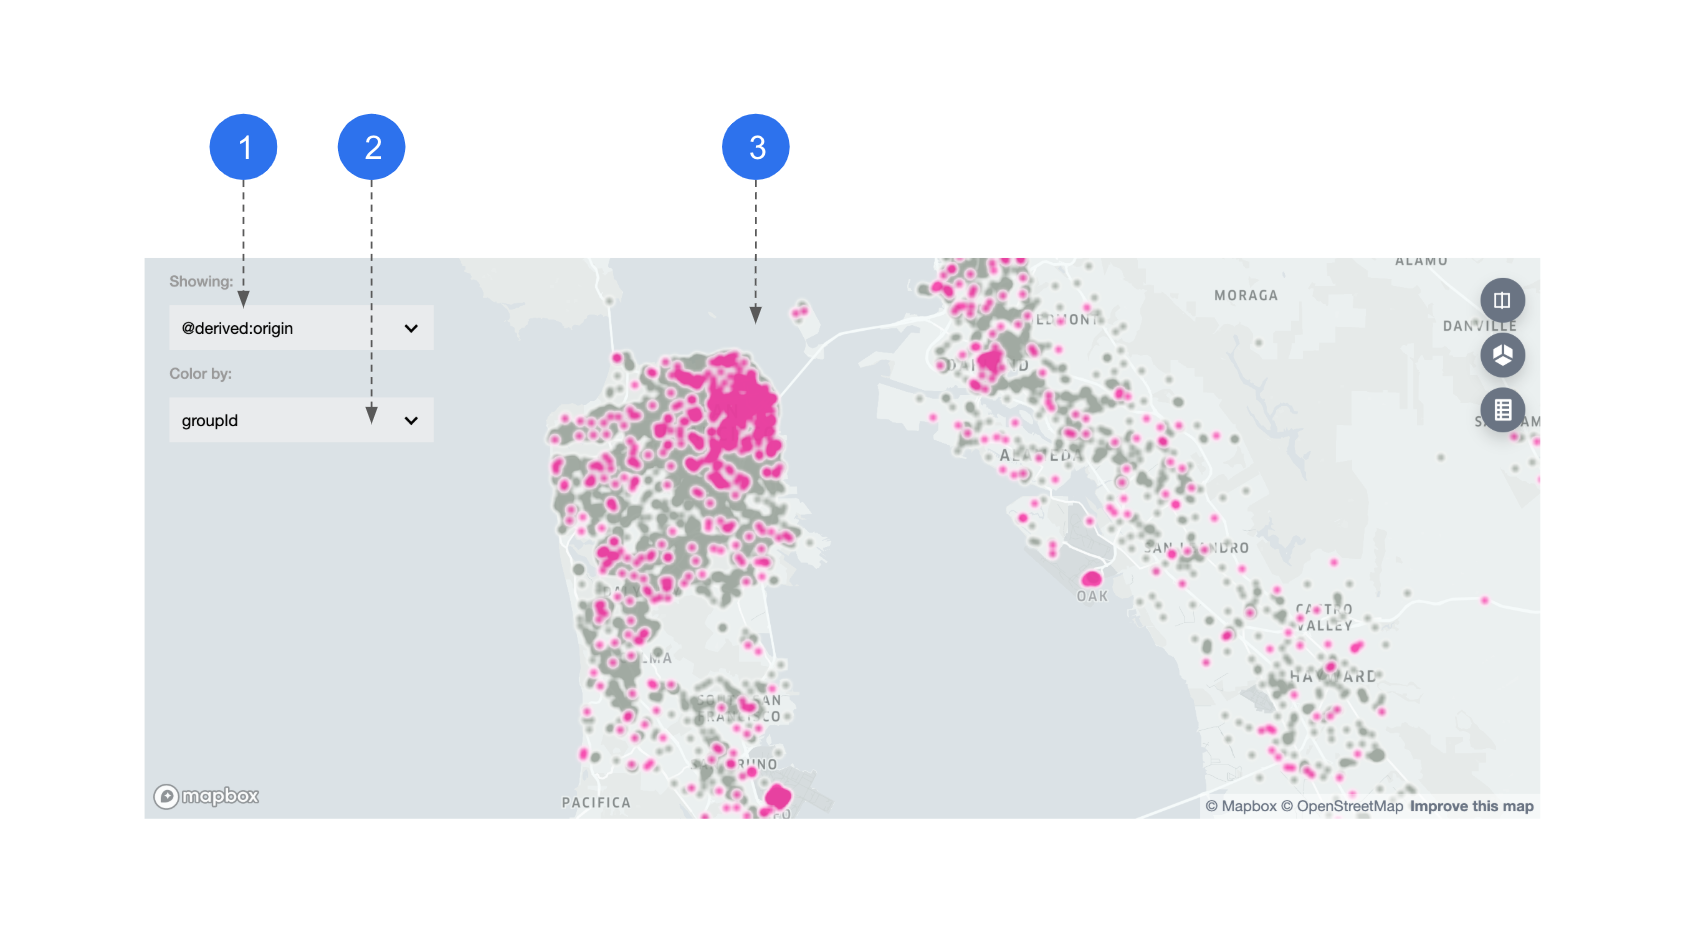
geo feature view lat-lng

  1. Feature name: when multiple geo features exist, you can choose which one to display on the map.
  2. Color-by: if a lat-lng feature is chosen, datapoints are colored by group ids.
  3. Map: Manifold defaults to display the location and density of these datapoints using a heatmap.

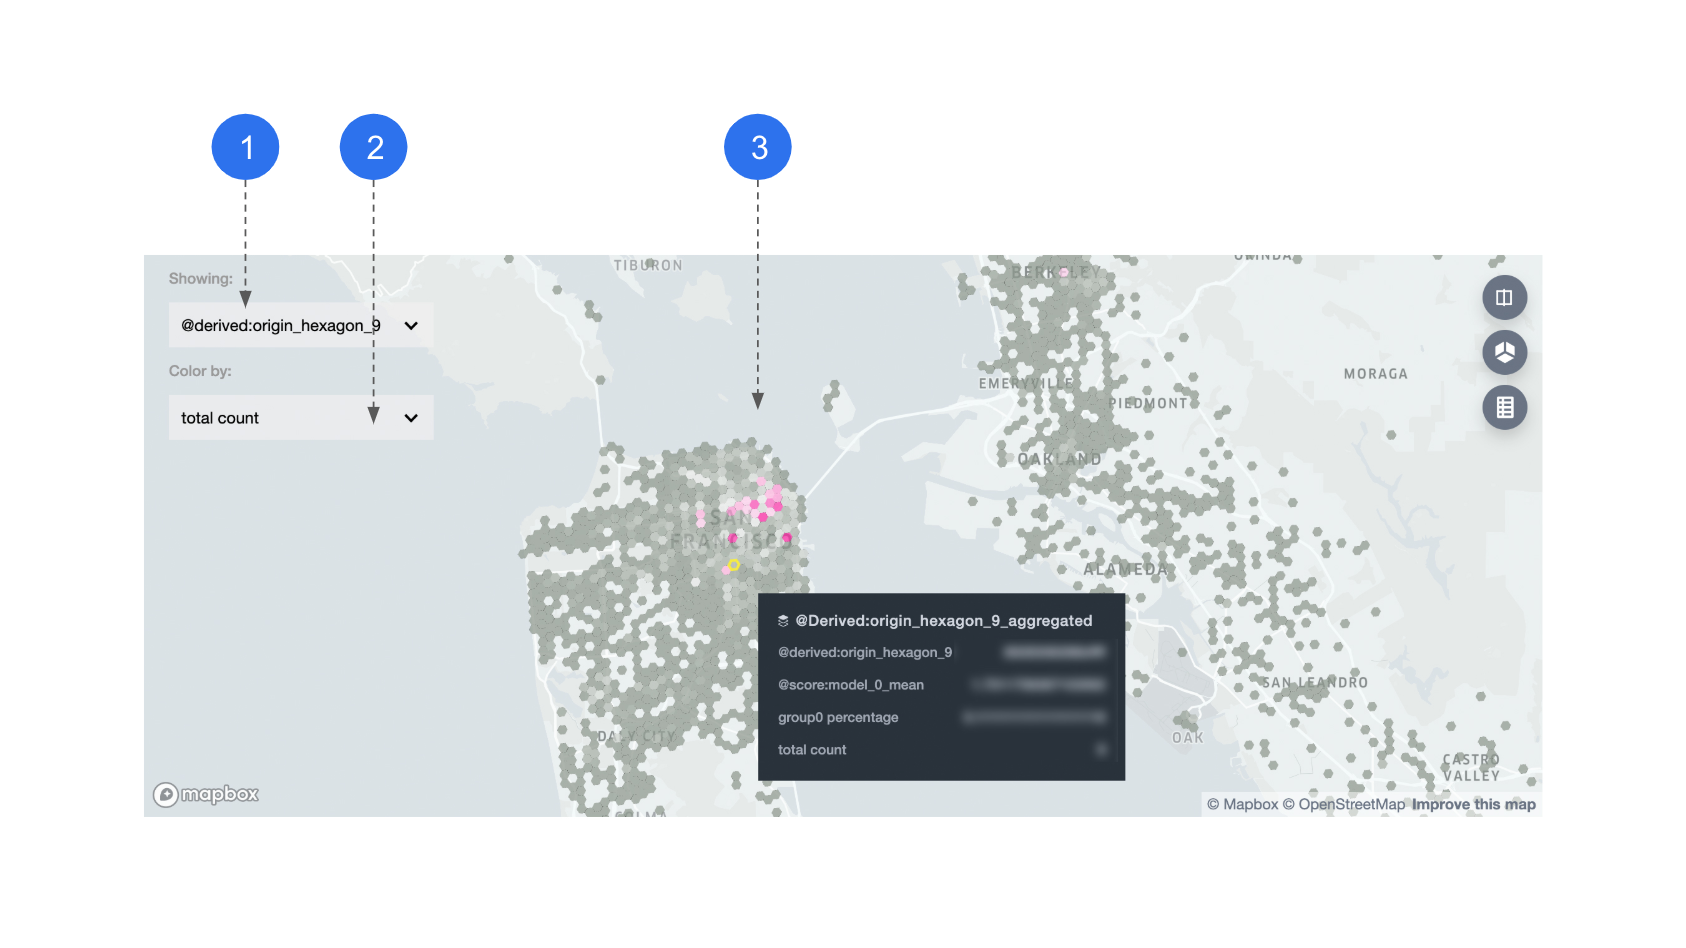
geo feature view hex id

  1. Feature name: when choosing a hex-id feature to display, datapoints with the same hex-id are displayed in aggregate.
  2. Color-by: you can color the hexagons by: average model performance, percentage of segment group 0, or total count per hexagon.
  3. Map: all metrics that are used for coloring are also shown in tooltips, on the hexagon level.

Usage

  • Look for the differences in geo location between the two segment groups (pink and grey). They represent the spation distribution difference between the two subsets you previously selected.

Example

In the first map above, Group 0 has a more obvious tendency to be concentrated in downtown San Francisco area.

Using the Demo App

To do a one-off evaluation using static outputs of your ML models, use the demo app. Otherwise, if you have a system that programmatically generates ML model outputs, you might consider using the Manifold component directly.

Running Demo App Locally

Run the following commands to set up your environment and run the demo:

# install all dependencies in the root directory
yarn
# demo app is in examples/manifold directory
cd examples/manifold
# install dependencies for the demo app
yarn
# run the app
yarn start

Now you should see the demo app running at localhost:8080.

Upload CSV to Demo App

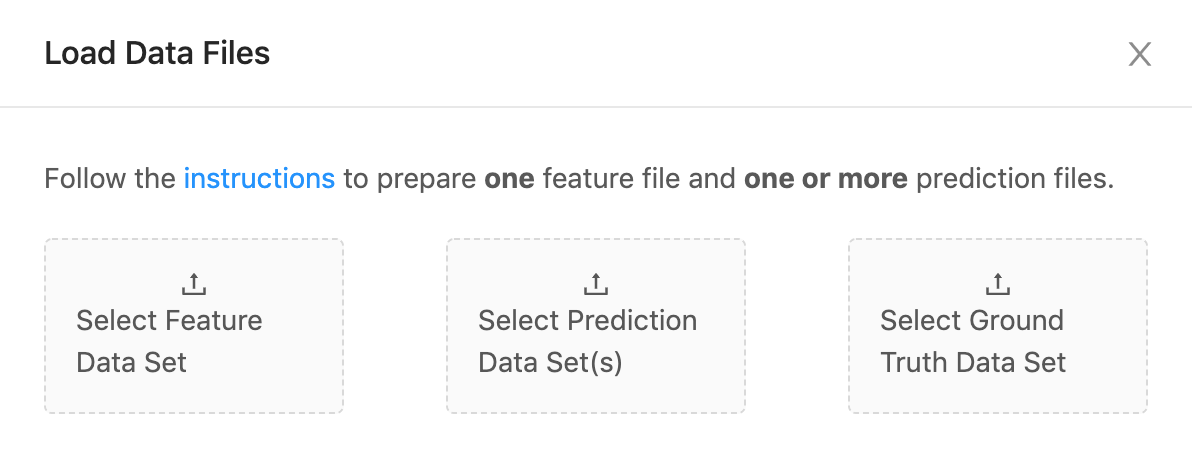
csv upload interface

Once the app starts running, you will see the interface above asking you to upload "feature", "prediction" and "ground truth" datasets to Manifold. They correspond to x, yPred, and yTrue in the "prepare your data" section, and you should prepare your CSV files accordingly, illustrated below:

Field x (feature) yPred (prediction) yTrue (ground truth)
Number of CSVs 1 multiple 1
Illustration of CSV format

Note, the index columns should be excluded from the input file(s). Once the datasets are uploaded, you will see visualizations generated by these datasets.

Using the Component

Embedding the Manifold component in your app allows you to programmatically generate ML model data and visualize. Otherwise, if you have some static output from some models and want to do a one-off evaluation, you might consider using the demo app directly.

Here are the basic steps to import Manifold into your app and load data for visualizing. You can also take a look at the examples folder.

Install Manifold

$ npm install @mlvis/manifold styled-components styletron-engine-atomic styletron-react

Load and Convert Data

In order to load your data files to Manifold, use the loadLocalData action. You could also reshape your data into the required Manifold format using dataTransformer.

import {loadLocalData} from '@mlvis/manifold/actions';

// create the following action and pass to dispatch
loadLocalData({
  fileList,
  dataTransformer,
});
fileList: {Object[]}

One or more datasets, in CSV format. Could be ones that your backend returns.

dataTransformer: {Function}

A function that transforms fileList into the Manifold input data format. Default:

const defaultDataTransformer = fileList => ({
  x: [],
  yPred: [],
  yTrue: [],
});

Mount reducer

Manifold uses Redux to manage its internal state. You need to register manifoldReducer to the main reducer of your app:

import manifoldReducer from '@mlvis/manifold/reducers';
import {combineReducers, createStore, compose} from 'redux';

const initialState = {};
const reducers = combineReducers({
  // mount manifold reducer in your app
  manifold: manifoldReducer,

  // Your other reducers here
  app: appReducer,
});

// using createStore
export default createStore(reducer, initialState);

Mount Component

If you mount manifoldReducer in another address instead of manifold in the step above, you need to specify the path to it when you mount the component with the getState prop. width and height are both needed explicitly. If you have geospatial features and need to see them on a map, you also need a mapbox token.

import Manifold from '@mlvis/manifold';
const manifoldGetState = state => state.pathTo.manifold;
const yourMapboxToken = ...;

const Main = props => (
  <Manifold
    getState={manifoldGetState}
    width={width}
    height={height}
    mapboxToken={yourMapboxToken}
  />
);

Styling

Manifold uses baseui, which uses Styletron as a styling engine. If you don't already use Styletron in other parts of your app, make sure to wrap Manifold with the styletron provider.

Manifold uses the baseui theming API. The default theme used by Manifold is exported as THEME. You can customize the styling by extending THEME and passing it as a theme prop of the Manifold component.

import Manifold, {THEME} from '@mlvis/manifold';
import {Client as Styletron} from 'styletron-engine-atomic';
import {Provider as StyletronProvider} from 'styletron-react';

const engine = new Styletron();
const myTheme = {
  ...THEME,
  colors: {
    ...THEME.colors,
    primary: '#ff0000',
  },
}

const Main = props => (
  <StyletronProvider value={engine}>
    <Manifold
      getState={manifoldGetState}
      theme={myTheme}
    />
  </StyletronProvider>
);

Built With

Contributing

Please read our code of conduct before you contribute! You can find details for submitting pull requests in the CONTRIBUTING.md file. Refer to the issue template.

Versioning

We document versions and changes in our changelog - see the CHANGELOG.md file for details.

License

Apache 2.0 License

manifold's People

Contributors

chrisirhc avatar da505819 avatar dependabot[bot] avatar firenze11 avatar geekayush avatar gnavvy avatar happyhj avatar javidhsueh avatar kenns29 avatar milosjava avatar sblotner avatar

Stargazers

 avatar  avatar  avatar  avatar  avatar  avatar  avatar  avatar  avatar  avatar  avatar  avatar  avatar  avatar  avatar  avatar  avatar  avatar  avatar  avatar  avatar  avatar  avatar  avatar  avatar  avatar  avatar  avatar  avatar  avatar  avatar  avatar  avatar  avatar  avatar  avatar  avatar  avatar  avatar  avatar  avatar  avatar  avatar  avatar  avatar  avatar  avatar  avatar  avatar  avatar  avatar  avatar  avatar  avatar  avatar  avatar  avatar  avatar  avatar  avatar  avatar  avatar  avatar  avatar  avatar  avatar  avatar  avatar  avatar  avatar  avatar  avatar  avatar  avatar  avatar  avatar  avatar  avatar  avatar  avatar  avatar  avatar  avatar  avatar  avatar  avatar  avatar  avatar  avatar  avatar  avatar  avatar  avatar  avatar  avatar  avatar  avatar  avatar  avatar  avatar

Watchers

 avatar  avatar  avatar  avatar  avatar  avatar  avatar  avatar  avatar  avatar  avatar  avatar  avatar  avatar  avatar  avatar  avatar  avatar  avatar  avatar  avatar  avatar  avatar  avatar  avatar  avatar  avatar  avatar  avatar  avatar  avatar  avatar  avatar  avatar  avatar  avatar  avatar  avatar  avatar  avatar  avatar  avatar  avatar  avatar  avatar  avatar  avatar  avatar  avatar  avatar  avatar  avatar

manifold's Issues

Unauthorized to get package from internal uber domain. (Demo App)

Hello everybody, i just tried to get the demo app running, but sadly can't get all the packages installed.

When running the yarn command in the examples/manifold folder, i receive the following error message:
An unexpected error occurred: "https://unpm.uberinternal.com/react-is/-/react-is-16.9.0.tgz: Request failed \"401 Unauthorized\"".

EDIT: When installing react-is externally, the next same error is for gud. It seems, like yarn tries to find the packages in uberinternal, no matter which.

Error on startup of example - Unknown option: base.rootMode

Summary

After following the code snippet, how to locally start the example, an error is thrown and the website remains blank.

Expected Behavior

Example website pops up.

Current Behavior

Upon startup an error message is thrown

`$ npm run start

@ start /Users/jh186076/Documents/03_Privat/manifold/examples/manifold
webpack-dev-server --progress --hot --open

10% building 1/1 modules 0 activeℹ 「wds」: Project is running at http://localhost:8080/
ℹ 「wds」: webpack output is served from /
ℹ 「wds」: Content not from webpack is served from /Users/jh186076/Documents/03_Privat/manifold/examples/manifold
40% building 15/16 modules 1 active /Users/jh186076/Documents/03_Privat/manifold/examples/manifold/node_modules/events/events.jsℹ 「wdm」: wait until bundle finished: /
✖ 「wdm」: Hash: d8e9b3efe73932330b3a
Version: webpack 4.41.2
Time: 1141ms
Built at: 01/13/2020 9:47:44 AM
Asset Size Chunks Chunk Names
app.js 377 KiB app [emitted] app
app.js.map 427 KiB app [emitted] [dev] app
index.html 184 bytes [emitted]
Entrypoint app = app.js app.js.map
[0] multi (webpack)-dev-server/client?http://localhost:8080 (webpack)/hot/dev-server.js ./src/main.js 52 bytes {app} [built]
[./node_modules/strip-ansi/index.js] 161 bytes {app} [built]
[./node_modules/webpack-dev-server/client/index.js?http://localhost:8080] (webpack)-dev-server/client?http://localhost:8080 4.29 KiB {app} [built]
[./node_modules/webpack-dev-server/client/overlay.js] (webpack)-dev-server/client/overlay.js 3.51 KiB {app} [built]
[./node_modules/webpack-dev-server/client/socket.js] (webpack)-dev-server/client/socket.js 1.53 KiB {app} [built]
[./node_modules/webpack-dev-server/client/utils/createSocketUrl.js] (webpack)-dev-server/client/utils/createSocketUrl.js 2.89 KiB {app} [built]
[./node_modules/webpack-dev-server/client/utils/log.js] (webpack)-dev-server/client/utils/log.js 964 bytes {app} [built]
[./node_modules/webpack-dev-server/client/utils/reloadApp.js] (webpack)-dev-server/client/utils/reloadApp.js 1.59 KiB {app} [built]
[./node_modules/webpack-dev-server/client/utils/sendMessage.js] (webpack)-dev-server/client/utils/sendMessage.js 402 bytes {app} [built]
[./node_modules/webpack/hot sync ^./log$] (webpack)/hot sync nonrecursive ^./log$ 170 bytes {app} [built]
[./node_modules/webpack/hot/dev-server.js] (webpack)/hot/dev-server.js 1.59 KiB {app} [built]
[./node_modules/webpack/hot/emitter.js] (webpack)/hot/emitter.js 75 bytes {app} [built]
[./node_modules/webpack/hot/log-apply-result.js] (webpack)/hot/log-apply-result.js 1.27 KiB {app} [built]
[./node_modules/webpack/hot/log.js] (webpack)/hot/log.js 1.34 KiB {app} [built]
[./src/main.js] 1.85 KiB {app} [built] [failed] [1 error]
+ 20 hidden modules

WARNING in EnvironmentPlugin - MAPBOX_ACCESS_TOKEN environment variable is undefined.

You can pass an object with default values to suppress this warning.
See https://webpack.js.org/plugins/environment-plugin for example.

ERROR in ./src/main.js
Module build failed (from ./node_modules/babel-loader/lib/index.js):
ReferenceError: [BABEL] /Users/jh186076/Documents/03_Privat/manifold/examples/manifold/src/main.js: Unknown option: base.rootMode. Check out http://babeljs.io/docs/usage/options/ for more information about options.

A common cause of this error is the presence of a configuration options object without the corresponding preset name. Example:

Invalid:
{ presets: [{option: value}] }
Valid:
{ presets: [['presetName', {option: value}]] }

For more detailed information on preset configuration, please see https://babeljs.io/docs/en/plugins#pluginpresets-options.
at Logger.error (/Users/jh186076/Documents/03_Privat/manifold/examples/manifold/node_modules/babel-core/lib/transformation/file/logger.js:41:11)
at OptionManager.mergeOptions (/Users/jh186076/Documents/03_Privat/manifold/examples/manifold/node_modules/babel-core/lib/transformation/file/options/option-manager.js:226:20)
at OptionManager.init (/Users/jh186076/Documents/03_Privat/manifold/examples/manifold/node_modules/babel-core/lib/transformation/file/options/option-manager.js:368:12)
at File.initOptions (/Users/jh186076/Documents/03_Privat/manifold/examples/manifold/node_modules/babel-core/lib/transformation/file/index.js:212:65)
at new File (/Users/jh186076/Documents/03_Privat/manifold/examples/manifold/node_modules/babel-core/lib/transformation/file/index.js:135:24)
at Pipeline.transform (/Users/jh186076/Documents/03_Privat/manifold/examples/manifold/node_modules/babel-core/lib/transformation/pipeline.js:46:16)
at transpile (/Users/jh186076/Documents/03_Privat/manifold/examples/manifold/node_modules/babel-loader/lib/index.js:50:20)
at Object.module.exports (/Users/jh186076/Documents/03_Privat/manifold/examples/manifold/node_modules/babel-loader/lib/index.js:173:20)
Child html-webpack-plugin for "index.html":
1 asset
Entrypoint undefined = index.html
[./node_modules/html-webpack-plugin/lib/loader.js!./node_modules/html-webpack-plugin/default_index.ejs] 376 bytes {0} [built]
[./node_modules/lodash/lodash.js] 528 KiB {0} [built]
[./node_modules/webpack/buildin/global.js] (webpack)/buildin/global.js 472 bytes {0} [built]
[./node_modules/webpack/buildin/module.js] (webpack)/buildin/module.js 497 bytes {0} [built]
ℹ 「wdm」: Failed to compile.
`

Context and Environment

npm version 6.13.4
node v12.14.1

Steps to Reproduce

yarn
cd examples/manifold
yarn
npm run start

Styletron engine doesn't need to be initiated again if embedded app is using styletron already

Summary

In app where styletron is already used, the styletron engine within manifold component will conflict with the engine outside.

Current Behavior

E.g. if the app uses server side rendering, it will conflict with the engine within manifold which uses client side rendering

ReferenceError: document is not defined
    at new StyletronClient (/Users/agreco/dev/michelangelo-web-fresh/node_modules/styletron-engine-atomic/dist/index.js:660:7)
    at Object. (/Users/agreco/dev/michelangelo-web-fresh/node_modules/@mlvis/src/components/manifold.js:35:16)

Possible Solution

Remove styletron engine from within manifold; ask users to use styletron provider separately.

Simplify Contributor Onloading With Gitpod

Summary

I have a hard time contributing to big projects I am a student who uses a chromebook all day which just doesn't have the power I need. With Gitpod people with lower end computers can contribute easily without waiting for builds or having to deal with setting up a Development Environment to contribute.

Expected Behavior

  1. User clicks open in gitpod button from README
  2. Start Coding

Current Behavior

  1. Read build instructions
  2. Install node and yarn
  3. Debug any issues you find doing that
  4. Clone Repo
  5. Install dependencies and wait for that to finish
  6. Code

Context and Environment

  • Module & version: [e.g. @mlvis/stacked-calendar, v1.0.0]

Steps to Reproduce

Open in Gitpod

Possible Solution

Gitpod
#100
Open in Gitpod

Configure ocular to build only the esm bundle

ocular-build builds three bundles by default: es5/, es6/ and esm/. This structure disables importing subfolders of each module. Currently, the es5/ and es6/ bundles are not used at all, so it may be better to configure ocular to only build the esm/ bundle. This way, tree-shaking is enabled, so is the subfolder import, both of them have merits on reducing the bundle size, not mentioning the saved build time by only building one bundle. This can be done by either modifying ocular or by simply adding some build script in each package.json to overwrite the default ocular build behavior. @ibgreen may have an idea on how to do it.


pull request (uber-web/ocular#251)
pull request (#56)

Manifold in different cells will overwrite each other inside the Jupyter binding

In Jupyter binding, when there are multiple Manifold instance running inside different cells, change of one Manifold instance in one cell will change the Manifold instances in the other cells.

Note: this behavior is not related to ipywidget as the bug only occurs to cells with Manifold. This is likely related to the reducer settings of the Manifold.

Expected Behavior:

image

image

Current Behavior when the first cell was run after the second:

image

Addressed by #45

Visualization improvement for heatmaps in geo-spatial features

Currently we have 2 ways to show numerical values over spatially distributed data:

  1. Overlapping heatmaps, used for displaying two data slices on a map:

geo feature view lat-lng

  1. Hexagon binned heatmaps, used for displaying spatially aggregated 1-Dimensional data (e.g. values of one feature):

geo feature view hex id

The drawbacks are:

  1. Overlapping heapmaps might occlude information
  2. It's hard to show multiple dimensions at the same time

We need to invent new visual encodings to fix it.

Migrate the engdoc website to a public domain

The doc website needs to be public now since our codebase has been migrated to the OSS repo. It is also necessary to move all the website code from the internal repo to the OSS one so it can be maintained here.

Docker image

Is it possible to get a docker image with manifold?

Summary

not very familiar with yarn and getting errors on build. Docker will help a lot!

Expected Behavior

Docker run uber/manifold and voila :-)

Possible Solution

alternatively, I can build and share one, just having temporary troubles with yarn install 😬

Migrate Jupyter Bindings into the github repo

Migrate the current Jupyter Binding from the internal repo to the public one. The bindings code should stay together with the modules to minimize maintenance overhead. This migration should also include stacked-calendar and graph-builder module because the current version of Jupyter binding contains these two modules.

accept null values in input data

if there are null or undefined values in input data, current behavior is to remove the feature from the list. Desired behavior is:

  • create a NA category for categorical features
  • fill values using median (or other desired values) for numerical features

CI / dev experience remaining issues

  • add readme to npm homepage https://www.npmjs.com/package/@mlvis/manifold
  • add publishing script to Travis CI
  • auto bump version in the main package.json (currently ocular-publish only bumps versions in modules package.json
  • install storybook for development purpose
  • properly structure published module (below is the current structure, which causes import Manifold from '@mlvis/manifold' to not work #27
    image
  • add depcheck
  • use gh-pages module to deploy website

Improve data validation experience

Summary

Several users have reported (#103, #108) that no results were shown after uploading CSV files, possibly due to format/column mismatch.

Expected Behavior

Users should be able to get detailed warning/error messages if data validation has failed.

Current Behavior

Nothing being rendered and no actionable message is surfaced for the cause of the format mismatch.

Possible Solution

  1. As an MVP, output (e.g. console.log) if there are any expected columns missing.
  2. A wizard to guide the data column mapping and validation.

Jupyter notebook - Export Segmentation not working

I am running Manifold from Jupyter notebook on Chrome browser.

Clicking on "Export Segmentation" button in the output widget outputs a list with the indexes of the input data. Is is possible to obtain the segment number. For example, Segment_1 or Segment_2 along with the index.

Unable to see any outputs in Jupyter Notebook

I've installed the mlvis extension and followed the steps installing the nbextension and then enabling it.

When following the manifold example notebook (https://github.com/uber/manifold/blob/master/bindings/jupyter/notebooks/manifold.ipynb) and running the first cell I get the output:

Manifold(props='{"data": {"x": [{"feature_0": 318, "feature_1": "A"}, {"feature_0": 213, "feature_1": "B"}, {"…

And no visual output. Is there a step that I need to change to get the notebook visual output working?

I've even tried disabling the other extensions to see whether it would work and no change.

I'm running jupyter version 1.0.

Major release branches

Taking inspiration from deck.gl, we need to have some major release branches, e.g.
image

This is necessary for us to maintain those releases. Because we also have a major Jupyter binding, we can have two lines releases for the major packages and the Python libraries.

release-1.0.0 
...
release-jupyter-0.1.0
...

Patches to these releases use the minor version number, e.g.

release-1.0.1
release-jupyter-0.1.1

Enable the usage of Manifold with unspecified yTrue (ground truth) parameter.

Some DS use manifold mainly as a feature segmentation and comparison tool. In that case, they don't necessarily need a ground-truth data and they demand the ability to use Manifold without having to specify the yTrue variable due to the difficulty of obtaining these ground truth data. Considering this use case, it is useful to enable an option to use Manifold without having to specify the yTrue variable, even though this option will make some of the model evaluation functionalities unavailable.

other metrics

is it possible to add other metrics (e.g. I need MAPE)?
I obviously can pre-generate those, but it would be nice to have those as part of the app

Jupyter Binding: Dynamically Load React Component

The Jupyter binding should enable dynamic loading of React component. This will allow the users to install custom React components into the mlvis library. This will also help to reduce the amount of boilerplate in the code.

A planned implementation would leverage a config file called "jrequirements.json" which is shared by both the Python and JS code. This file will specify the Python wrapper name and the corresponding JS module and widget customizations, along with other functionalities. These specifications will be used to dynamically generate the corresponding Python and JS code.


Dynamically generate widget frontend (#47)
Mockup ext code for JS component widget extension (#48)
Correctly handle jrequirements.json in Python (#49)

Clustering on one model's performance doesn't work as expected

Steps to Reproduce

  • remove "@score:model_1" from "Cluster by" selection box
  • reduce "Number of clusters" from 4 to 3
    image

Expected Behavior

Expect to see the clear-cut separation of green curves wrt their positions along X axis in the "Performance Comparison" chart

Current Behavior

Green curves are overlapping with each other wrt their positions along X axis in the "Performance Comparison" chart

Context and Environment

  • Module & version: [e.g. @mlvis/manifold, v1.1.1]

Possible Solution

Flexible data slicing logic

problem

Currently the following logic is hardcoded in Manifold:

  • when choosing auto segmentation, user can choose comparison metric, but when choosing manual segmentation, they can't. The value will be whatever is set when they're in auto mode

- when choosing manual segmentation, user can only select feature columns, but not prediction columns

- comparison metric cannot be flexibly defined.

Because of this, the following use cases cannot be easily implemented:

Use cases

Real-world usage this improvement will support include (from customer interview):

  1. Highlight direction of errors
  2. Identify really badly-performing data points (outliers) for inspection

Solutions

Use case 1 can be implemented by setting performance metrics to indicate over/under prediction (instead of absolute prediction error), and allow users to manually segment data based on this metric column (i.e. set segmentation threshold to 0).

Use case 2 can be implemented by allowing users to manually segment data based on this metric column (i.e. set segmentation threshold to some really high value so that only a few datapoints are in group 0).

To enable these, we need to make the following fields in state independent knobs (instead of hard-coding the value of one field base on the value of another), and then hook each of them to UI controls:

  • isManualSegmentation: whether to apply manual (filter-based) or automatic (kmeans) data slicing
  • baseCols: use which columns to slice (either through creating filters for these columns, or through inputting them to kmeans clustering)
  • nClusters: number of clusters to use in automatic slicing (only applicable to automatic slicing)
  • segmentFilters: filter logic corresponding to data segment (only applicable to manual slicing)
  • segmentGroups: which segments to group together for comparing against each other

Milestone

To validate the success of the change, we will evaluate how the 2 user tasks in the "Use cases" section can be achieved.

Appendix

A complete list of variables in the slicing logic

A complete list of variables in the slicing logic

  • Ways to define “performance column”
  • Column type to segment on
    • Feature column
    • Performance column
    • Prediction column
    • Create a new column (e.g. Delta between 2 performance column)
  • Data segmentation strategies:
    • Auto segmentation (through k-means)
    • Manual segmentation (through defining filter values)
  • Number of columns to segment on
    • Single column
    • Multiple column

Items in 1, 2, 3, 4 are independent, e.g you can have 1a + 2a + 3a + 4a, or 1a + 2b + 3a + 4b, based on specific needs.

Code structure

Code structure

Data slicing is only part of the logic in the application. Conceptually, the functionalities of the application will be structured into the following components (we do not actively work on the refactoring; restructuring will be done piecemeal to prioritize functionalities.)

  • Data generation: updating performance metric, compute performance score, compute delta between 2 performance columns etc. These actions will cause changes in data field.
  • Data slicing: toggling auto/manual data slicing, choosing base columns to slice, configuring segmentation filters etc. These actions won't cause changes in data field but will change data subsets
  • Visualization configuration: changing which feature column to color by etc. These actions won't change data slices, but will cause display changes.

Regression model, no result

Summary

I used Jupyter notebook and did the Manifold example without any problem. But when I try with the regression model, it doesn't show any result. I couldn't find any regression model example of this.

Expected Behavior

Works just like classification model

Current Behavior

Manifold doesn't return result for Regression model. even no error raised

Possible Solution

Any regression model example

Use Monorepo Structure

Manifold repo needs to be converted to monorepo structure and CI tools have to be updated to facilitate development and team collaborations. The goal is to migrate the codes from the internal repo to this github repo and slowly deprecate the internal repo.

Add integration test for computation

Right now only unit tests for each functions are in place. It would be ideal to add integration tests considering the signature of individual functions might change during the development process.

Regression model in python, error

I am trying to use Manifold in jupyter notebook. My dataset consists of features, ground truth and predictions for 1 model. CSV files are attached. I get the following error -

yTrue must be a list/ndarray.

I am able to get the results with the demo app.
TestData_Results.zip

Configure ocular to build modules in deeper level subfolders.

ocular-build seems to only work for modules in the immediate subfolder, e.g. modules/ in the current monorepo. However, it doesn't seem to build modules within deeper level subfolders, e.g. bindings/jupyter-modules, as shown in this PR (#25). Currently, modules within jupyter-modules seem to only use lerna run build instead. This behavior introduces some inconsistencies between modules inside the jupyter-modules/ folder and the modules inside the modules/ folder. Either ocular has to be changed to allow building modules within deeper level subfolders or jupyter-modules/ have to be moved to the root level to accommodate the current ocular-build behavior. @ibgreen may have an idea on which is a better way to do this.


Pull Request (uber-web/ocular#261)

Export feature distribution differences

It would be useful to export the feature attribution view data to record the feature differences discovered based on some performance slicing criteria, for future usage

Add Google analytics to the website

Add Google analytics to the website to track our user activity.

Summary

To understand the user activity on our website, we will need to add GA to our website and observe the user usage and activities.

Expected Behavior

We should be able to get the google analytics result.

Current Behavior

No GA available.

Possible Solution

Inject the GA code in the header of the website.

Migrate to Baseui

Currently, within Manifold package we are using styled-components to do custom styling; it becomes complicated for advanced UI widgets (e.g. select with searching functionalities) and hinders development speed.

Pros:

  • Using standard UI widget will shorten the development time of UI part and ensures we focus on visualization part
  • Helps the project to scale in the long run -- developers who are familiar with Baseui can easily jump in
  • Aligns with other Uber UI product

Cons:

  • Need to refactor in the short term
  • Not good for package size -- Baseui is using styletron as engine; Kepler.gl is using styled-components, and if we switch, Manifold will be depending on both (it seems not hard for Baseui to support styled-components, but it's depriotized https://github.com/uber-web/baseui/issues/114)

Middle-ground solution: we could keep styled-components for e.g. styling divs and only use Baseui for UI widgets for now, so that the refactoring work will not involve refactoring styled-component css-like strings to styletron objects:

// styled-components
const Centered = styled.div`
  display: flex;
  justify-content: center;
`;
// styletron
const Centered = styled('div', {
  display: 'flex',
  justifyContent: 'center',
});

Failed to skip private modules during publishing

Summary / Current Behavior

The publish script is throwing ERR instead of bypassing private modules as expected.

npm ERR! This package has been marked as private
npm ERR! Remove the 'private' field from the package.json to publish it.

npm ERR! A complete log of this run can be found in:
npm ERR!     /Users/gnavvy/.npm/_logs/2020-01-10T19_31_04_771Z-debug.log
npm ERR! code ELIFECYCLE
npm ERR! errno 1
npm ERR! [email protected] lerna:publish: `lerna exec cp package.json dist && lerna exec npm publish dist`
npm ERR! Exit status 1
npm ERR!
npm ERR! Failed at the [email protected] lerna:publish script.
npm ERR! This is probably not a problem with npm. There is likely additional logging output above.

npm ERR! A complete log of this run can be found in:
npm ERR!     /Users/gnavvy/.npm/_logs/2020-01-10T19_31_04_804Z-debug.log
error Command failed with exit code 1.

Expected Behavior

Modules marked as private should be skipped during publishing.

Context and Environment

We currently have a few and will keep adding experimental modules into this repo. It is desired to exclude them from being published to NPM in early development. One viable solution is to use the "private": true flag in the module's package.json (example) to bypass the publish step, but this breaks npm publish.

Steps to Reproduce

To reproduce, run the script in the following order

npm run build
npm run publish

Possible Solution

Explicitly adding the --no-private flag after lerna exec during publish bypasses npm publish inside the private modules.

Use async for data computation

Current implementation involves converting tensor data between array and tf.Tensor format through synchronized data reading, which blocks the UI thread until the values are ready, which can cause performance issues. Migrate to async instead.

Recommend Projects

  • React photo React

    A declarative, efficient, and flexible JavaScript library for building user interfaces.

  • Vue.js photo Vue.js

    🖖 Vue.js is a progressive, incrementally-adoptable JavaScript framework for building UI on the web.

  • Typescript photo Typescript

    TypeScript is a superset of JavaScript that compiles to clean JavaScript output.

  • TensorFlow photo TensorFlow

    An Open Source Machine Learning Framework for Everyone

  • Django photo Django

    The Web framework for perfectionists with deadlines.

  • D3 photo D3

    Bring data to life with SVG, Canvas and HTML. 📊📈🎉

Recommend Topics

  • javascript

    JavaScript (JS) is a lightweight interpreted programming language with first-class functions.

  • web

    Some thing interesting about web. New door for the world.

  • server

    A server is a program made to process requests and deliver data to clients.

  • Machine learning

    Machine learning is a way of modeling and interpreting data that allows a piece of software to respond intelligently.

  • Game

    Some thing interesting about game, make everyone happy.

Recommend Org

  • Facebook photo Facebook

    We are working to build community through open source technology. NB: members must have two-factor auth.

  • Microsoft photo Microsoft

    Open source projects and samples from Microsoft.

  • Google photo Google

    Google ❤️ Open Source for everyone.

  • D3 photo D3

    Data-Driven Documents codes.