wikimedia / wikicontrib Goto Github PK
View Code? Open in Web Editor NEWA tool for Wikimedia community members to visualize their technical contributions
Home Page: https://wikicontrib.toolforge.org
License: MIT License
A tool for Wikimedia community members to visualize their technical contributions
Home Page: https://wikicontrib.toolforge.org
License: MIT License
If you click on a green square box in the "TOTAL CONTRIBUTIONS" section, you get "user has no activity on this day" message. But, if you click on the box that corresponds to the following date, it works (see screenshot below).

Note: This task is reserved for Google Code-in students. Please do not claim this task.
Upon focusing the inputs, there are blue borders being appeared.

This is not the fault of the tool, as far as I know, it is nature of the web browser. I can reproduce this in chrome and brave. But I could not see it in firefox.
I haven't tested it with safari (But I guess safari also show the borders).
The border appears weird with the current UI and it does not appear in all the browsers. So, I guess removing them will be better option...
For reference: https://medium.com/@ricardozea/how-to-remove-the-blue-border-outline-in-chrome-safari-and-dotted-line-in-firefox-edge-fe5e2155d44c
Hi!
I'm trying to implement some functions in the activity.js of the Frontend part (this file). I need to make use of the Node.js File System Module, but when I test the changes, I get the TypeError fs.readFileSync is not a function.
The simplify code:
myFunction= (variable) => {
    var fs = require('fs');
    if (variable == "this") {
      var path = "file.svg";
      var contents = fs.readFileSync(path, "utf8");
      return contents.toString();
    } else {
      return "Hi!";
    }
  };
Thanks in advance.
Is it possible to create a docker config to run the application locally along with elastic search, caching service etc?
cc @tuxology

NOTE: This task is reserved for Google Code-in students. Please do not claim this task.
Change the following error message in the code "Please provide the data regarding users." to "To visualize contributions, please provide user(s) information above." If you try to search for a user without providing any information in the input field, you get this error.

While setting up the frontend dev environment, here is the error I ran into:

I think this is happening because the app is loading the modules for the condition when the production variable is true, even though the production variable value in index.js is set as false. This might be due to the fact the build process is completed much before the production variable gets its value.
If I provide my full name and Gerrit username and leave the Phabricator field empty, my gerrit contributions are not shown in the "Total Contributions" graph, but the Gerrit graph says that there are two contributions. Maybe the problem here is different.
I wonder how the calculations are being calculated. If I look at my Gerrit commits from September 2018, there is only one merged commit made via srishakatux and another one with SrishtiSethi account:
https://gerrit.wikimedia.org/r/#/q/owner:Srishakatux+status:merged
https://gerrit.wikimedia.org/r/#/q/owner:SrishtiSethi+status:merged.

The tool looks really great! I have a small suggestion. On the activity page, the y-axis values on the graphs should be integer only because showing the fractional values does not make sense over here. Perhaps, you can use something like:
https://github.com/WikipediaLibrary/hashtags/blob/master/hashtagsv2/hashtags/static/js/graph.js#L33
There might also be other ways of doing this :)
Note: This task is reserved for Google Code-in students. Please do not claim this task.
Steps to Reproduce:

Hint: This would likely require minor code changes in the frontend/WikiContrib-Frontend/src/result.js file.
Is it possible to use travis-ci to build, version and deploy to heroku? It would be much easier to see config and builds.
cc @tuxology
In the current project an external variable named production is used to distinguish between production and development environments. It has to be set manually. But there is a environment variable named process.env.NODE_ENV which can be used to distinguish between development and production. So replace production variable with process.env.NODE_ENV. Refer #33 for more information
The process to set up environment variables might be a nice addition to the backend installation guide. One might get stuck on the migration step if they don't know where and how to set them.
Some links like
https://github.com/rammanoj/WikiContrib/blob/master/backend/Contraband/Install.md needs to be changed as this repo is under Wikimedia account now :)
Currently, there is no way to rename the tool in Wikimedia Toolforge. This might sound painful, but to host the tool here: https://tools.wmflabs.org/wikicontrib/, the entire process followed to here https://tools.wmflabs.org/contrabandapp/ would need to be repeated.
Dropdown filter is working fine for all dates but not "September 2019". It is the first one in the list, and I am not able to select it.

Note: This task is reserved for Google Code-in students. Please do not claim this task.
On clicking the User activity on a specific date, the list of tasks on that specific date are being displayed.
Example:
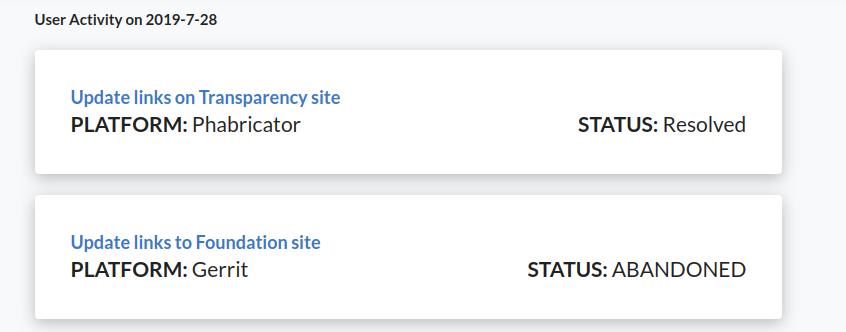
I guess the design need to be updated, maybe an icon can be added for each of them alike:

The icon signifies the platform of the commit.
The icon can have the following properties:
However it is open for new ideas :)
Hi!
In issue #101 Can't use FS functions, the given solution is to execute that fs-dependent function in server-side instead of client-side. How can I do that?
One enhancement worth having could be to not display/hide the Gerrit statistics graph when Gerrit username is not specified in the query. Same could be done for phabricator stats.
There is no point making a search when a user omits both "Phabricator username" and "Gerrit Username" fields. We should probably display a message "At least one field is required" or anything similar to that.
NOTE: This task is reserved for Google Code-in students. Please do not claim this task.
WikiContrib tool currently does not show user contributions made to any Wikimedia project on Github. But, on the bulk upload page, the CSV file format in the information dialog conveys that we do. The file format in there shows a Github column in the username table. This task is about removing the Github column from the table and updating the corresponding file format screenshot.

Hello everyone,
For sometime now, I've been wondering why this tool was named the way it's. I believe this tool is clearly misnamed. I am not sure whether there was any conscious decision/deliberation in choosing the name or if it just happened to be chosen by the primary developer in the initial phase of the code.
If there was any discussion endorsing the suitability of this name then you can just close this issue, otherwise I suggest to rename it.
The tool does not track any "wiki" activity nor wiki "contrib[ution]" and so its name should not inaccurately suggest that it do.
The tool express purpose is to track and showcase "developer activity/contrib," and so the name should reflect that. I don't have great suggestions though, but I believe something like "DeveloperStats" would be better and more accurate than what we have now.
"DeveloperContrib" and the like are also equally viable alternatives as well as other suggestions people might have.
Note: This task is reserved for Google Code-in students. Please do not claim this task.
Recently in #63, @JanStevcik faced some problems while pushing the pull requests. Upon hosting the tool locally, few dependencies are getting added (like a directory named semantic/ and a file named semantic.json).
When the contributor is pushing the patch to the repo and if he/she accidentally type the command git add .. The above two specified ones are being added to the commit. Ideally it should not be done.
To prevent happening this, add semantic/ and semantic.json to .gitignore. This avoids both of them while the contributors make new commits :)
To know more about gitignore, you can read this article: https://git-scm.com/docs/gitignore
You can add semantic/ and semantic.json to the .gitignore file in Wikicontrib/frontend/WikiContrib-Frontend/.
Note: This task is reserved for Google Code-in students. Please do not claim this task.
In .env.example there is a variable named PORT. It provide the details of the database port through which the current backend server can be connected to database server.
In toolforge, on hosting this tool with the variable named PORT in environment file, the tool is not responding to any requests. The exact reason for it is still unknown (There might be some internal configuration issues). So rename the variable PORT to DB_PORT in .env.example file.
On changing the variable PORT to DB_PORT, you also need to replace env('PORT') in settings.py file.
The start_date and end_date filters of the app are breaking in december month. The reason for this might be due to the line month = month + 1 in the code. It should be replace with month = (month + 1)%12. There need to be some more code changes.
Documentation here is outdated: https://meta.wikimedia.org/wiki/WikiContrib. It has a lot of process documentation such as technical implementation, wireframes, and mockups, that may not be useful to a potential user of the tool.
Some ideas for improving the documentation:
For inspiration look into existing documentation of tools on meta wiki :) Some examples:
In the process of trying out of the tool, if you encounter any bug, feel free to file an issue in this repository!
Currently, for Gerrit, we are counting all the patches that have a status which matches with the one in the list below:
gerrit_status = [
  'merged',
  'abandoned',
  'closed',
  'pending',
  'reviewed',
];
For Gerrit, I think only merged contributions are meaningful. Just like in Github, contributions that are under review or not yet merged are not counted. So, ideally, we count only patches with merged status.
Currently, for Phabricator, we are counting all those tasks that have a status which matches with the one in the list below:
phab_status = [
  'declined',
  'resolved',
  'stalled',
  'invalid',
  ‘open’
];
For Phabricator, ideally we ignore invalid tasks. Maybe we should also ignore declined and stalled tasks.
Description:
Trying to update query but not updating the csv file, causing the error.
How to reproduce
The below error is being displayed:

When a user has few contributions in the selected range, the y axis displays clearly visible numbers

But when the contribution to display is high, things start to look different. No numbers, just a visual clutter.

Y-axis labels on the graphs should be non-negative integers only. The issue can be reproduced by simply not entering the Gerrit user name and making a search.

Potential solution for this could be to set beginAtZero to true in chart options. You can see this for reference: https://github.com/WikipediaLibrary/hashtags/blob/master/hashtagsv2/hashtags/static/js/graph.js#L32
Message from console:

I am guessing that the search query is not dependent on the Full Name. If so, the Full Name field should be optional, and we let a user proceed if they haven't filled it out.
Note: This task is reserved for Google Code-in students. Please do not claim this task.
Most of the users get confused because they do not directly see any format in which the CSV file need to be uploaded (of course it is there in the info button). But that is not a great idea because no one thinks that the format is specified over there. So, there can be a quick fix by making a popup on the info button specifying "View the CSV format here" for 5 to 6 seconds on clicking the bulk upload button.
This improves the user experience and helps the users.
I'm not sure if this is feasible, but ideally, we check if the full name, Gerrit and Phabricator username entered by a user are valid and if or not they are linked to the same person. If not, then we don't proceed.
Currently, there are three tools in Toolforge that are related to WikiContrib:
https://tools.wmflabs.org/wikicontrib/
https://tools.wmflabs.org/contraband/
https://tools.wmflabs.org/contrabandapp
One of these tools host frontend and one of them the backend of the app. I am not sure what the third tool does. I think not only this makes the deployment process complicated but also it means leveraging of unnecessary resources on Toolforge. Ideally, the frontend and backend should be hosted via the same tool in Toolforge. We can then shutdown the other two tools and request for its deletion.
Not able to see contributions clearly, when the values are large. This is probably happening because we are setting stepSize:1 in the chart options and that's why the chart is explicitly showing all Y-axis values starting from 1.
https://github.com/wikimedia/WikiContrib/blob/master/frontend/WikiContrib-Frontend/src/result.js#L59

"Search Users in Query box" is not useful if you are viewing contributions for a single user only, it is somewhat confusing. It might be ideal if it is shown only in the case when one chooses to use the bulk upload via CSV feature.
I was exploring the repo and found expressJS. Why do we need expressjs when we can use npm run start which uses react-scripts to run ? Any specific use case?
cc @tuxology
The old name of the WikiContrib project is Contraband. Currently, in quite a few places in the codebase, we are still using the old name of the project. For example, for folder names (e.g. backend/Contraband/contraband), module names, documentation, etc. Ideally, Contraband gets replaced with WikiContrib.
This task is reserved for Google Code-in students.
I found some errors and warnings in console

Note: This issue is raised to test travis CI
After merging #47, the graph formatting should've improved. I think the changes aren't pulled into production environment
I tried to use the bulk upload feature to visualize contributions and it gave me the error as shown in the screenshot:

CSV file format that I followed:
Full Name,Gerrit Username,Phabricator Username
Srishti Sethi,srishakatux,srishakatux
I'm wondering if there is a specific format that we follow that I missed. If so, should we show it on the UI somewhere on the bulk upload/ drop your CSV file page?
Note: This task is reserved for Google Code-in students. Please do not claim this task.
WikiContrib tool provides a visualization within a specified time range of users' contributions to Wikimedia projects on Phabricator and Gerrit. You can play around with it here: https://tools.wmflabs.org/wikicontrib/.
Design a fun logo following the tips-and-tricks below:
The best design will become the logo of the WikiContrib project, and we might ask you later to upload it to Wikimedia Commons :)
Note: This task is reserved for Google Code-in students. Please do not claim this task.
Add hovering affect to the commits on specific date. It can look like: (fourth commit in the image).

Presently, all the commits are displayed in the cards with a shadow as shown in the above figure. Hover property can be added to each of them to improve User experience a bit (by differentiating the currently hovered card with other ones). In general sense, shadow will be added on hover(in most of the websites), but we already have shadow for the cards over here. So, following two things can be done to add the hovering affect:
NOTE: This task is reserved for Google Code-in students. Please do not claim this task.
Replace the message in the information dialog below with "WikiContrib tool provides a visualization within a specified time range of users' contributions to Wikimedia projects on Phabricator and Gerrit."

Visualization of contributions for users added via the CSV file upload feature in its current shape and form works well. One of the possible use cases of this feature -a hackathon scholarship committee uses it to eliminate applicants with little or no contributions to Wikimedia projects from the scholarship list. This feature can also help decide between promising candidates. Right now, the committee has to do manual work in choosing applicants. If not for finalizing candidates (as that requires manual review), at least for the initial elimination round, this feature can be used. But, for it to be useful for the committee, list view integration in a format shown below will help assess applicants quickly:
| Name | Phabricator contributions | Gerrit contributions | Total contributions |
|---|---|---|---|
| Srishti Sethi | x | y | sum of x and y |
| Rammanoj Potla | a | b | sum of a and b |
| Suchakra Sharma | c | d | sum of c and d |
| .. | .. | .. | .. |
Once the following issue #60 is addressed, maybe we should consider removing the contribution status filter.
I think that the filter is adding complexity and we should keep visualization feature simple. Also, it is of little value for user to apply filter to view contributions that are not meaningful.
This could also be a Google Code-in task.

This is an awesome tool, thank you for working on this!
I think I found a weird bug (unless I'm missing something?) with how the dates and ranges are displayed.
I looked for my contributions, and I got this:

The date boxes at the bottom with the contributions also seem to go left-to-right from September 2019 (today) to August 2018 (last year) which is a bit odd for a direction.
Shouldn't the dates go from August 2018 to September 2019?
Also, somewhat relatedly, the Phab/Gerrit count displays months Jan to Dec, which is not the same range that is displayed above (Aug-September)

I think there might be a bit of a mismatch of the output of the labels vs the actual calculation?
Hi,
I am trying to install the backend and getting an error. Can you please help me?
➜  Contraband git:(master) pip install -r requirements.txt
DEPRECATION: Python 2.7 will reach the end of its life on January 1st, 2020. Please upgrade your Python as Python 2.7 won't be maintained after that date. A future version of pip will drop support for Python 2.7.
Collecting aiohttp==2.3.10 (from -r requirements.txt (line 1))
  Could not find a version that satisfies the requirement aiohttp==2.3.10 (from -r requirements.txt (line 1)) (from versions: 0.1, 0.2, 0.3, 0.4, 0.4.1, 0.4.2, 0.4.3, 0.4.4, 0.5.0, 0.6.0, 0.6.1, 0.6.2, 0.6.3, 0.6.4, 0.6.5, 0.7.0, 0.7.1, 0.7.2, 0.7.3, 0.8.0, 0.8.1, 0.8.2, 0.8.3, 0.8.4, 0.9.0, 0.9.1, 0.9.2, 0.9.3, 0.10.0, 0.10.1, 0.10.2, 0.11.0, 0.12.0, 0.13.0, 0.13.1, 0.14.0, 0.14.1, 0.14.2, 0.14.3, 0.14.4, 0.15.0, 0.15.1, 0.15.2, 0.15.3, 0.16.0, 0.16.1, 0.16.2, 0.16.3, 0.16.4, 0.16.5, 0.16.6, 0.17.0, 0.17.1, 0.17.2, 0.17.3, 0.17.4, 0.18.0, 0.18.1, 0.18.2, 0.18.3, 0.18.4, 0.19.0, 0.20.0, 0.20.1, 0.20.2, 0.21.0, 0.21.1, 0.21.2, 0.21.4, 0.21.5, 0.21.6, 0.22.0a0, 0.22.0b0, 0.22.0b1, 0.22.0b2, 0.22.0b3, 0.22.0b4, 0.22.0b5, 0.22.0b6, 0.22.0, 0.22.1, 0.22.2, 0.22.3, 0.22.4, 0.22.5, 1.0.0, 1.0.1, 1.0.2, 1.0.3, 1.0.5, 1.1.0, 1.1.1, 1.1.2, 1.1.3, 1.1.4, 1.1.5, 1.1.6, 1.2.0, 1.3.0, 1.3.1, 1.3.2, 1.3.3, 1.3.4, 1.3.5, 2.0.0rc1, 2.0.0, 2.0.1, 2.0.2, 2.0.3, 2.0.4, 2.0.5, 2.0.6.post1, 2.0.7, 2.1.0, 2.2.0, 2.2.1, 2.2.2, 2.2.3, 2.2.4, 2.2.5, 2.3.0a4, 2.3.0, 2.3.1, 2.3.2b2)
No matching distribution found for aiohttp==2.3.10 (from -r requirements.txt (line 1))
A declarative, efficient, and flexible JavaScript library for building user interfaces.
🖖 Vue.js is a progressive, incrementally-adoptable JavaScript framework for building UI on the web.
TypeScript is a superset of JavaScript that compiles to clean JavaScript output.
An Open Source Machine Learning Framework for Everyone
The Web framework for perfectionists with deadlines.
A PHP framework for web artisans
Bring data to life with SVG, Canvas and HTML. 📊📈🎉
JavaScript (JS) is a lightweight interpreted programming language with first-class functions.
Some thing interesting about web. New door for the world.
A server is a program made to process requests and deliver data to clients.
Machine learning is a way of modeling and interpreting data that allows a piece of software to respond intelligently.
Some thing interesting about visualization, use data art
Some thing interesting about game, make everyone happy.
We are working to build community through open source technology. NB: members must have two-factor auth.
Open source projects and samples from Microsoft.
Google ❤️ Open Source for everyone.
Alibaba Open Source for everyone
Data-Driven Documents codes.
China tencent open source team.