simpod / grafanajsondatasource Goto Github PK
View Code? Open in Web Editor NEWGrafana datasource to load JSON data over your arbitrary HTTP backend
Home Page: https://grafana.com/grafana/plugins/simpod-json-datasource/
License: MIT License
Grafana datasource to load JSON data over your arbitrary HTTP backend
Home Page: https://grafana.com/grafana/plugins/simpod-json-datasource/
License: MIT License
Hi, I'm using this plugin as datasource to create template variables on all of my dashboards. After upgrading to 0.1.5 grafana trowed an error "Templating Template variables could not be initialized: e.metricFindQuery is not a function".
I'm creating the issue because I don't know if this is now a excepted behavior or not. Rolled back to 0.1.4 and all errors were gone.
Is it possible to use like this?
{ "var1": "test-${testvar}", "var2": "hello"}
I keep getting: Unexpected number in JSON at position XX
On Variables > New page:

Hi, all!
I'd like to get current logged Grafana user name
[dataproxy]
logging = true
send_user_header = true
but I can't write JS backend, pls, help me!!!
var express = require('express');
var cors = require('cors')
var app = express();

app.use(cors());

app.get('/', function (req, res) {
  console.log('index: ',req.header('X-Grafana-User'));
  res.send('Hello World!');
});

app.get('/query', function (req, res) {
  console.log('query: ',req.header('X-Grafana-User'));
  res.status(200);
  res.json({ username: req.header('X-Grafana-User') })
});

app.get('/search', function (req, res) {
	console.log('search: ',req.header('X-Grafana-User'));
  res.status(200);
  res.json({ username: req.header('X-Grafana-User') })
});

app.listen(3002, function () {
  console.log('Example app listening on port 3002!');
});
Hi. I am greatly thankful for your plugin as it allowed me to easily visualize data that would be hardly accessible from grafana other way. Only thing that really makes my effort not easy is a way how you handle variable substitution. Which as now doesn't allow substitution inside of string.
I know there rarely are any easy answers. However wouldn't be it better to stick to how Grafana (eg https://grafana.com/docs/reference/templating/#advanced-formatting-options) handles variable substitution and treat Additional JSON Data as plaintext during substitution? It would arguably allow much greater control over how should be variable formatted and/or interpreted.
To illustrate problem I'm trying to tackle, this is example of additional data I use
{
  "sql": "select day, dsp_id, sum(commission) as commission, sum(money) as money from real_commission where day between %(from)s and %(to)s group by day, dsp_id order by day asc",
  "time_field": "day",
  "value_fields": ["commission", "money"],
  "pivot_fields": ["dsp_id"]
}
If variable could be put inside of that sql it would save a lot of work.
Is it possible to display such customized notifications or prompts?

The only way to know this is to try and be disappointed.
Thanks
It would be really useful to have a list of features of this implementation which differs it from the regular simple json datasource implementation. It's an official Grafana plugin and it's confusing to have two different plugins with almost the same name :(
The description is too vague as it only states that "JSON Datasource is an enhanced version of the Simple JSON Datasource."
Hi,
i'm running Grafana 6.3.2 with InfluxDB 1.7.8 on a Raspberry Pi 3B+ with Raspbian GNU/Linux 10.1 (buster).
On the Pi the web server Apache is running too.
Now i'm trying to get additional data (annotations) via the json datasource into my dashboards.
On the Pi i have created the following files with the static content (for testing) copied from README.md:
/var/www/html/api/grafana/index.php:
(empty file)
/var/www/html/api/grafana/search/index.php:
["upper_25","upper_50","upper_75","upper_90","upper_95"]
/var/www/html/api/grafana/query/index.php:
[
{
"target":"pps in",
"datapoints":[
[622,1450754160000], // Metric value as a float , unixtimestamp in milliseconds
[365,1450754220000]
]
},
{
"target":"pps out",
"datapoints":[
[861,1450754160000],
[767,1450754220000]
]
}
{
"target":"errors out",
"datapoints":[
[861,1450754160000],
[767,1450754220000]
]
}
{
"target":"errors in",
"datapoints":[
[861,1450754160000],
[767,1450754220000]
]
}
]
/var/www/html/api/grafana/annotations/index.php:
[
{
"text": "text shown in body",
"title": "Annotation Title",
"isRegion": true,
"time": "timestamp",
"timeEnd": "timestamp",
"tags": ["tag1"],
}
]
In grafana i created the datasource using the url
http://localhost/api/grafana
and on my dashboard i have created an annotation by using the json datasource.
When i now refresh my dashboard i get the following error message:
Annotation Query Failed
{"err":{"data":null,"status":-1,"config":{"method":"POST","transformRequest":[null],"transformResponse":[null],"jsonpCallbackParam":"callback","url":"api/datasources/proxy/8/annotations","data":{"annotation":{"name":"Annotations","datasource":"JSON: Annotations","enable":true,"iconColor":"rgba(255, 96, 96, 1)"},"range":{"from":"2019-09-17T14:59:57.914Z","to":"2019-09-17T15:59:57.914Z","raw":{"from":"now-1h","to":"now"}},"rangeRaw":{"from":"now-1h","to":"now"},"variables":{"__from":{"text":"1568732070837","value":"1568732070837"},"__to":{"text":"1568735670837","value":"1568735670837"}}},"headers":{"Content-Type":"application/json","X-Grafana-Org-Id":1,"X-Grafana-NoCache":"true","Accept":"application/json, text/plain, /"},"retry":0},"statusText":"","xhrStatus":"error"},"cancelled":true}
Do i have a wrong understanding of how to provide data for the plugin or am i doing something wrong?
Thank you very much!
Hello Simon,
Do variables work in Additional JSON Data field? It doesn't seem to work...

Thanks,
Zak
When requesting the list of metrics, the request should include the information if the request is for a table or a timeseries.
I hope it is as simple as passing on the information and the query object does include that information.
https://github.com/simPod/grafana-json-datasource/blob/master/src/datasource.ts#L95
It appears I can enter any random URL and the plugin will confirm that the datasource is working.
This makes it nearly impossible to diagnose authentication errors, etc.

When I enter custom time range on dashboard, start and end time ranges are being calculated correctly.
From: "now/M", To: "now"
"range":{"from":"2020-01-01T00:00:00.000Z","to":"2020-01-22T22:42:29.377Z","raw":{"from":"now/M","to":"now"}}
Whereas, when I use "now/M" as 'Relative time' JSON datasource on any panel, it's not considering the dashboard configured ('UTC') time zone while evaluating start and end time. It seems it is always using browser default timezone for the time conversion.
"range":{"from":"2020-01-01T00:00:00.000Z","to":"2020-01-22T22:42:29.377Z","raw":{"from":"now/M","to":"now"}}
This is being noticed only with JSON datasource.
Quite similar issue being filed on Grafana for InfluxDB.
grafana/grafana#15284
I'm looking at this both in a specific sense and a general one. Currently it seems that the required URL suffixes, e.g. /search, /query, base /, and /annotations, are hard coded. How feasible would it be to make those a variable set that could be modified per datasource?
Currently, I'm still playing with Grafana in general and exploring what sorts of metrics and data I can pull from what sources. I was taking a look into what I could pull from Samanage and made a mental note on it's ability to return JSON data. However, at least as far as I've seen in their API documentation, they don't seem to follow that URL schema, though I do believe that they have a schema that could still return the data that is expected from the plugin.
I'm relatively new at the configuration of this, and JSON in general, so it's possible there's not much I can pull from there and make use of, but I was curious of being able to get this to return some types of data with that source.
While it's possible that my use case may not be a viable one, it did make me think about flexibility. Since there seems to be headway on backend plugins, and this is pretty well integrated as a generic datasource, I feel that making it more configurable would open up the possibilities of its usage, including querying datasources that you may not have control over the server of.
Let me know what you think.
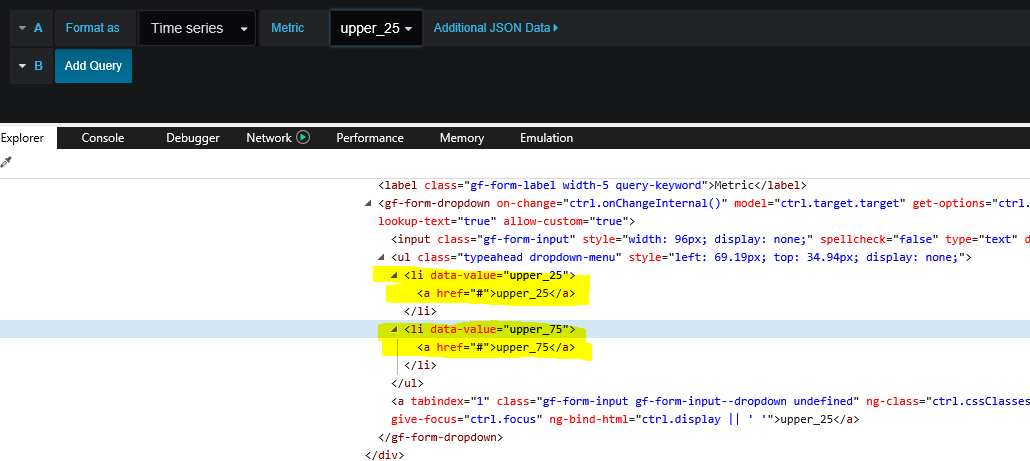
use case: I'm trying to hack a backend with Google Apps Scripts, which uses a redirect mechanism for its web apps
[ { "text" :"upper_25", "value": 1}, { "text" :"upper_75", "value": 2} ]
But dropdown metric control only shows text?
Where are the values?

We should publish this datasource to grafana plugins site. Might drive more people here and we are more likely to see what people need and how they use it. Should be beneficiary for all parties :)
Outdated readme should be taken into account as mentioned here #11 (comment)
@andig do you think you could do it? In past you mentioned you have experience with it. I took the liberty of assigning you.
I'm using grafana 5.0.0 and simpod-json-datasource 0.1.0
The editor is not display when click the 'Additional JSON Data' link.
Found some error in console:
angular.js:14794 TypeError: Cannot read property 'match' of null
    at u.$detectNewLine (index.js:6626)
    at u.insert (index.js:6698)
    at u.setValue (index.js:6606)
    at b.setValue (index.js:11971)
    at r (code_editor.ts:177)
    at Object.r [as link] (app.b0d4f36bb5b6bb18e2ab.js:13493)
    at angular.js:1383
    at angular.js:10605
    at Mt (angular.js:10611)
    at d (angular.js:10000) "<code-editor content="ctrl.target.data" data-mode="json" on-change="ctrl.onChangeInternal()" data-max-lines="30" class=" ace_editor ace-tm">"
Sorry for the propably stupid question.
But new to this datasource and Grafana, I'm trying to implement a backend.
On a search I'm returning a response similary to what is described as a "mapped response". I put the name of a metric in the text and the numeric id of the "metric" in the value.
I was hoping that the values was carried through to the query target but it seems it not.
So I'm wondering what are the value used for?
I think that I have some misunderstanding as the target (shown as Metric in Grafana, dissapears from Grafana, but also makes a query that seems good and returns valid data).
How difficult would it be to support hierarchies in /search, similar to the UI in the Graphite backend?
Right now, you have to basically construct all possible metrics up-front (and maybe filter them based on partial user input), which is potentially very expensive.
I'm imagining the ability to return some sigil in the response from /search that indicates there might be more results, and then search getting called again after the user selects the first level of the tree.
I've noticed a couple of scenarios that don't appear to be working. This also occurs for the original grafana-simple-json datasource.
Essentially if you set a graph to display a legend with values enabled (ie, Avg, Total, etc), the values are not calculated or displayed.
In addition, if you enable 'all series' for the hover tool tips, no values are displayed (even if there's only one series plotted. This works fine if you select the mode as 'single' for the hover tips. I'm guessing this is a related issue. Are others having these problems?
Thanks,
Aaron
Hello, everyone,
I need your help.
Even if I set the timezone to browser, in the call to the query the field "To" is set 1 hour back.

What can I do?
I set Whitelisted Cookies, but the data in the database is {"keepCookies":[]}. And I can't get the cookies.
simPod/grafana-json-datasource v0.1.4 and v0.1.5 both have this problem.
There is the same question in grafana/simple-json-datasource plugin.
If I set the URL of the JSON Data Source with a parameter:
https://mywebsite.com/my_json_api?data=mine
then the parameter is removed and replaced with the relevant action, e.g.:
https://mywebsite.com/my_json_api/query
It would be better if the parameter was still included, so:
https://mywebsite.com/my_json_api/query?data=mine
Hello guys,
Seems like table type is not being passed in your datasource. My installation steps were:
$ cd /var/lib/grafana/plugins/
$ git clone https://github.com/simPod/grafana-json-datasource.git
$ mv grafana-json-datasource/ json/
$ git checkout next
sudo service grafana-server restart
All works fine, and so far no issues really. However the type is not passed in correctly to the targets array in the request message:

What could be the issue?
Thanks,
Zak
Here the error message.
Error: Fetch error: 404 Not Found Instantiating
http://localhost:3000/public/plugins/simpod-json-datasource/module.js \
Loading plugins/simpod-json-datasource/module
In order to publish to NPM a new name is needed: json-datasource? Not sure if its worth to rename the repo, too but it would make the difference clear.
On another project I've started from the grafana template data source which already uses typescript. Shall be convert this plugin?
Hello again,
Another request. Would it be possible to have alias as well for the metrics? I have barely touched JS or TS in my whole life so don't feel comfortable making changes tbh ...

Thanks,
Zak
Hi,
I use Grafana 6.4.4 with json datasource 0.1.7.
When I try to add a Query Variable to the Dashboard wit a json datasource selected, I got following error message:
Dashboard init failed Template variables could not be initialized: b.metricFindQuery is not a function
Am I missing something? Or this feature is not supported yet.
If not supported yet, would it be possible to add Queries to the json structure, so that the endpoint decides how to handle them?
Thank you and best Regards,
Krisztian
How are the tag-keys and tag-values supposed to work from within Grafana?
On my API I have implemented the two interfaces with actual values being returned as described, but I see absolutely no difference in Grafana?
How is it used from Grafana?
I'm finding that if I have enough columns in my table to cause it to be larger than the page then the rows of data have a scrollbar which allows you to scroll right but the column titles don't move. This makes it hard to know which column is which and impossible to select columns to the right to index on.
When All variable option is manually selected, {text: "All", value: "$__all"} is passed instead of all values.
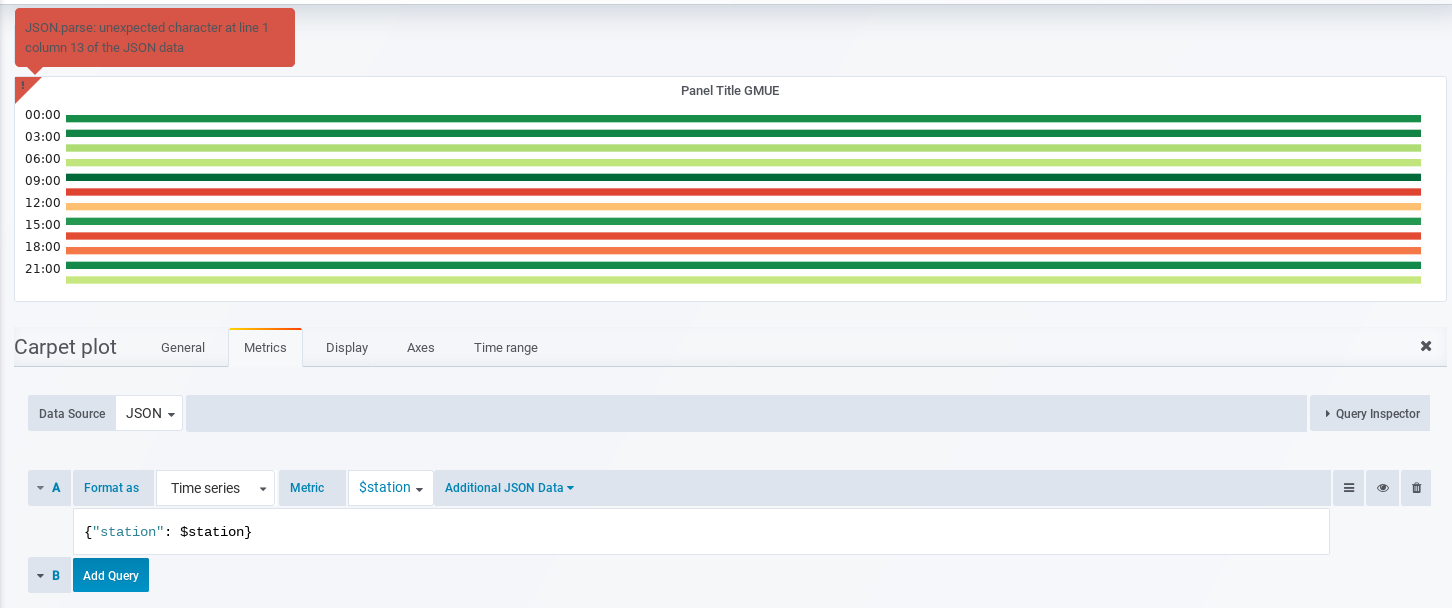
I tried using Additional JSON Data but I just got the Error JSON.parse: unexpected character at line 1 column 13 of the JSON data
Grafana v5.4.3
At the moment, when you create a first query with type=timeseries a second query of type table can be added. If I am not mistaken, Grafana cannot deal with that unless the datasource does merge the data somehow. This datasource cannot, hence should prevent that.
Do you concur?
grafana/simple-json-datasource#83 (comment)
What happened: When I imported a dashboard, the template var gives e.metricsFindQuery is not a function. The data is not loaded, and the request to the server is never actually sent. Note, this is not a problem in the dashboard I originally imported from.
What you expected to happen: Query would load as normal
How to reproduce it (as minimally and precisely as possible):
Anything else we need to know?: Create a basic dashboard with JSON datasource. Then, create new installation of Grafana elsewhere, copy Grafana database, and load dashboard.
Environment:
EDIT: I should also mention, this seems to only affect dashboard parameters, not the panels themselves.
Notes:
@andig I'd like to mark this repository as normal instead of fork. Eg. when creating PRs, it by default tries to make it to upstream which is kind of annoying

Also then make master branch as main one instead of next. I do not intend to ever send PR to original repo :) When you select proper fork, it offers master branch by default

Are you against?
In docs, we say // The field being queried for. for target field. That is not true, for one metric you can return multiple targets with different names.
More context: #14 (comment)
Hi,
the documentation of the expected API is nice but at times a bit vague.
How about using a swagger.yaml for that?
I created this swagger.yaml if you would like to use it and start from there:
https://gist.github.com/fr-ser/b81b1ab70519e29a594daee7f59b6c18
The README says "it's possible to enter variables in the additional JSON data" and that they "should not be enclosed in quotes"
But when I try something like this:
{ "additional": "optional json", "testvar": $testvar }
Grafana errors with Unexpected token $ in JSON at position 44. It works fine without variables. Am I doing something wrong ?
Grafana v5.2.2
grafana-json-datasource v0.1.3
It would be awesome to supply the JSON HTTP Requests with additional HTTP Headers (p.e. send API Keys to other Backends).
Do you think this is a good idea for the plugin?
Hi
I am new to graphana... I have installed (https://github.com/bergquist/fake-simple-json-datasource) fake datasource.
I want to create simple dashboard using table from fake example:
[{"columns":[{"text":"Time","type":"time"},{"text":"Country","type":"string"},{"text":"Number","type":"number"}],"values":[[1553027298855,"SE",123],[1553026298855,"DE",231],[1553025298855,"US",321]]}]
I want to create singlestat panel http://docs.grafana.org/features/panels/singlestat/ using data from above table for example show Country = DE, so panel will show Number - 231.
In addition when I select table I got "Cannot read property 'length' of undefined" error ..
Will appreciate for help - may be possible to run short session
Hi,
using 0.1.7. when I add a Query Variable with multiselect and select more than one items, the array of strings being generated is unparsable:
For example if I have selected MetricA and MetricB than it produces following:
"["MetricA","MetricB"]"
It should produce the following instead:
"["MetricA","MetricB"]"
Otherwise Query Variable with multiselects are unusable, since unparsable.
Thank you and best regards,
Krisztian
Currently doesn't seem to be the case. I also have the problem in another plugin- using your webpack setup- the config partial is not loaded (and no error message).
❯ npm i
npm WARN deprecated [email protected]: We're super 😸  excited that you're trying to use ES2015 syntax, but instead of making more yearly presets 😭 , Babel now has a better preset that we recommend you use instead: npm install babel-preset-env --save-dev. preset-env without options will compile ES2015+ down to ES5 just like using all the presets together and thus is more future proof. It also allows you to target specific browsers so that Babel can do less work and you can ship native ES2015+ to user 😎 ! We are also in the process of releasing v7, so please give http://babeljs.io/blog/2017/09/12/planning-for-7.0 a read and help test it out in beta! Thanks so much for using Babel 🙏, please give us a follow on Twitter @babeljs for news on Babel, join slack.babeljs.io for discussion/development and help support the project at opencollective.com/babel
Right now, whenever the dashboard is refreshed, this plugin queries for the entire time range of data, even though it may already have most of it. For example, if I'm viewing 24 hours of data, and my refresh rate is set to every 5 seconds, I would expect the plugin to query for only the new, missing data. However, it queries for all 24 hours each time.
I'm using version 0.1.7 of this plugin, and Grafana version 6.3.6.
As I understand it, this is not the case for other Grafana datasources. Prometheus, for example, will only query for the missing time. Is the current behavior intended for this plugin, and if so, why?
In all controls, e.g. getting the metrics, the values as types are provided as additional filter critera to the backend. For getTagKeys() and getTagValues() the types value is not provided.
Currently, with every character types the same empty request is sent to the backend.
For example, when requesting the tag key first, the input is { }, as it should.
Now I start typing A...B...C hence would assume to get { "key": "ABC"}. But it remains empty.
For comparison, when using the /search endpoint the requests are
{ "type": "timeseries", "target": "" }
{ "type": "timeseries", "target": "up" }
{ "type": "timeseries", "target": "upper_50" }
Similar case for getTagValues(). The first request with {"key": "City"} is fine, but while typing the request should be {"key": "City", "text": "ABC"}
For the user, by all practical means, the table selection is missing functionality. Other datasources allow to specify complex database queries and the such, but that would not be suited for this datasource.
Hence I would like to select a table, then the control asks the backend via a new rest endpoint about the list of columns. These columns can be of certain types and are rendered differently: attribute, text, key, measure, hierarchy. The columns will be shown in the query control and the user can pick the columns. The list of columns will be included in the query request and the backend should return the data with these columns only.
Example: Table to be read is the SALESORDER table. It has 300 columns. User selects the YEAR, REGION, VALUE columns only. The query request asks to read the target=SALESORDER and type=table, including the three columns in the request, the backend would execute a
select YEAR, REGION, sum(VALUE) as VALUE from SALESORDER group by YEAR, REGION;
query.
YEAR and REGION are shown as an attribute, VALUE as measure in the query control.
I feel like we need to address a problem with Annotations once and for all, so I've brought it here to start the discussion somewhere with more creativity. To me, Annotations are fundamentally flawed in that they have to be drawn separately from the chart queries.
I understand there are cases where you have a data center outage and it makes sense to have a sort of "global" dashboard-wide annotation you want to draw on all charts. In my case, all of my charts show a different server and I want to draw Annotations when an issue occurs on a specific server/chart.
This describes the limitations a bit:
grafana/grafana#717
... but all the solutions proposed have to do with making a filter or a tag related to the type of Annotation we want to draw.
I want to start digging into this, but to get started I have never worked on a datasource plugin before and I want to know: Why can't we just attach the annotation to the chart's query as another target?
Currently a query response looks like this:
[
  {
    "target":"upper_75",
    "datapoints":[
      [622,1450754160000],
      [365,1450754220000]
    ]
  },
  {
    "target":"upper_90",
    "datapoints":[
      [861,1450754160000],
      [767,1450754220000]
    ]
  }
]
I'd like to be able to do this:
[
  { // draws a regular time series object
    "target":"upper_75",
    "datapoints":[
      [622,1450754160000],
      [365,1450754220000]
    ]
  },
  { // draws a regular time series object
    "target":"upper_90",
    "datapoints":[
      [861,1450754160000],
      [767,1450754220000]
    ]
  },
 { // draws an annotation on this specific chart
   "type":"annotation",
   "text": "text shown in body",
   "title": "Annotation Title",
   "isRegion": true,
    "time": "timestamp",
    "timeEnd": "timestamp",
    "tags": ["tag1"]
 }
]
If somebody could help me by describing the process Grafana uses to actually draw these annotations, maybe I could start to piece together how to make a pull request to adapt an extra check for "type":"annotation" and forward the object off to whatever mechanism draws those. What do you think, am I crazy here? Thanks for indulging me.
In Grafana 6.5 when I try to create a new Query-variable with the simpod-json-datasource ("Live" in the screenshot), it seems that the datasource sends a POST /search request which leads to wrong returned values. Instead the datasource should send POST /query requests to the HTTP server.
My server logs the following:
{"message":"Received request: POST /search","level":"info"}
{"message":"Request arguments: body=\"{\"target\":\"live:my:redis:key\"}\", queryString=\"{}\".","level":"debug"}
Create a variable with the datasource and grafana 6.5
The datasource sends a POST /search request.
The datasource sends a POST /query request.

A declarative, efficient, and flexible JavaScript library for building user interfaces.
🖖 Vue.js is a progressive, incrementally-adoptable JavaScript framework for building UI on the web.
TypeScript is a superset of JavaScript that compiles to clean JavaScript output.
An Open Source Machine Learning Framework for Everyone
The Web framework for perfectionists with deadlines.
A PHP framework for web artisans
Bring data to life with SVG, Canvas and HTML. 📊📈🎉
JavaScript (JS) is a lightweight interpreted programming language with first-class functions.
Some thing interesting about web. New door for the world.
A server is a program made to process requests and deliver data to clients.
Machine learning is a way of modeling and interpreting data that allows a piece of software to respond intelligently.
Some thing interesting about visualization, use data art
Some thing interesting about game, make everyone happy.
We are working to build community through open source technology. NB: members must have two-factor auth.
Open source projects and samples from Microsoft.
Google ❤️ Open Source for everyone.
Alibaba Open Source for everyone
Data-Driven Documents codes.
China tencent open source team.