Giter Club home page Giter Club logo

elastiflow's Introduction

This legacy version of ElastiFlow™ is now deprecated.

PLEASE NOTE: This repository remains for historical purposes, however no part of this legacy solution is shared with the next generation of ElastiFlow™. To install the new solution please refer to the documentation at docs.elastiflow.com. For assistance with the new solution, please join the ElastiFlow Community Slack.

Now that the new ElastiFlow™ Unified Flow Collector is generally available, the legacy Logstash-based solution in this repository is deprecated. It will remain here for historical purposes, but will not receive updates. You are encouraged to try out the new collector. See more details below.

We have released the next generation of ElastiFlow™ which introduces the new ElastiFlow Unified Flow Collector for Netflow, IPFIX and sFlow.

Some of the enhancements included in the all-new collector include:

  • Proper management templates from different devices. - NO MORE template conflicts!
  • Improved Scalability - Over 10x more flows/sec than Logstash, over 3x more than Filebeat!
  • Support for Option Templates - Dynamic enrichment of network interface name and application names and more!
  • Telemetry Support - sFlow Counter Samples and other metrics from Cisco, Calix and more!
  • Gracefully handles “unknown” Fields - No more dropped flows when a single unsupported field is encountered.
  • Fully decodes and translates all available data - DSCP, TCP Options, ECN, Fragmentation Flags, and more.

Get Started with the next generation of ElastiFlow... HERE

You can also join the ElastiFlow community Slack... HERE

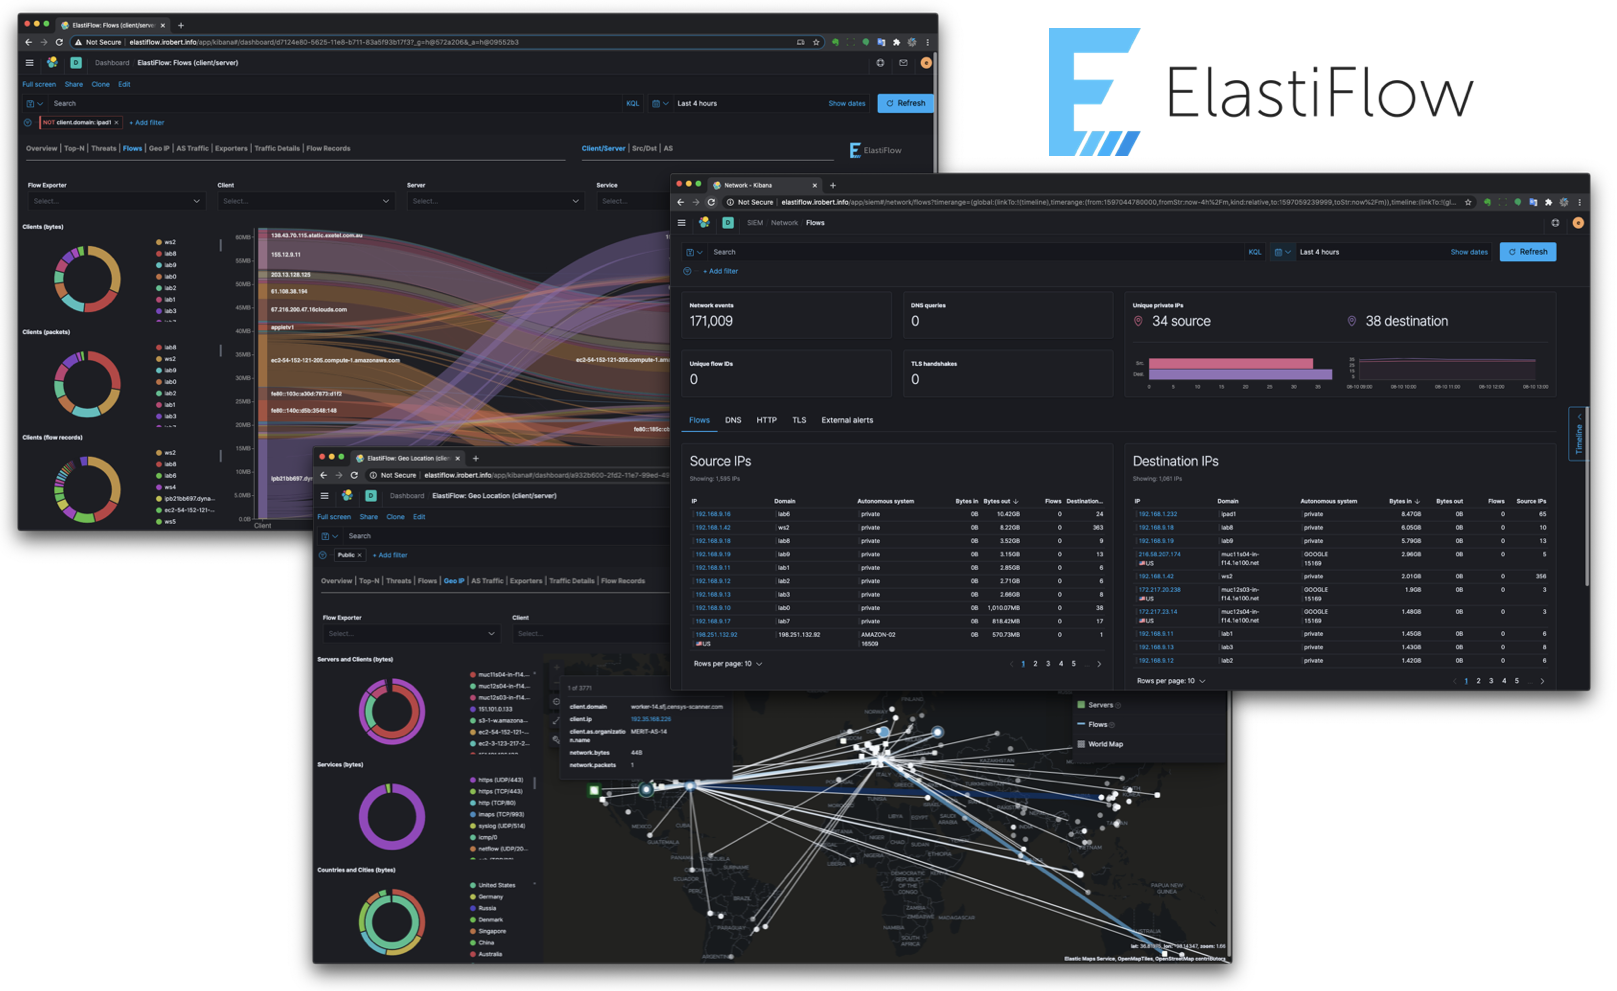
ElastiFlow™ provides network flow data collection and visualization using the Elastic Stack (Elasticsearch, Logstash and Kibana). It supports Netflow v5/v9, sFlow and IPFIX flow types (1.x versions support only Netflow v5/v9).

ElastiFlow™

I was inspired to create ElastiFlow™ following the overwhelmingly positive feedback received to an article I posted on Linkedin... WTFlow?! Are you really still paying for commercial solutions to collect and analyze network flow data?

User Testimonials

Organization Feedback
Uber "ElastiFlow has significantly reduced our network flow monitoring costs. The flexibility and extensibility inherent to ElastiFlow was essential for an easy integration with our infrastructure monitoring suite."
ESnet “Right now this is my personal favorite analytics tool. I use it extensively and am always finding a new way to leverage it."
Payback "We're using it since two months in our new datacenter and our network admins are very happy and impressed."
Catapult Systems "Of all the netflow tools I’ve tested it has, by far, the best visualizations."
Imagine Software "We absolutely love ElastiFlow and recently stood it up in production. Looking forward to new functionality and dashboards."

Getting Started

NOTE - Please refer to INSTALL.md for installation instructions.

ElastiFlow™ is built using the Elastic Stack, including Elasticsearch, Logstash and Kibana. Please refer to INSTALL.md for instructions on how to install and configure ElastiFlow™.

If you are new to the Elastic Stack, this video goes beyond a simple default installation of Elasticsearch and Kibana. It discusses real-world best practices for hardware sizing and configuration, providing production-level performance and reliability.

0003_es_install

Additionally local SSD storage should be considered as mandatory! For an in-depth look at how different storage options compare, and in particular how bad HDD-based storage is for Elasticsearch (even in multi-drive RAID0 configurations) you should watch this video...

0001_es_storage

NOTE: Please make sure that have reviewed KNOWN_ISSUES.md prior to getting started.

Kibana App Compatibility

SIEM

SIEM: Hosts

SIEM: Network Map

SIEM: Network Statistics

Logs

Logs

Provided Dashboards

The following dashboards are provided.

NOTE: The dashboards are optimized for a monitor resolution of 1920x1080.

Overview

Overview

Top-N

There are separate Top-N dashboards for Top Talkers, Services, Conversations and Applications.

Top Talkers

Top Talkers

Top Services

Top Services

Top Conversations

Top Conversations

Top Applications

Top Applications

Threats

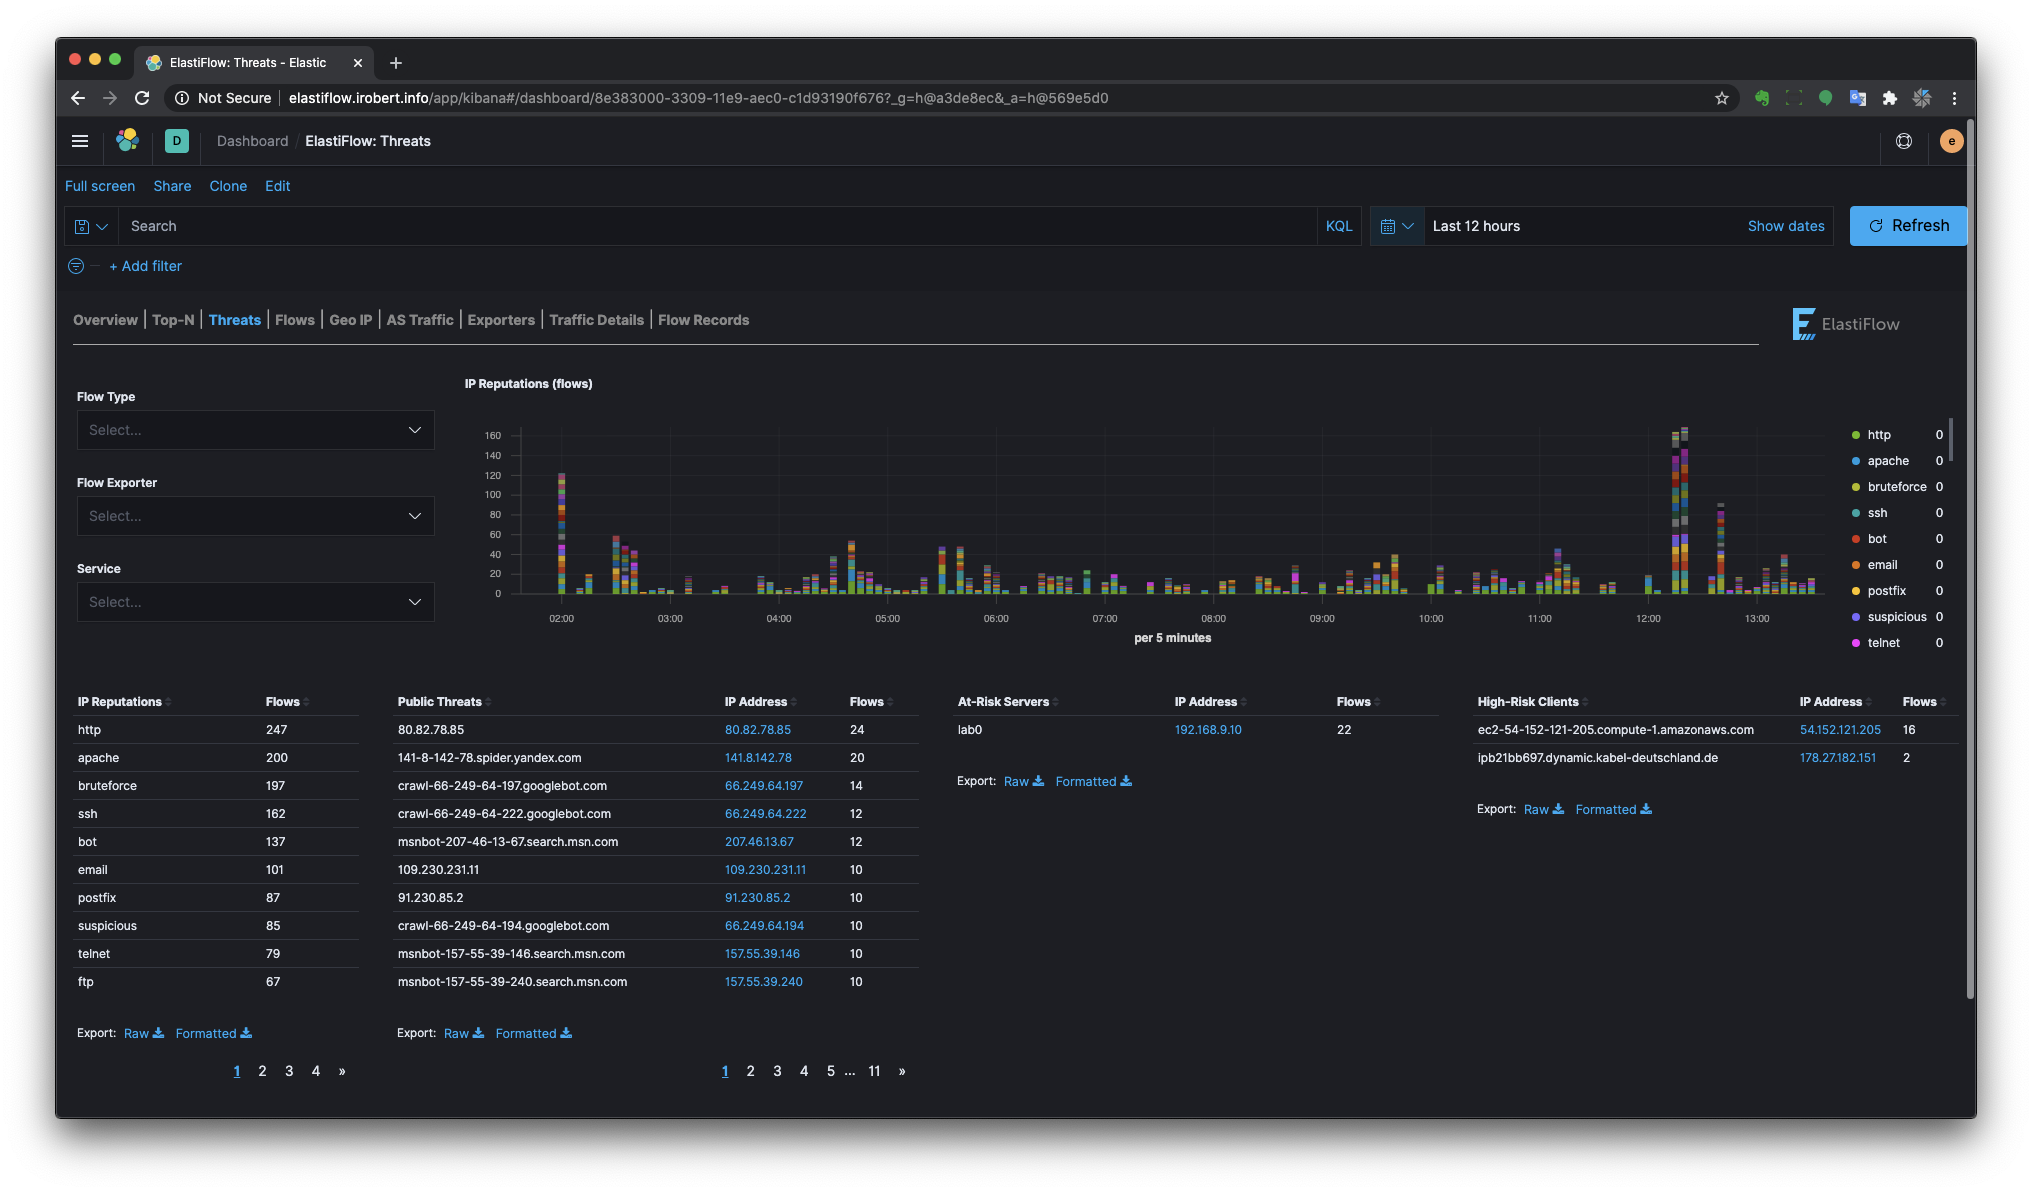
ElastiFlow™ includes a dictionary of public IP addresses that are known to have a poor reputation. This dictionary is built from many OSINT data sources, normalized to a common taxonomy. The Threats dashboard uses this IP reputation information to highlight three threat/risk types.

  1. Public Threats - Public clients with a poor IP reputation that are reaching private addresses.
  2. At-Risk Servers - Private Servers that are being reached by clients with a poor IP reputation.
  3. High-Risk Clients - Private clients that are accessing public servers which have a poor reputation.

Threats

Flows

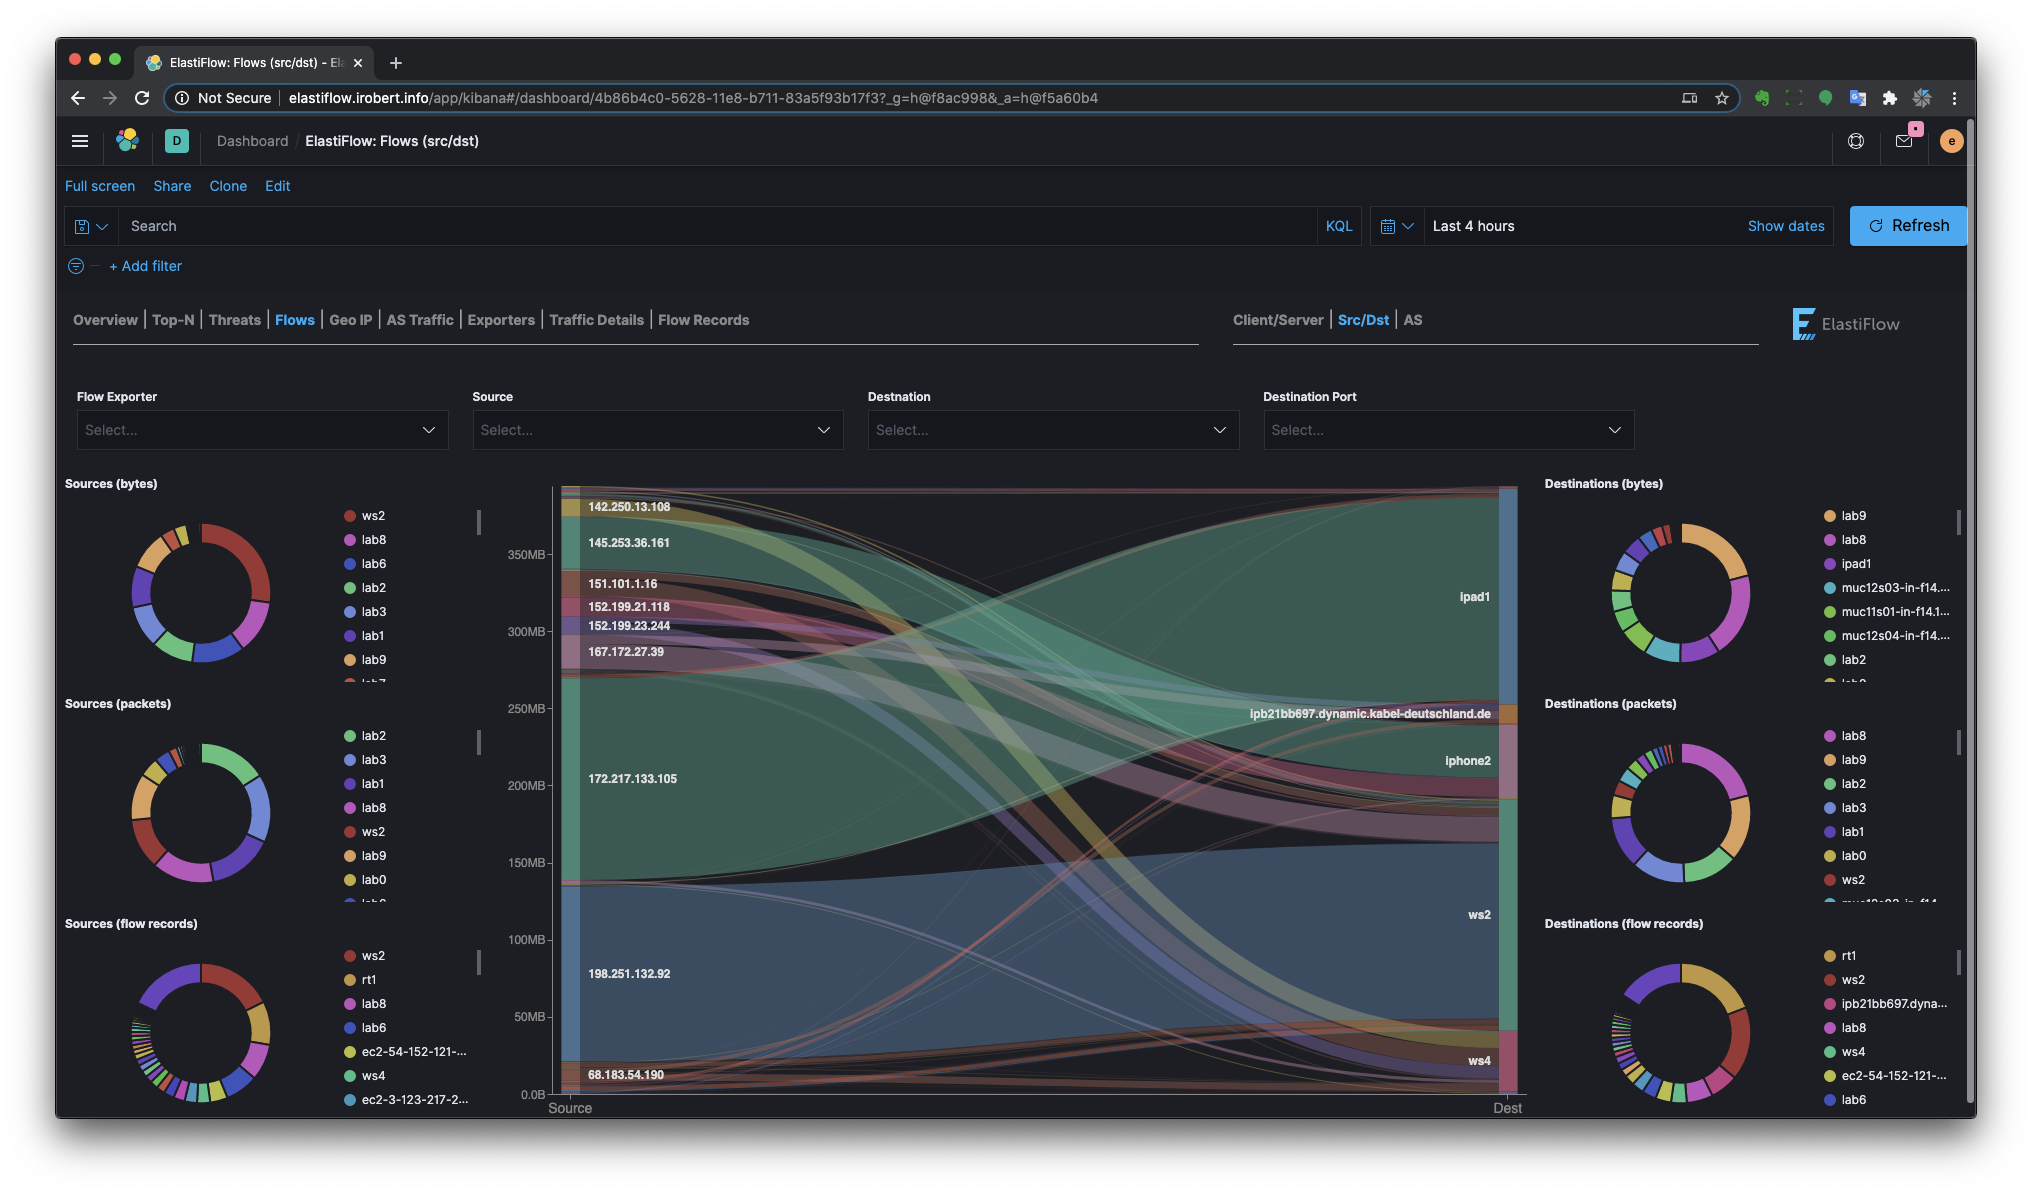
There are separate Sankey dashboards for Client/Server, Source/Destination and Autonomous System perspectives. The sankey visualizations are built using the new Vega visualization plugin.

Client/Server Flows

Client/Server Flows

Source/Destination Flows

Source/Destination Flows

Autonomous System Flows

Autonomous System Flows

Geo IP

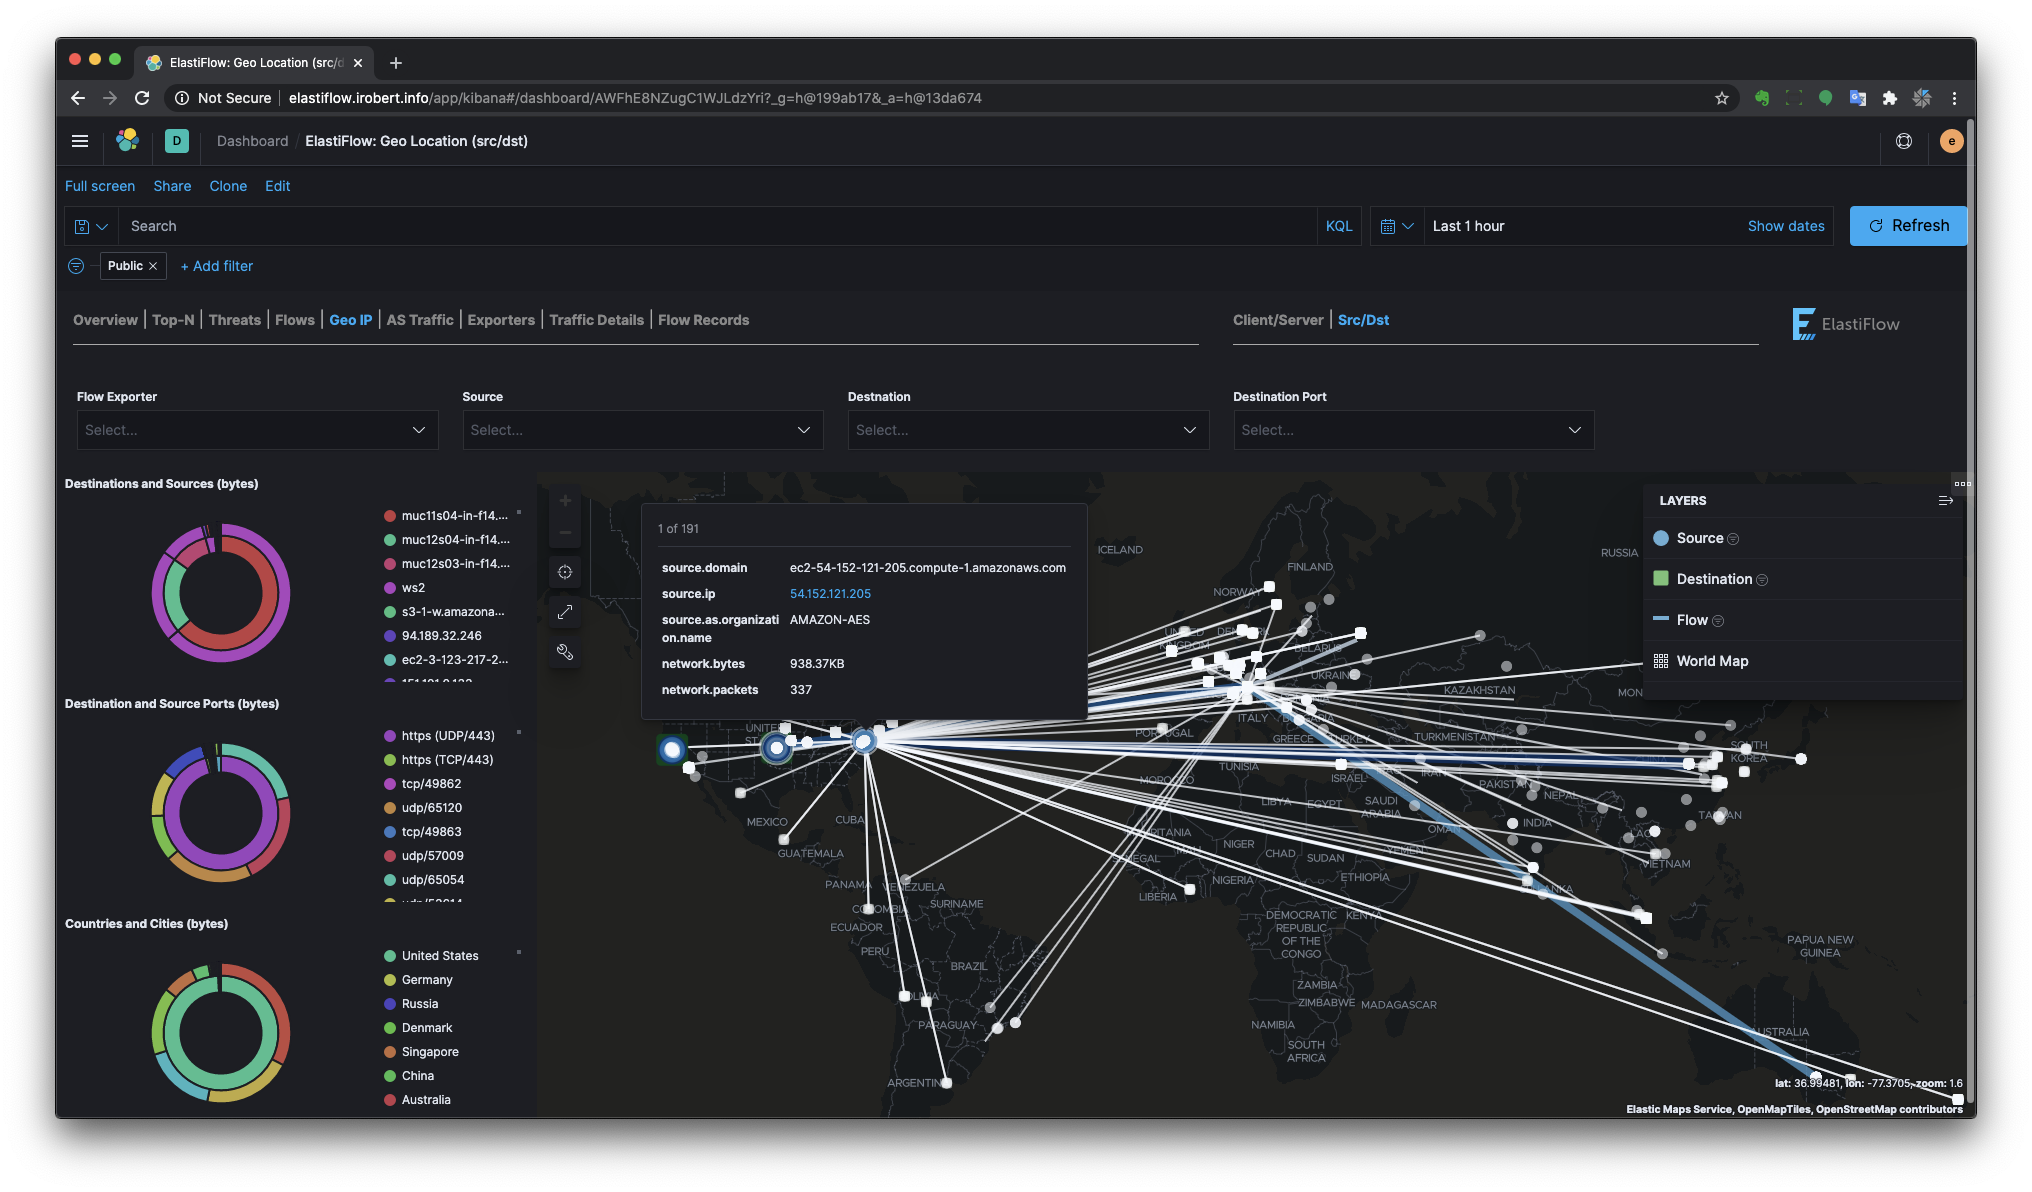
There are separate Geo Location dashboards for Client/Server and Source/Destination perspectives.

Client/Server Geo IP

Client/Server Geo IP

Source/Destination Geo IP

Source/Destination Geo IP

AS Traffic

Provides a view of traffic to and from Autonomous Systems (public IP ranges)

AS Traffic

Flow Exporters

Flow Exporters

Traffic Details

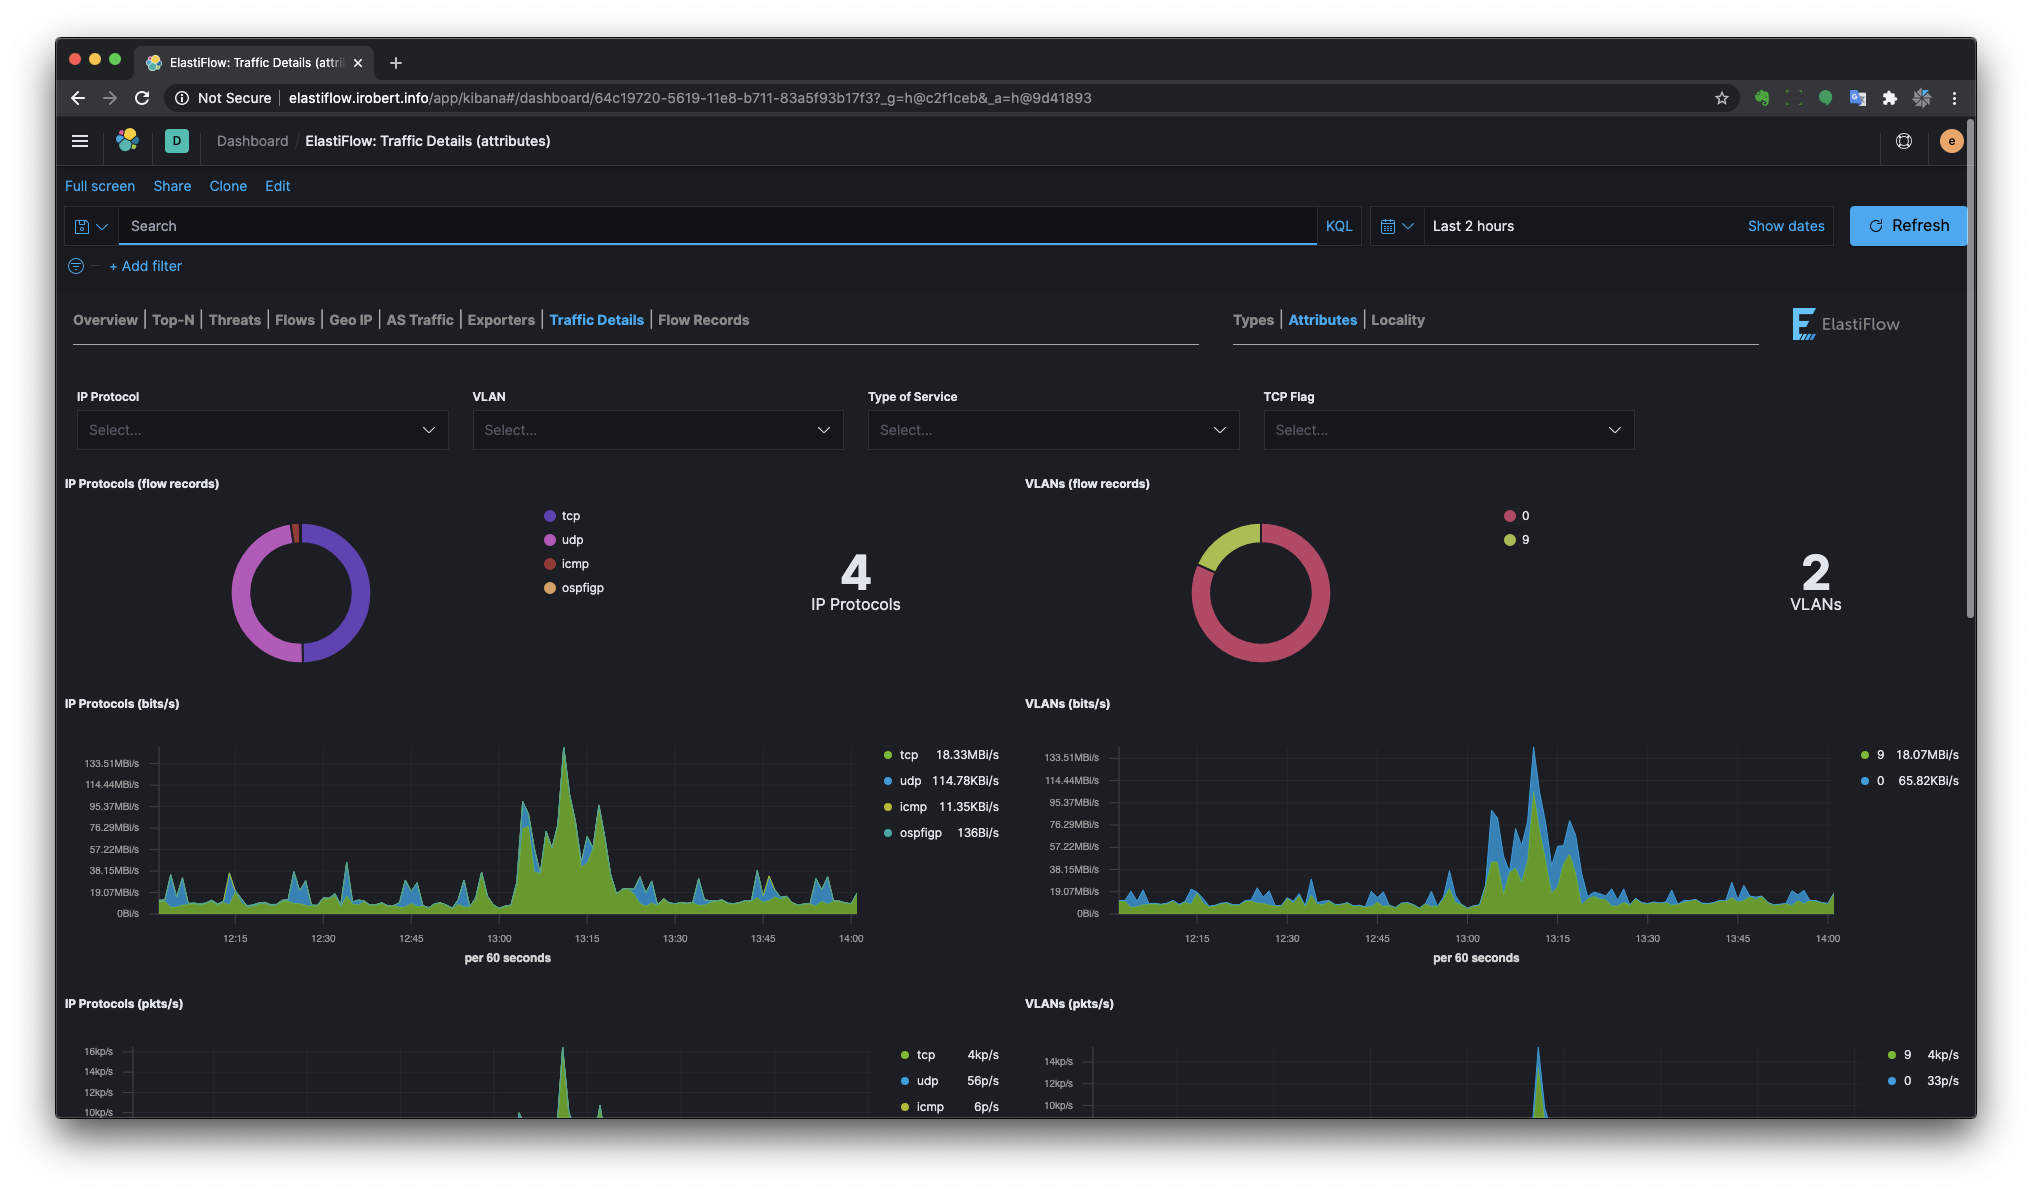
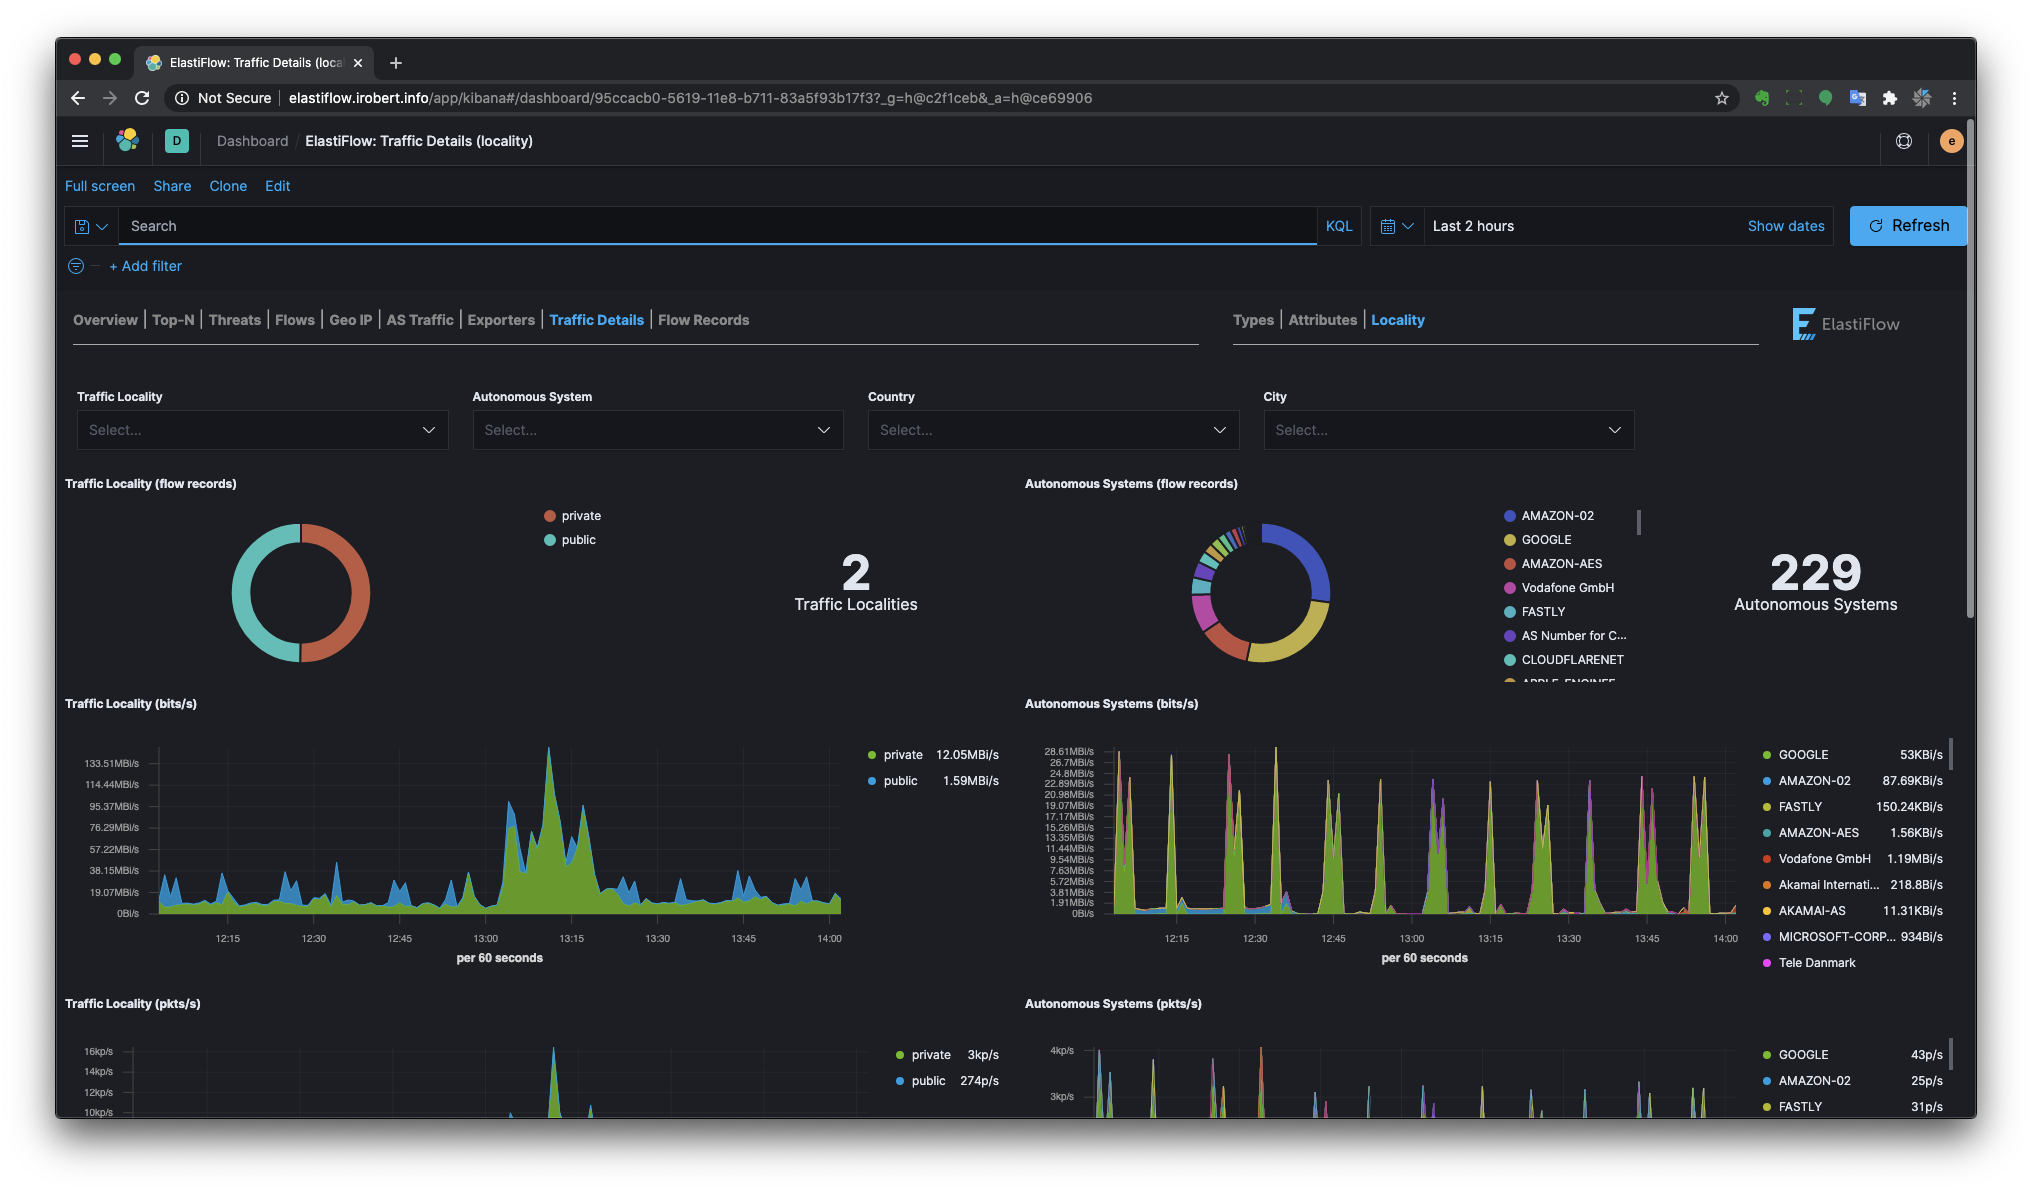
Provides more detailed breakdown of various network traffic characteristics.

Traffic Types

Traffic Types

Traffic Attributes

Traffic Attributes

Traffic Locality

Traffic Locality

Flow Records

Client/Server

Client/Server

Source/Destination

Source/Destination

Ziften ZFlow

ElastiFlow™ v3.4.0 added support for IPFIX records from Ziften's ZFlow agent. In addition to being fully integrated with the standard dashboards, a stand-alone ZFlow dashboards displays network traffic based on user and command data provided by ZFlow. Ziften ZFlow

Attribution

This product includes GeoLite2 data created by MaxMind, available from (http://www.maxmind.com)

elastiflow's People

Contributors

bluefangs avatar bmatthewshea avatar codeout avatar connie-wild avatar eikef avatar lorenzbausch avatar pytechmike avatar robcowart avatar vitopiserchia avatar yankiwi avatar

Stargazers

 avatar  avatar  avatar  avatar  avatar  avatar  avatar  avatar  avatar  avatar  avatar  avatar  avatar  avatar  avatar  avatar  avatar  avatar  avatar  avatar  avatar  avatar  avatar  avatar  avatar  avatar  avatar  avatar  avatar  avatar  avatar  avatar  avatar  avatar  avatar  avatar  avatar  avatar  avatar  avatar  avatar  avatar  avatar  avatar  avatar  avatar  avatar  avatar  avatar  avatar  avatar  avatar  avatar  avatar  avatar  avatar  avatar  avatar  avatar  avatar  avatar  avatar  avatar  avatar  avatar  avatar  avatar  avatar  avatar  avatar  avatar  avatar  avatar  avatar  avatar  avatar  avatar  avatar  avatar  avatar  avatar  avatar  avatar  avatar  avatar  avatar  avatar  avatar  avatar  avatar  avatar  avatar  avatar  avatar  avatar  avatar  avatar  avatar  avatar  avatar

Watchers

 avatar  avatar  avatar  avatar  avatar  avatar  avatar  avatar  avatar  avatar  avatar  avatar  avatar  avatar  avatar  avatar  avatar  avatar  avatar  avatar  avatar  avatar  avatar  avatar  avatar  avatar  avatar  avatar  avatar  avatar  avatar  avatar  avatar  avatar  avatar  avatar  avatar  avatar  avatar  avatar  avatar  avatar  avatar  avatar  avatar  avatar  avatar  avatar  avatar  avatar  avatar  avatar  avatar  avatar  avatar  avatar  avatar  avatar  avatar  avatar  avatar  avatar  avatar  avatar  avatar  avatar  avatar  avatar  avatar  avatar  avatar  avatar  avatar  avatar  avatar  avatar  avatar  avatar  avatar  avatar  avatar  avatar  avatar  avatar  avatar  avatar  avatar  avatar  avatar  avatar  avatar  avatar  avatar  avatar  avatar  avatar  avatar  avatar  avatar  avatar

elastiflow's Issues

Netflow v9 of a particular format fails to be parsed by logstash

Hi Rob,
I'm attaching a tar.gz containing two netflow pcap files.
172.pacp => contains netflow records where template info is stored separately in a record while the actual data is stored in a separate record. This is parsed by logstash without any issue and is able to be viewed in kibana.

nps.pcap => contains netflow records where both the template and data is stored in the same record. This never gets past logstash.

Would you happen to know why? Is it something that's got to do with the format difference as mentioned above? If so, what will I need to change?

Thanks.

Some display issues in Kibana 6.2.2

Hello,

I have a freshly installed ELK system. And some problems in Kibana 6.2.2
Vertical bars are not displayed. First, the problem is because I have a lot of documents in my script, about 2000 / s, but also the navigation menu has a cut on the bottom, so the letters are half display, also the Kolossian logo.
Is this a bug on your Dashboard or Kibana?

kibanaerror

Cisco ASA Netflow Missing "switched" and other fields

Pulling from a 5525X on ASA 9.2 i'm seeing issues identical to those reported in #18. They seem to be caused by the ingest data missing fields referenced in the searches, the index pattern time calcs, all of it. Cisco docs indicate that while they export at v9, they use non-standard tuples (of course). Here's an event sample for which fields are present, hopefully there's a rational way to compose the missing fields or update the searches for this given its widespread use:

{
  "_index": "netflow-2017.11.28",
  "_type": "netflow",
  "_id": "AWABu2wgmBBMAB5s3hw5",
  "_version": 1,
  "_score": null,
  "_source": {
    "netflow": {
      "icmp_type": 0,
      "dst_locality": "public",
      "egress_acl_id": "00000000-00000000-00000000",
      "flowset_id": 260,
      "fw_event": 3,
      "src_port_name": "TCP/46060",
      "protocol": 6,
      "fw_ext_event": 1001,
      "dst_addr": "192.0.73.2",
      "dst_port_name": "TCP/80 (http)",
      "xlate_src_addr_ipv4": "REDACTED",
      "icmp_code": 0,
      "output_snmp": 2,
      "src_locality": "private",
      "xlate_src_port": 46060,
      "service_name": "TCP/80 (http)",
      "src_addr": "REDACTED",
      "xlate_dst_port": 80,
      "version": "Netflow v9",
      "server_addr": "192.0.73.2",
      "flow_seq_num": 2153,
      "src_port": 46060,
      "flow_locality": "public",
      "event_time_msec": 1511857545764,
      "input_snmp": 3,
      "ingress_acl_id": "f743bbbc-be670862-00000000",
      "dst_port": 80,
      "client_addr": "REDACTED",
      "xlate_dst_addr_ipv4": "192.0.73.2",
      "protocol_name": "TCP",
      "service_port": "80"
    },
    "@timestamp": "2017-11-28T08:25:48.000Z",
    "geoip": {
      "timezone": "America/Los_Angeles",
      "ip": "192.0.73.2",
      "latitude": 37.7484,
      "continent_code": "NA",
      "as_org": "Automattic, Inc",
      "city_name": "San Francisco",
      "country_name": "United States",
      "country_code2": "US",
      "dma_code": 807,
      "country_code3": "US",
      "region_name": "California",
      "location": {
        "lon": -122.4156,
        "lat": 37.7484
      },
      "autonomous_system": "Automattic, Inc (2635)",
      "postal_code": "94110",
      "asn": 2635,
      "region_code": "CA",
      "longitude": -122.4156
    },
    "@version": "1",
    "host": "REDACTED",
    "geoip_dst": {
      "timezone": "America/Los_Angeles",
      "ip": "192.0.73.2",
      "latitude": 37.7484,
      "continent_code": "NA",
      "as_org": "Automattic, Inc",
      "city_name": "San Francisco",
      "country_name": "United States",
      "country_code2": "US",
      "dma_code": 807,
      "country_code3": "US",
      "region_name": "California",
      "location": {
        "lon": -122.4156,
        "lat": 37.7484
      },
      "autonomous_system": "Automattic, Inc (2635)",
      "postal_code": "94110",
      "asn": 2635,
      "region_code": "CA",
      "longitude": -122.4156
    },
    "geoip_src": {
      "autonomous_system": "PRIVATE"
    },
    "type": "netflow",
    "tags": [
      "__netflow_direction_not_recognized"
    ]
  },
  "fields": {
    "@timestamp": [
      1511857548000
    ]
  },
  "sort": [
    1511857548000
  ]
}

This works on pf/opnsense very well, any advice on getting Cisco to play ball with it (or more likely the other way around) would be appreciated.

Visualizations broken (for ASA NetFlow) on 5.6.2

This is likely related to #22 in terms of missing fields (even with #23, there are no packet counts for instance), but i'm seeing fun vis corruption in everything that has concentric circular maps like what you see in the pasteboard link.
@robcowart: any thoughts on the relationships in the vis/queries which could cause this? Ever see something like this before? We use ELK for a lot of stuff, and this is a first on K5.X.

How much can this handle?

Hello, just came across this project and it looks promising. Wanted to ask how much data can it handle to be still fast enough?

Let's say I want to search for top servers and have 1TB of flow data. How fast can I expect it to find them? I know it's very vague question but just approximatelly, whether it would be seconds, hours or days?

Issue with timestamp?

Hi

I'm not sure if this is an issue with logstash, elasticsearch or kibana but I'm basically pulling in netflow records from my home router onto a VM where I'm testing elastiflow.

The timestamp on the records however are +2 hours from the actual time.

The router is set to sync with a local ntp server so router time is correct. The VM also has the correct time. Any idea where/how the time conversion is happening?

Logstsah reporting "IPv6 address must be 16 bytes"

from time to time getting a logstash crash saying:

[2018-02-25T18:21:36,851][FATAL][logstash.runner ] An unexpected error occurred! {:error=>#<ArgumentError: IPv6 address must be 16 bytes>, :backtrace=>["uri:classloader:/META-INF/jruby.home/lib/ruby/stdlib/resolv.rb:2502:in `initialize'", "uri:classloader:/META-INF/jruby.home/lib/ruby/stdlib/resolv.rb:2242:in `decode_rdata'", "uri:classloader:/META-INF/jruby.home/lib/ruby/stdlib/resolv.rb:1649:in `block in get_rr'", "uri:classloader:/META-INF/jruby.home/lib/ruby/stdlib/resolv.rb:1547:in `get_length16'", "uri:classloader:/META-INF/jruby.home/lib/ruby/stdlib/resolv.rb:1649:in `get_rr'", "uri:classloader:/META-INF/jruby.home/lib/ruby/stdlib/resolv.rb:1524:in `block in decode'", "org/jruby/RubyRange.java:485:in `each'", "uri:classloader:/META-INF/jruby.home/lib/ruby/stdlib/resolv.rb:1523:in `block in decode'", "uri:classloader:/META-INF/jruby.home/lib/ruby/stdlib/resolv.rb:1536:in `initialize'", "uri:classloader:/META-INF/jruby.home/lib/ruby/stdlib/resolv.rb:1500:in `decode'", "uri:classloader:/META-INF/jruby.home/lib/ruby/stdlib/resolv.rb:710:in `request'", "uri:classloader:/META-INF/jruby.home/lib/ruby/stdlib/resolv.rb:536:in `block in fetch_resource'", "uri:classloader:/META-INF/jruby.home/lib/ruby/stdlib/resolv.rb:1108:in `block in resolv'", "org/jruby/RubyArray.java:1734:in `each'", "uri:classloader:/META-INF/jruby.home/lib/ruby/stdlib/resolv.rb:1106:in `block in resolv'", "org/jruby/RubyArray.java:1734:in `each'", "uri:classloader:/META-INF/jruby.home/lib/ruby/stdlib/resolv.rb:1105:in `block in resolv'", "org/jruby/RubyArray.java:1734:in `each'", "uri:classloader:/META-INF/jruby.home/lib/ruby/stdlib/resolv.rb:1103:in `resolv'", "uri:classloader:/META-INF/jruby.home/lib/ruby/stdlib/resolv.rb:527:in `fetch_resource'", "uri:classloader:/META-INF/jruby.home/lib/ruby/stdlib/resolv.rb:517:in `each_resource'", "uri:classloader:/META-INF/jruby.home/lib/ruby/stdlib/resolv.rb:471:in `each_name'", "uri:classloader:/META-INF/jruby.home/lib/ruby/stdlib/resolv.rb:154:in `block in each_name'", "org/jruby/RubyArray.java:1734:in `each'", "uri:classloader:/META-INF/jruby.home/lib/ruby/stdlib/resolv.rb:153:in `each_name'", "uri:classloader:/META-INF/jruby.home/lib/ruby/stdlib/resolv.rb:135:in `getname'", "/usr/share/logstash/vendor/bundle/jruby/2.3.0/gems/logstash-filter-dns-3.0.7/lib/logstash/filters/dns.rb:279:in `getname'", "/usr/share/logstash/vendor/bundle/jruby/2.3.0/gems/logstash-filter-dns-3.0.7/lib/logstash/filters/dns.rb:266:in `block in retriable_getname'", "/usr/share/logstash/vendor/bundle/jruby/2.3.0/gems/logstash-filter-dns-3.0.7/lib/logstash/filters/dns.rb:251:in `block in retriable_request'", "org/jruby/ext/timeout/Timeout.java:117:in `timeout'", "/usr/share/logstash/vendor/bundle/jruby/2.3.0/gems/logstash-filter-dns-3.0.7/lib/logstash/filters/dns.rb:250:in `retriable_request'", "/usr/share/logstash/vendor/bundle/jruby/2.3.0/gems/logstash-filter-dns-3.0.7/lib/logstash/filters/dns.rb:265:in `retriable_getname'", "/usr/share/logstash/vendor/bundle/jruby/2.3.0/gems/logstash-filter-dns-3.0.7/lib/logstash/filters/dns.rb:211:in `block in reverse'", "org/jruby/RubyArray.java:1734:in `each'", "/usr/share/logstash/vendor/bundle/jruby/2.3.0/gems/logstash-filter-dns-3.0.7/lib/logstash/filters/dns.rb:183:in `reverse'", "/usr/share/logstash/vendor/bundle/jruby/2.3.0/gems/logstash-filter-dns-3.0.7/lib/logstash/filters/dns.rb:99:in `filter'", "/usr/share/logstash/logstash-core/lib/logstash/filters/base.rb:145:in `do_filter'", "/usr/share/logstash/logstash-core/lib/logstash/filters/base.rb:164:in `block in multi_filter'", "org/jruby/RubyArray.java:1734:in `each'", "/usr/share/logstash/logstash-core/lib/logstash/filters/base.rb:161:in `multi_filter'", "/usr/share/logstash/logstash-core/lib/logstash/filter_delegator.rb:47:in `multi_filter'", "(eval):316506:in `block in initialize'", "org/jruby/RubyArray.java:1734:in `each'", "(eval):316503:in `block in initialize'", "(eval):316521:in `block in initialize'", "org/jruby/RubyArray.java:1734:in `each'", "(eval):316517:in `block in initialize'", "(eval):13125:in `block in filter_func'", "/usr/share/logstash/logstash-core/lib/logstash/pipeline.rb:447:in `filter_batch'", "/usr/share/logstash/logstash-core/lib/logstash/pipeline.rb:426:in `worker_loop'", "/usr/share/logstash/logstash-core/lib/logstash/pipeline.rb:385:in `block in start_workers'"]}

Unfortunately I can't have a clue where to start searching except the "message saying: <ArgumentError: IPv6 address must be 16 bytes>

Thanks

Enhancements to handle bi-directional flows from Cisco ASA devices.

This issue is to consolidate the following issues and PRs...

#1 not all fields filled
#18 "netflow.last_switched" - How to insert info Time Filter Field
#21 Add combining fwd_flow_delta_bytes rev_flow_delta_bytes into netflow.bytes
#22 Cisco ASA Netflow Missing "switched" and other fields
#23 Implement byte and flow time conversions for ASA
#25 Visualizations broken (for ASA NetFlow) on 5.6.2

[Query] Performance impact of geo lookup

Hi,
I'm fairly new to ELK and netflow, I was taking a look at your implementation. Going by the official documentation about geo ip lookup, it's been stated that the cost is quite expensive.
I would like to understand if it has any noticeable impact when implemented - like in this project. Are there any metrics that you have benchmarked, with and without the geo ip lookup?

Enhancement: Populate interface name from ifIndex

I think it would be beneficial to populate the interface name. There are a couple of ways to accomplish this, and not sure how robust the logstash ruby plugin is, but polling SNMP + Caching response for a time might be one way to accomplish this.

Nginx Load Balace and the host (Flow Exporters)

Configured for balancing data between three logstash nginx.

But when the data began to be recorded as sent from the nginx and not from the real IP address (exporters).

Tell me how you can get out of the situation? can the filter have the ability to correct where the data comes from?

There may be established practice of balancing between logstash?

Enhancement: AS-PATH

I think it would be nice, if you have BGP available on your devices, to also add the AS-PATH into the flow data, similar to the Geo-IP.

You would need to have something to dump BGP data into something readable, however like a json file to read. My thoughts would be to have this as an optional enhancement, and just point it to a well structured file that has the data to be parsed. How you update the data is up to you.

Credit: fall0ut & pyvpx on freenode

Adding support for Netflow field 130 (EXPORTER_IPV4_ADDRESS) for Flow Exporters Dashboard

We just switched to using nProbe as a NetFlow proxy for ElastiFlow due to NetFlow Lite support. (#43)

But, unfortunately the Dashboard for Flow Exporters use "node.hostname" field as source, using the field "netflow.exporterIPv4Address" instead should then show the correct exporter address when using a proxy for netflow data.

I'm not familiar enough with the ELK stack do customize it for myself, but hopefully there is a way to customize the dashboard to use netflow.exporterIPv4Address if it is populated with a valid IPv4 address, and use node.hostname if netflow.exporterIPv4Address is empty or does not exist?

Example of a flow with the field populated:

{
  "_index": "elastiflow-2018.02.14.11",
  "_type": "logs",
  "_id": "AWGUHKuxe_dScKHHHSNY",
  "_version": 1,
  "_score": null,
  "_source": {
    "node": {
      "ipaddr": "127.0.0.1",
      "hostname": "127.0.0.1"
    },
    "netflow": {
      "icmp_type": 0,
      "dst_as": 0,
      "max_ttl": 0,
      "in_pkts": 50,
      "ip_protocol_version": 4,
      "first_switched": "2018-02-14T11:39:19.000Z",
      "flowset_id": 257,
      "l4_src_port": 161,
      "ipv4_next_hop": "0.0.0.0",
      "min_ttl": 0,
      "postDot1qVlanId": 0,
      "src_vlan": 0,
      "in_bytes": 4600,
      "protocol": 17,
      "tcp_flags": 0,
      "out_bytes": 0,
      "dst_vlan": 0,
      "l4_dst_port": 61132,
      "src_as": 0,
      "output_snmp": 10148,
      "exporterIPv4Address": "192.168.0.69",
      "dst_mask": 0,
      "src_tos": 0,
      "ipv4_dst_addr": "x.x.x.140",
      "in_dst_mac": "a4:6c:2a:d7:02:0d",
      "src_mask": 0,
      "version": 9,
      "dot1qVlanId": 0,
      "flow_seq_num": 66411,
      "ipv4_src_addr": "x.x.x.251",
      "in_src_mac": "x:x:x::21:8c",
      "input_snmp": 1,
      "last_switched": "2018-02-14T11:39:19.000Z",
      "out_pkts": 0
    },
    "@timestamp": "2018-02-14T11:39:19.000Z",
    "@version": "1",
    "event": {
      "host": "127.0.0.1",
      "type": "netflow"
    },
    "flow": {
      "dst_hostname": "x.x.x.140",
      "dst_locality": "private",
      "geoip_dst": {
        "autonomous_system": "private"
      },
      "dst_mask_len": "0",
      "src_port_name": "UDP/161 (snmp)",
      "packets": 50,
      "ip_version": "IPv4",
      "vlan": "0",
      "service_locality": "private",
      "tcp_flags": "0",
      "next_hop": "0.0.0.0",
      "geoip_client": {
        "autonomous_system": "private"
      },
      "dst_addr": "x.x.x.140",
      "dst_port_name": "UDP/61132",
      "tos": "0",
      "traffic_locality": "private",
      "direction": "undetermined",
      "output_snmp": "10148",
      "src_mac": "x:x:x:x:x",
      "src_locality": "private",
      "geoip": {
        "autonomous_system": "private"
      },
      "tcp_flags_label": "none",
      "src_mask_len": "0",
      "service_name": "UDP/161 (snmp)",
      "src_addr": "x.x.x.251",
      "geoip_src": {
        "autonomous_system": "private"
      },
      "client_locality": "private",
      "server_addr": "x.x.x.251",
      "ip_protocol": 17,
      "dst_mac": "x:x:x:x:x",
      "server_hostname": "x.x.x.251",
      "src_port": 161,
      "server_locality": "private",
      "input_snmp": "1",
      "bytes": 4600,
      "client_hostname": "x.x.x.140",
      "ip_protocol_name": "UDP",
      "dst_port": 61132,
      "client_addr": "x.x.x.140",
      "geoip_server": {
        "autonomous_system": "private"
      },
      "tcp_flag_tags": [],
      "src_hostname": "x.x.x.251",
      "service_port": "161"
    },
    "tags": [
      "__netflow_direction_not_recognized"
    ]
  },
  "fields": {
    "@timestamp": [
      1518608359000
    ]
  },
  "sort": [
    1518608359000
  ]
}

not all fields filled

1st of all thank you for all of your work you put into this. I am just starting out to get some netflow information from our company firewall, a Cisco ASA 5515. I've followed your guide and am getting data into elasticsearch/kibana, but a lot of fields remain emty, for example netflow.bytes, netflow.first_switched and netflow.last_switched. Logstash generating a lot of warnings: [2017-08-07T08:34:49,804][WARN ][logstash.codecs.netflow ] Template length doesn't fit cleanly into flowset {:template_id=>263, :template_length=>86, :record_length=>64}

Support for IOS XR flow sample rate records

Hello,

Not really an issue and more of a question.

Currently, we do 1/1000 sampling and would like the values in elastiflow to represent the correct data volumes. How would we do that? For example, a value reads as 33.2MB should read as 33.2GB.

Thanks!

IPFIX support in Kibana dashboards

Many thanks for this project. I tried several netflow solutions before i found elastiflow. It perfectly fit my needs and furthermore it's slightly possible to modify it.
I saw, that logstash.conf was modified to integrate IPFIX flows as well. Are there already any plans to adapt Kibana dashboards to integrate IPFIX data ?
Regards,
Alex

conn_id template issue with ASA

The netflow.conn_id with a ASA is to long to fit inside a int, should be a long

_index"=>"netflow-2017.12.29", "_type"=>"doc", "_id"=>"tvt9oWAB1JbXfifRsXyx", "status"=>400, "error"=>{"type"=>"mapper_parsing_exception", "reason"=>"failed to parse [netflow.conn_id]", "caused_by"=>{"type"=>"json_parse_exception", "reason"=>"Numeric value (3863863726) out of range of int\n at [Source: org.elasticsearch.common.bytes.BytesReference$MarkSupportingStreamInputWrapper@599bbc1f; line: 1, column: 230]"}}}}}

    {
      "netflow.conn_id": {
        "path_match": "netflow.conn_id",
        "mapping": {
          "type": "long"
        }
      }
    },

With long this is tested and working

Maybe mistaken bug report, please review

I cannot understand whose this bug elastiflow or logstash.
In logs i see huge repeatedly messages:
[WARN ][logstash.outputs.elasticsearch] Could not index event to Elasticsearch. {:status=>400, :action=>["index", {:_id=>nil, :_index=>"elastiflow-2018.02.18", :_type=>"doc", :_routing=>nil}, #<LogStash::Event:0x73a7b610>], :response=>{"index"=>{"_index"=>"elastiflow-2018.02.18", "_type"=>"doc", "_id"=>"MByGp2EBu08NUWC7JEYT", "status"=>400, "error"=>{"type"=>"mapper_parsing_exception", "reason"=>"failed to parse [netflow.tcpOptions]", "caused_by"=>{"type"=>"json_parse_exception", "reason"=>"Numeric value (17293822569104482748) out of range of long (-9223372036854775808 - 9223372036854775807)\n at [Source: org.elasticsearch.common.bytes.BytesReference$MarkSupportingStreamInputWrapper@119006d0; line: 1, column: 1761]"}}}}}

[WARN ][logstash.codecs.netflow ] Template length exceeds flowset length, skipping {:template_id=>260, :template_length=>65, :record_length=>64}

and somewhat less often this messages:
[WARN ][logstash.codecs.netflow ] Received template 260 of size 61 bytes doesn't match BinData representation we built (65 bytes)
[WARN ][logstash.codecs.netflow ] Received template 263 of size 49 bytes doesn't match BinData representation we built (53 bytes)
[WARN ][logstash.codecs.netflow ] Template length exceeds flowset length, skipping {:template_id=>263, :template_length=>53, :record_length=>52}

  • logstash 6.2.1 / logstash-codec-netflow (3.11.2):
  • Debian 8.10 3.16.0-4-amd64 #1 SMP Debian 3.16.7-ckt25-2+deb8u3 (2016-07-02):
  • Device ipt_NETFLOW master branch (https://github.com/aabc/ipt-netflow)
  • Run Logstash and view the log file

Tshark pcap dump in attach.
Thanks a lot!
tshark.zip

Feature Request: SFlow integration/documentation

The current setup is geared toward reading NetFlow v5,9,10.
Using the sflow input codec, samples can be taken from Arista and other gear utilizing the protocol, but the fields seem to be a bit different than what we see with NefFlow.
When running the input through the filter provided here, the resulting JSON seems unaffected by the filter:

{
  "_index": "sflow-2017.12.03",
  "_type": "sflow",
  "_id": "AWAbQysCHdzTBuJ68aUw",
  "_version": 1,
  "_score": null,
  "_source": {
    "output_discarded_packets": "0",
    "interface_index": "7",
    "source_id_type": "0",
    "input_octets": "11006760680",
    "input_multicast_packets": "0",
    "output_packets": "522058871",
    "type": "sflow",
    "uptime_in_ms": "226000",
    "sflow_type": "counter_sample",
    "promiscous_mode": "0",
    "input_unknown_protocol_packets": "0",
    "sub_agent_id": "0",
    "ip_version": "1",
    "input_broadcast_packets": "43073",
    "input_errors": "0",
    "output_octets": "633039097373",
    "@version": "1",
    "host": "10.2.3.4",
    "interface_speed": "1000000000",
    "interface_type": "6",
    "interface_status": "3",
    "input_packets": "143265665",
    "output_multicast_packets": "530900",
    "interface_direction": "1",
    "agent_ip": "10.2.3.4",
    "sample_seq_number": "113",
    "@timestamp": "2017-12-03T07:24:34.857Z",
    "source_id_index": "7",
    "input_discarded_packets": "0",
    "output_errors": "0",
    "output_broadcast_packets": "15449120"
  },
  "fields": {
    "@timestamp": [
      1512285874857
    ]
  },
  "sort": [
    1512285874857
  ]
}

@robcowart: any chance you might have sflow field translations hiding somewhere in an unfinished commit? :)
It looks like we have the basics here - iface, bytes in, byte out, packets in, packets out, but we dont have flow IDs from what i can see, unless the sample_seq_number is it. Probably want to have translations for the iface type and status, since the snmp interface options in the codec appear to cause the enture pipeline to stall (without logging an issue, obviously).

Change elasticsearch template for netflow.*_snmp type to long

The current template use "integer" for netflow.input_snmp and netflow.output_snmp.

This should be changed to "long" type.

We have some 2960X switches in a stack which overflows the limits for integer:

[2018-02-13T14:53:02,803][WARN ][logstash.outputs.elasticsearch] Could not index event to Elasticsearch. {:status=>400, :action=>["index", {:_id=>nil, :_index=>"elastiflow-2018.02.13", :_type=>"logs", :_routing=>nil}, 2018-02-13T13:53:02.000Z %{host} %{message}], :response=>{"index"=>{"_index"=>"elastiflow-2018.02.13", "_type"=>"logs", "_id"=>"AW", "status"=>400, "error"=>{"type"=>"mapper_parsing_exception", "reason"=>"failed to parse [netflow.output_snmp]", "caused_by"=>{"type"=>"json_parse_exception", "reason"=>"Numeric value (4012146348) out of range of int\n at [Source: org.elasticsearch.common.bytes.BytesReference$MarkSupportingStreamInputWrapper@728b2e66; line: 1, column: 92]"}}}}}
[2018-02-13T14:53:02,803][WARN ][logstash.outputs.elasticsearch] Could not index event to Elasticsearch. {:status=>400, :action=>["index", {:_id=>nil, :_index=>"elastiflow-2018.02.13", :_type=>"logs", :_routing=>nil}, 2018-02-13T13:53:02.000Z %{host} %{message}], :response=>{"index"=>{"_index"=>"elastiflow-2018.02.13", "_type"=>"logs", "_id"=>"AW", "status"=>400, "error"=>{"type"=>"mapper_parsing_exception", "reason"=>"failed to parse [netflow.output_snmp]", "caused_by"=>{"type"=>"json_parse_exception", "reason"=>"Numeric value (4033195029) out of range of int\n at [Source: org.elasticsearch.common.bytes.BytesReference$MarkSupportingStreamInputWrapper@65655048; line: 1, column: 92]"}}}}}

Patch:

@@ -7477,7 +7477,7 @@
           "netflow.input_snmp": {
             "path_match": "netflow.input_snmp",
             "mapping": {
-              "type": "integer"
+              "type": "long"
             }
           }
         },
@@ -7757,7 +7757,7 @@
           "netflow.output_snmp": {
             "path_match": "netflow.output_snmp",
             "mapping": {
-              "type": "integer"
+              "type": "long"
             }
           }
         },

geoip, geoip_src, geoip_dst

Hi Rob,

I was looking at the geo content pertaining to the netflow data. I've noticed that some flow records have data under geoip and some under geoip_dst, some under geoip_src. I would like to know the difference between geoip and geoip_dst / geoip_src. If I want to to filter out traffic that is headed to China as an eg, do I just look at geoip_dst.country_name? Also, what causes them to be missing in some flows?

Thanks.

Cannot import visualizations using the elastiflow.kibana.json file

Hi

I'm a beginner at the elastic stack but I've managed to make it as far as getting logstash and elasticsearch setup. The flow records are pulled into logstash from my home router and then indexed out to elasticsearch. Kibana can also see the elasticsearch records fine but when I try to import the json file that contains the visualizations and dashboards, it seems that only the Timelion visualizations are pulled in, it throws an error on everything else that's not Timelion i.e. piecharts etc.

Here's what the error looks like in Kibana.

Any ideas?

some visuals fail to import

Rob,
The effort you put into this is awesome! I've looked at the dashboards for several other projects (sof-elk and rocksnm) and I think you've nailed the Netflow visualization!
I'm using 5.6 ES and Kibana
The instructions specify building an index pattern, but not an index id of netflow-* once I built the index id to accompany the pattern I got most of the underlying searches, dashboards, installed but there were errors. When I look to the TOP-N dashboard, I see a placeholder for the visuals that didn't load. The Top Clients and Top Servers visuals are just one of many...
I can't find where your search parameters are listed, so I'm struggling a bit with the problem. Am I chasing a problem with terminology between the versions? Is SearchSourceJSON now savedSearchId?
I appreciate any advice or direction you have to offer.
harrison-

Issue with Kibana setup

I was following the guide in the README and have a problem with the following step:
`
Setting up Kibana
As of Kibana 5.6 an API (yet undocumented) is available to import and export Index Patterns. The JSON file which contains the Index Pattern configuration is kibana/elastiflow.index_pattern-json. To setup the elastiflow-* Index Pattern run the following command:

curl -X POST -u USERNAME:PASSWORD http://KIBANASERVER:5601/api/saved_objects/index-pattern/elastiflow-* -H
`

When i run the curl command i get :

{"statusCode":400,"error":"Bad Request","message":"Invalid request payload JSON format"}

Not sure whats the issue here.

Netflow does not parse at all -logstash errors

Dashboards and index patterns are visible. But no Netflow data reaches or visible into kibana. Ran TCpdump the netflow sensor is sending over the UDP packets.

root@ELK-Netflow:/usr/share/logstash# tail -f /var/log/logstash/logstash-plain.log
[2018-02-12T19:13:50,917][INFO ][logstash.runner ] Starting Logstash {"logstash.version"=>"6.2.1"}
[2018-02-12T19:13:50,996][INFO ][logstash.config.source.local.configpathloader] No config files found in path {:path=>"/etc/logstash/conf.d/.conf"}
[2018-02-12T19:13:51,001][ERROR][logstash.config.sourceloader] No configuration found in the configured sources.
[2018-02-12T19:13:51,029][INFO ][logstash.agent ] Successfully started Logstash API endpoint {:port=>9600}
[2018-02-12T19:14:08,232][INFO ][logstash.modules.scaffold] Initializing module {:module_name=>"netflow", :directory=>"/usr/share/logstash/modules/netflow/configuration"}
[2018-02-12T19:14:08,240][INFO ][logstash.modules.scaffold] Initializing module {:module_name=>"fb_apache", :directory=>"/usr/share/logstash/modules/fb_apache/configuration"}
[2018-02-12T19:14:08,719][INFO ][logstash.runner ] Starting Logstash {"logstash.version"=>"6.2.1"}
[2018-02-12T19:14:08,794][INFO ][logstash.config.source.local.configpathloader] No config files found in path {:path=>"/etc/logstash/conf.d/
.conf"}
[2018-02-12T19:14:08,795][ERROR][logstash.config.sourceloader] No configuration found in the configured sources.
[2018-02-12T19:14:08,820][INFO ][logstash.agent ] Successfully started Logstash API endpoint {:port=>9600}

"netflow.last_switched" - How to insert info Time Filter Field

Trying to get Elastiflow v1.1.2 runnng but not quite there yet:
I've reviewed the README.md, so I'll share my progress:

  1. Able to get the logstash-filter-translate / logstash-filter-cidr plugins installed - no issue.
  2. Elastiflow-1.1.2.tar.gz compressed foldter contents copied to /etc/logstash/ = no issue.
  3. I've added the enviroment variables to my /etc/environment and printenv shows them active after reboot:

ELASTIFLOW_NETFLOW_PORT=2055
ELASTIFLOW_ES_HOST=127.0.0.1:9200
ELASTIFLOW_ES_USER=elastic
ELASTIFLOW_ES_PASSWD=changeme
ELASTIFLOW_GEOIP_DB_PATH=/etc/logstash/geoipdbs
ELASTIFLOW_DICT_PATH=/etc/logstash/dictionaries
ELASTIFLOW_TEMPLATE_PATH=/etc/logstash/templates

(I'm assuming I need to change the following to my actual user account I log into Kibana with?:

ELASTIFLOW_ES_USER=elasticadmin
ELASTIFLOW_ES_PASSWD=mysecretpassword

And make the same username/password change to 30_output.logstash.conf?

  1. Have not been able to get "netflow.last_switched" to be in placed in the "Time Filter field name", seems there is no option for it, always wants to default @timestamp or circle with a line through it.

I've been trying to use the advanced options with:

Index pattern = netflow-*
Index pattern ID = netflow-*
Time Filter filed name (always wants to use

I know netflow traffic is getting to my ELK because if I use

Index pattern = netflow-*
Time Filter filed name = timestamp@
(I'm able to see records in Kibana/Discover.)

Any hints greatly appreciated!

feature (?) request: host groups

Hello all,

I am pretty new to ELK but i am using elastiflow for netflow analysis.
I was wondering if it is possible in ELK/Kibana/Elastiflow (or maybe Grafana ?) to define "host groups" ie a group of server ip addresses and define that as (for example) "Domain Controllers" and then re-use this name in the search or dashboards and run statistics on this group instead of re-typing each time the list of ips. I know ELK supports "aggregations" and this seems a little like it (aggregating statistics per group), but i am not sure how this works in the search fields. Any help or reference to a doc, would be helpfull. Thanks,

Indices' size too big (?)

Hello,

We have been using your program at the company I work for, for a couple of days now, gathering NetFlow data from our core router. The thing is, I see the data growing at a rate of ~1GB/hour, which, having not engaged with elasticsearch before, seems a lot to me. Is this behavior normal? I can provide all sorts of logs and data if needed.

Thank you

Dashboards for Graph

Great project, thank you so much for this. I would like to request the graph analyzer you have covered in your article translated to x-pack's graph. So we can import it along with the Dashboard's provided. Thank you.

GEO IP for intranet network

How can the geo-location be linked to IP addresses from the private of the network (10.x.x.x)?

I have lists of correspondence IP address and longitude / latitude, that's just where to put them in the filter?

What are service fields?

Hi Rob,

I was going through the ES data that has been collected. I'm looking to querying those flows who are not conforming to either HTTP or HTTPS. For the sake of this, I was looking at netflow.dst_port alone, to fall under 80 or 443.
I noticed that the netflow.dst_port keeps varying (other than, 80/443) yet, the netflow.service_port seems to read 443 or 80, based on either netflow.src_port or netflow.dst_port. In light of this,

  1. What does it mean exactly? Does it mean that if service_port is 80 or 443, it was a http/https flow between my machine and elsewhere?
  2. Could you please briefly explain the below logic.

I am looking at the below code snippet from the logstash filter file where in you have the logic of populating the service fields:

        # Set client, server and service fields.
        if [@metadata][isServer] == "dst" {
            mutate {
                id => "netflow-postproc-dstIsSrv-add-fields"
                add_field => {
                    "[netflow][server_addr]" => "%{[netflow][dst_addr]}"
                    "[netflow][service_name]" => "%{[netflow][dst_port_name]}"
                    "[netflow][service_port]" => "%{[netflow][dst_port]}"
                    "[netflow][client_addr]" => "%{[netflow][src_addr]}"
                }
            }
        } else if [@metadata][isServer] == "src" {
            mutate {
                id => "netflow-postproc-srcIsSrv-add-fields"
                add_field => {
                    "[netflow][server_addr]" => "%{[netflow][src_addr]}"
                    "[netflow][service_name]" => "%{[netflow][src_port_name]}"
                    "[netflow][service_port]" => "%{[netflow][src_port]}"
                    "[netflow][client_addr]" => "%{[netflow][dst_addr]}"
                }
            }
        }
    }

ERROR: Exception in inputworker(End of file reached)[SOLVED]

Hello,

I'm using the last version of source and getting this error on logstash log causing the program's "core":

`[ERROR][logstash.inputs.udp]

Exception in inputworker {"exception"=>#<EOFError: End of file reached>,

"backtrace"=>["/usr/share/logstash/vendor/bundle/jruby/2.3.0/gems/bindata-2.4.1/lib/bindata/io.rb:314:in 'read'",

"/usr/share/logstash/vendor/bundle/jruby/2.3.0/gems/bindata-2.4.1/lib/bindata/io.rb:333:in 'accumulate_big_endian_bits'",

"/usr/share/logstash/vendor/bundle/jruby/2.3.0/gems/bindata-2.4.1/lib/bindata/io.rb:322:in 'read_big_endian_bits'",

"/usr/share/logstash/vendor/bundle/jruby/2.3.0/gems/bindata-2.4.1/lib/bindata/io.rb:295:in 'readbits'",

"(eval):30:in 'read_and_return_value'",

"/usr/share/logstash/vendor/bundle/jruby/2.3.0/gems/bindata-2.4.1/lib/bindata/base_primitive.rb:129:in 'do_read'",

"/usr/share/logstash/vendor/bundle/jruby/2.3.0/gems/bindata-2.4.1/lib/bindata/struct.rb:139:in 'block in do_read'",

"org/jruby/RubyArray.java:1734:in 'each'",

"/usr/share/logstash/vendor/bundle/jruby/2.3.0/gems/bindata-2.4.1/lib/bindata/struct.rb:139:in 'do_read'",

"(eval):2:in 'do_read'",

"/usr/share/logstash/vendor/bundle/jruby/2.3.0/gems/bindata-2.4.1/lib/bindata/struct.rb:139:in 'block in do_read'",

"org/jruby/RubyArray.java:1734:in 'each'",

"/usr/share/logstash/vendor/bundle/jruby/2.3.0/gems/bindata-2.4.1/lib/bindata/struct.rb:139:in 'do_read'",

"(eval):2:in 'do_read'",

"/usr/share/logstash/vendor/bundle/jruby/2.3.0/gems/bindata-2.4.1/lib/bindata/struct.rb:139:in 'block in do_read'",

"org/jruby/RubyArray.java:1734:in 'each'",

"/usr/share/logstash/vendor/bundle/jruby/2.3.0/gems/bindata-2.4.1/lib/bindata/struct.rb:139:in 'do_read'",

"(eval):2:in 'do_read'",

"/usr/share/logstash/vendor/bundle/jruby/2.3.0/gems/bindata-2.4.1/lib/bindata/struct.rb:139:in 'block in do_read'",

"org/jruby/RubyArray.java:1734:in 'each'",

"/usr/share/logstash/vendor/bundle/jruby/2.3.0/gems/bindata-2.4.1/lib/bindata/struct.rb:139:in 'do_read'",

"(eval):2:in 'do_read'",

"/usr/share/logstash/vendor/bundle/jruby/2.3.0/gems/bindata-2.4.1/lib/bindata/struct.rb:139:in 'block in do_read'",

"org/jruby/RubyArray.java:1734:in 'each'",

"/usr/share/logstash/vendor/bundle/jruby/2.3.0/gems/bindata-2.4.1/lib/bindata/struct.rb:139:in 'do_read'",

"(eval):2:in 'do_read'",

"/usr/share/logstash/vendor/bundle/jruby/2.3.0/gems/bindata-2.4.1/lib/bindata/struct.rb:139:in 'block in do_read'",

"org/jruby/RubyArray.java:1734:in 'each'",

"/usr/share/logstash/vendor/bundle/jruby/2.3.0/gems/bindata-2.4.1/lib/bindata/struct.rb:139:in 'do_read'",

"/usr/share/logstash/vendor/bundle/jruby/2.3.0/gems/bindata-2.4.1/lib/bindata/array.rb:322:in 'block in do_read'",

"org/jruby/RubyArray.java:1734:in 'each'",

"/usr/share/logstash/vendor/bundle/jruby/2.3.0/gems/bindata-2.4.1/lib/bindata/array.rb:322:in 'do_read'",

"/usr/share/logstash/vendor/bundle/jruby/2.3.0/gems/bindata-2.4.1/lib/bindata/struct.rb:139:in 'block in do_read'",

"org/jruby/RubyArray.java:1734:in 'each'",

"/usr/share/logstash/vendor/bundle/jruby/2.3.0/gems/bindata-2.4.1/lib/bindata/struct.rb:139:in 'do_read'",

"/usr/share/logstash/vendor/bundle/jruby/2.3.0/gems/bindata-2.4.1/lib/bindata/base.rb:147:in 'block in read'",

"/usr/share/logstash/vendor/bundle/jruby/2.3.0/gems/bindata-2.4.1/lib/bindata/base.rb:254:in 'start_read'",

"/usr/share/logstash/vendor/bundle/jruby/2.3.0/gems/bindata-2.4.1/lib/bindata/base.rb:145:in 'read'",

"/usr/share/logstash/vendor/bundle/jruby/2.3.0/gems/bindata-2.4.1/lib/bindata/base.rb:21:in 'read'",

"/usr/share/logstash/vendor/bundle/jruby/2.3.0/gems/logstash-codec-sflow-2.0.0/lib/logstash/codecs/sflow.rb:105:in 'decode'",

"/usr/share/logstash/vendor/bundle/jruby/2.3.0/gems/logstash-input-udp-3.2.1/lib/logstash/inputs/udp.rb:133:in 'inputworker'",

"/usr/share/logstash/vendor/bundle/jruby/2.3.0/gems/logstash-input-udp-3.2.1/lib/logstash/inputs/udp.rb:102:in 'block in udp_listener'"]}`

How to restart the service when the error occurs automatically?

How to sFlow

You mention sFlow in your LinkedIn article, but I don't see any mention of it here. How can I configure sflow to work with your filters/dashboard?

I tried a very simplistic approach without success :D

Netflow from different IP subnets

Hi Rob,

logstash-codec-netflow version: 3.6.0

If the netflow collector and the machine running logstash are running on the same IP subnet, logstash (and effectively the codec) does not have any problem in receiving the netflow data, parsing them and storing them in elastic search. However, issue arises when the netflow collector is in a different subnet than that of the machine running logstash. (eg. If the collector is on a 192.x.x.x network while the logstash machine is hosted on a 172.x.x.x network)

What seems to be very suspicious is that when they are on different subnets, logs don't even indicate that they are picking up the netflow packets, let alone rejecting them - the debug logs don't show anything happening.

Note: There is no problem pertaining to network reachability between the two machines as the netflow packets are indeed being received in the logstash machine when checked from wireshark.

I looked through the config files but could not determine what might cause such an issue. Is there any config pertaining to the pipeline regarding the above scenario? Or is it something else?

Thanks.

Feature request: Graph Analyzer

In your article "WTFlow?! Are you really still paying for commercial solutions to collect and analyze network flow data?" you showed a Graph Analyzer dashboard. It would be really useful if you could make it work within Elastiflow.

try to import jason dashboard i get below error

curl -XPUT 192.168.1.75:9200/_bulk --data-binary @elastiflow.kibana.json
{"error":"Content-Type header [application/x-www-form-urlencoded] is not supported","status":406}root@ES6:~/b/elastiflow/kibana#

netflow.first_switched and last_switched have bad dates

Turned on flows last night. 20-AUG
first_switched and last_switched have date/time stamps from
August 10th.

This machine didn't exist on August 10th.

Juniper router has properly sync'd NTP clock
Same with the ELK server

logstash netflow template broken for elasticsearch 6.0+

Getting a lot of deprecated field errors trying to load the logstash netflow template. Begins with

elasticsearch.log-
[2017-11-17T09:47:17,034][DEBUG][o.e.a.a.i.t.p.TransportPutIndexTemplateAction] [LMhYXro] failed to put template [netflow
]
org.elasticsearch.index.mapper.MapperParsingException: Failed to parse mapping [default]: [include_in_all] is not allow
ed for indices created on or after version 6.0.0 as [_all] is deprecated. As a replacement, you can use an [copy_to] on m
apping fields to create your own catch all field.

removing include_in_all fields gives-
[2017-11-17T09:59:46,885][DEBUG][o.e.a.a.i.t.p.TransportPutIndexTemplateAction] [LMhYXro] failed to put template [netflow]
org.elasticsearch.index.mapper.MapperParsingException: Failed to parse mapping [default]: Enabling [_all] is disabled in 6.0. As a replacement, you can use [copy_to] on mapping fields to create your own catch all field.

then getting it to load gives (elasticsearch_deprecation.log)-

[2017-11-16T11:02:41,957][WARN ][o.e.d.a.a.i.t.p.PutIndexTemplateRequest] Deprecated field [template] used, replaced by [index_patterns]
[2017-11-16T11:24:10,728][WARN ][o.e.d.a.a.i.t.p.PutIndexTemplateRequest] Deprecated field [template] used, replaced by [index_patterns]
[2017-11-16T11:30:28,972][WARN ][o.e.d.a.a.i.t.p.PutIndexTemplateRequest] Deprecated field [template] used, replaced by [index_patterns]
[2017-11-16T14:23:03,886][WARN ][o.e.d.i.m.UidFieldMapper ] Fielddata access on the _uid field is deprecated, use _id instead
[2017-11-16T14:23:13,221][WARN ][o.e.d.i.m.UidFieldMapper ] Fielddata access on the _uid field is deprecated, use _id instead
[2017-11-17T09:38:29,039][WARN ][o.e.d.i.m.UidFieldMapper ] Fielddata access on the _uid field is deprecated, use _id instead
[2017-11-17T09:47:16,836][WARN ][o.e.d.a.a.i.t.p.PutIndexTemplateRequest] Deprecated field [template] used, replaced by [index_patterns]
[2017-11-17T09:59:46,826][WARN ][o.e.d.a.a.i.t.p.PutIndexTemplateRequest] Deprecated field [template] used, replaced by [index_patterns]
[2017-11-17T09:59:46,882][WARN ][o.e.d.i.m.AllFieldMapper ] [_all] is deprecated in 6.0+ and will be removed in 7.0. As a replacement, you can use [copy_to] on mapping fields to create your own catch all field.
[2017-11-17T10:01:29,260][WARN ][o.e.d.a.a.i.t.p.PutIndexTemplateRequest] Deprecated field [template] used, replaced by [index_patterns]
[2017-11-17T10:01:29,291][WARN ][o.e.d.i.m.MapperService ] [default] mapping is deprecated since it is not useful anymore now that indexes cannot have more than one type
[2017-11-17T10:05:38,520][WARN ][o.e.d.i.m.UidFieldMapper ] Fielddata access on the _uid field is deprecated, use _id instead

After more cleaning up, elasticsearch still isn't showing a netflow-* index. I suspect it's the last entry about _uid field but I've not written logstash templates and am more likely breaking than fixing at this point.

ERROR: Exception in inputworker[SOLVED]

Hello,

I'm using the last version of source and getting this error on logstash log:

[ERROR][logstash.inputs.udp ] Exception in inputworker {"exception"=>#<RangeError: integer 2297872384 too big to convert to int'>, "backtrace"=>["org/jruby/ext/stringio/StringIO.java:893:in seek'", "/usr/share/logstash/vendor/bundle/jruby/2.3.0/gems/bindata-2.4.1/lib/bindata/io.rb:111:in seek_raw'", "/usr/share/logstash/vendor/bundle/jruby/2.3.0/gems/bindata-2.4.1/lib/bindata/io.rb:37:in seek'", "/usr/share/logstash/vendor/bundle/jruby/2.3.0/gems/bindata-2.4.1/lib/bindata/io.rb:266:in seekbytes'", "/usr/share/logstash/vendor/bundle/jruby/2.3.0/gems/bindata-2.4.1/lib/bindata/skip.rb:75:in read_and_return_value'", "/usr/share/logstash/vendor/bundle/jruby/2.3.0/gems/bindata-2.4.1/lib/bindata/base_primitive.rb:129:in do_read'", "(eval):2:in do_read'", "/usr/share/logstash/vendor/bundle/jruby/2.3.0/gems/bindata-2.4.1/lib/bindata/struct.rb:139:in block in do_read'", "org/jruby/RubyArray.java:1734:in each'", "/usr/share/logstash/vendor/bundle/jruby/2.3.0/gems/bindata-2.4.1/lib/bindata/struct.rb:139:in do_read'", "/usr/share/logstash/vendor/bundle/jruby/2.3.0/gems/bindata-2.4.1/lib/bindata/array.rb:322:in block in do_read'", "org/jruby/RubyArray.java:1734:in each'", "/usr/share/logstash/vendor/bundle/jruby/2.3.0/gems/bindata-2.4.1/lib/bindata/array.rb:322:in do_read'", "/usr/share/logstash/vendor/bundle/jruby/2.3.0/gems/bindata-2.4.1/lib/bindata/struct.rb:139:in block in do_read'", "org/jruby/RubyArray.java:1734:in each'", "/usr/share/logstash/vendor/bundle/jruby/2.3.0/gems/bindata-2.4.1/lib/bindata/struct.rb:139:in do_read'", "/usr/share/logstash/vendor/bundle/jruby/2.3.0/gems/bindata-2.4.1/lib/bindata/base.rb:147:in block in read'", "/usr/share/logstash/vendor/bundle/jruby/2.3.0/gems/bindata-2.4.1/lib/bindata/base.rb:254:in start_read'", "/usr/share/logstash/vendor/bundle/jruby/2.3.0/gems/bindata-2.4.1/lib/bindata/base.rb:145:in read'", "/usr/share/logstash/vendor/bundle/jruby/2.3.0/gems/bindata-2.4.1/lib/bindata/base.rb:21:in read'", "/usr/share/logstash/vendor/bundle/jruby/2.3.0/gems/logstash-codec-sflow-2.0.0/lib/logstash/codecs/sflow.rb:105:in decode'", "/usr/share/logstash/vendor/bundle/jruby/2.3.0/gems/logstash-input-udp-3.2.1/lib/logstash/inputs/udp.rb:133:in inputworker'", "/usr/share/logstash/vendor/bundle/jruby/2.3.0/gems/logstash-input-udp-3.2.1/lib/logstash/inputs/udp.rb:102:in block in udp_listener'"]}

Also, I get this warm periodically

[WARN ][logstash.outputs.elasticsearch] Could not index event to Elasticsearch. {:status=>400, :action=>["index", {:_id=>nil, :_index=>"elastiflow-2018.02.06", :_type=>"doc", :_routing=>nil}, #<LogStash::Event:0x96dc47d>], :response=>{"index"=>{"_index"=>"elastiflow-2018.02.06", "_type"=>"doc", "_id"=>"DtmTbGEBEAOT3Lqa5UCs", "status"=>400, "error"=>{"type"=>"mapper_parsing_exception", "reason"=>"failed to parse [sflow.output_interface]", "caused_by"=>{"type"=>"illegal_argument_exception", "reason"=>"Value [2147483648] is out of range for an integer"}}}}}

Any ideas of what can cause this error?

Feature request: Dashboards for different netflow sources

Excellent job on the Elastiflow. This really competes with some of the professional solutions.
Wondering if you could give some pointer on how to realize the following.

With the netflow collector listening on UDP port 9995, it is possible to have multiple routers/switches/FWs send netflow exports to Elastiflow. This is also common practice with commercial products. It avoids having to do different port configs on devices and the collector.
Could you provide some pointers on how to easilly make dashboards for different netflow export sources?
This way it's easy to go directly into the details of a specific device's netflow analysis.

The same could be done for doing a dashboard for a specific interface on a netflow exporter, if the source device has multiple interfaces with Netflow export enabled?

Issue with Application ID from Fortigate Firewalls.

I am having an issue with NetFlow v9 from a FortiGate device. I have narrowed it down to the below error.

This is the actual output from the FortiGate for the application id:

20:53068615909376

While the template calls for an integer. When using a standard vanilla input filter for NetFlow it successfully consumes into elastisearch. Do you have any ideas on what I need to correct to make this function correctly?

Any assistance you have would be greatly appreciated.

This is the error from the logstash logs
[2017-10-16T11:51:59,840][WARN ][logstash.outputs.elasticsearch] Could not index event to Elasticsearch. {:status=>400, :action=>["index", {:_id=>nil, :_index=>"netflow-2017.10.16", :_type=>"netflow", :_routing=>nil}, 2017-10-16T15:45:25.000Z 10.10.240.50 %{message}], :response=>{"index"=>{"_index"=>"netflow-2017.10.16", "_type"=>"netflow", "_id"=>"AV8l4m6tGh0qZlWmKC7q", "status"=>400, "error"=>{"type"=>"mapper_parsing_exception", "reason"=>"failed to parse [netflow.application_id]", "caused_by"=>{"type"=>"number_format_exception", "reason"=>"For input string: \"20:53068615909376\""}}}}}

This is the output from the vanilla NetFlow config.
{ "_index": "t-netflow-2017.10.16", "_type": "netflow", "_id": "AV8mB_WpGh0qZlWmKrub", "_score": 1, "_source": { "@version": "1", "host": "10.10.240.50", "netflow": { "output_snmp": 12, "forwarding_status": { "reason": 0, "status": 1 }, "in_pkts": 1, "ipv4_dst_addr": "10.11.0.21", "first_switched": "2017-10-16T16:15:42.999Z", "flowset_id": 258, "l4_src_port": 57392, "version": 9, "application_id": "20:53068615909376", "flow_seq_num": 3311142, "ipv4_src_addr": "10.10.11.1", "in_bytes": 75, "protocol": 17, "flow_end_reason": 2, "last_switched": "2017-10-16T16:17:24.000Z", "input_snmp": 11, "out_pkts": 1, "out_bytes": 75, "l4_dst_port": 53 }, "@timestamp": "2017-10-16T16:17:23.000Z", "type": "netflow" }, "fields": { "netflow.first_switched": [ 1508170542999 ], "@timestamp": [ 1508170643000 ], "netflow.last_switched": [ 1508170644000 ] } }

Recommend Projects

  • React photo React

    A declarative, efficient, and flexible JavaScript library for building user interfaces.

  • Vue.js photo Vue.js

    🖖 Vue.js is a progressive, incrementally-adoptable JavaScript framework for building UI on the web.

  • Typescript photo Typescript

    TypeScript is a superset of JavaScript that compiles to clean JavaScript output.

  • TensorFlow photo TensorFlow

    An Open Source Machine Learning Framework for Everyone

  • Django photo Django

    The Web framework for perfectionists with deadlines.

  • D3 photo D3

    Bring data to life with SVG, Canvas and HTML. 📊📈🎉

Recommend Topics

  • javascript

    JavaScript (JS) is a lightweight interpreted programming language with first-class functions.

  • web

    Some thing interesting about web. New door for the world.

  • server

    A server is a program made to process requests and deliver data to clients.

  • Machine learning

    Machine learning is a way of modeling and interpreting data that allows a piece of software to respond intelligently.

  • Game

    Some thing interesting about game, make everyone happy.

Recommend Org

  • Facebook photo Facebook

    We are working to build community through open source technology. NB: members must have two-factor auth.

  • Microsoft photo Microsoft

    Open source projects and samples from Microsoft.

  • Google photo Google

    Google ❤️ Open Source for everyone.

  • D3 photo D3

    Data-Driven Documents codes.