Comments (17)
 robcowart
commented on June 13, 2024
1
robcowart
commented on June 13, 2024
1
Good catch. I will make the change. Thanks.
from elastiflow.
robcowart
commented on June 13, 2024
Actually it is an issue. I have been sent some sample data by a user so that I can create a fix. I was hoping to get to it this week, but it may slip to next week due to other projects. Stay tuned.
from elastiflow.
robcowart
commented on June 13, 2024
Fixed in this commit. Will be included in next release.
from elastiflow.
 skipper00
commented on June 13, 2024
skipper00
commented on June 13, 2024
Hi,
with Netflow v9, sapler information, has been exporter as meta-data, with an option-table, not included in data flow. In particular using Cisco IOS XR:
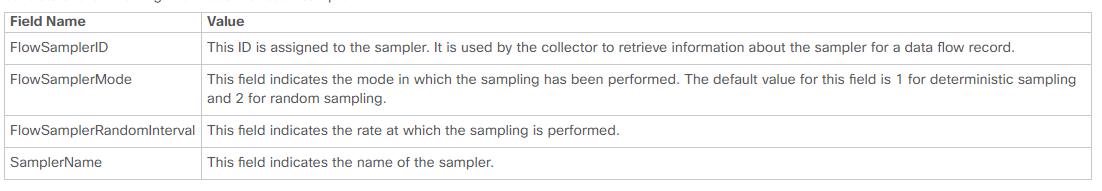
In my case, sampler (1:1024) table is exported every min, and correctly imported from netflow.flow_sampler_random_interval, in to index "netflow.sampler_interval".
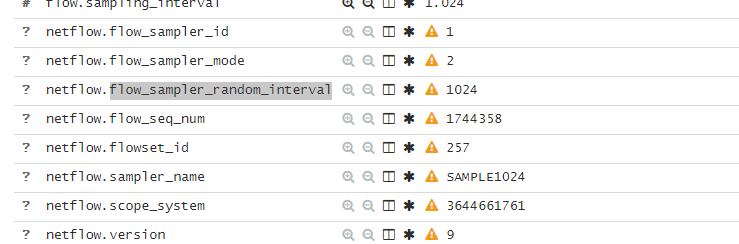
for this reason, [flow][sampling_interval] does not exist in data flow record, and the value of byte and pkt, still remain the same because it is always "0" for
if [flow][bytes] and [flow][sampling_interval] > 0
i think it shoud be exported, and be valuated every time a sapler-data flow is received, not for each data flow.
Example of sampler-data flow record:

Example of data flow record:

in semple term: my value still 33.2MB and not 33.2GB
I hope I explained myself :-)
from elastiflow.
robcowart
commented on June 13, 2024
I understand your issue. Unfortunately I don't think there is any way to solve this in a Logstash pipeline. It would have to be something that the netflow codec handles, similar to how it handles v9 templates. I would recommend opening an issue on logstash-codec-netflow here...
https://github.com/logstash-plugins/logstash-codec-netflow/issues
@jorritfolmer does a great job maintaining the codec, and it would be worth having him look at it. In the meantime I will reopen this issue here as this is worked through.
from elastiflow.
skipper00
commented on June 13, 2024
First of all, I have not yet congratulated, rob, for your work. Very good job!
now, back to our issue, it looks the same problem mentioned from jorritfolmer HERE.
In Netflow v9, data information and sampler info, are exported divided in two different record, Anyway using data flow, without keep in mind sampling it is useless unless sapler is 1:1.....
In my opinion I think is a best way, for now use an enviromer variable to value the sampler interval, as:
ELASTIFLOW_SAMPLER_INTERVAL
meanwhile we try to understand how to get the fields from different events together.
what do you think about?
from elastiflow.
 jorritfolmer
commented on June 13, 2024
jorritfolmer
commented on June 13, 2024
This sampler calculation logic, and other advanced operations on the netflow data, can be better implemented in an Elasticsearch script
Elasticsearch already has the relevant data, and supports simple and arbitrary complex operations on the data.
from elastiflow.
 jlixfeld
commented on June 13, 2024
jlixfeld
commented on June 13, 2024
Hey there all,
I'm a little confused about where this is at. I'm in the same position as @jnikoletich but I'm not sure if the resolution is something that @robcowart would implement in any way or if, as @jorritfolmer mentioned, using an Elasticsearch script is how this would ultimately get addressed?
from elastiflow.
robcowart
commented on June 13, 2024
I haven't had time to look at it yet. Sorry.
from elastiflow.
 telsin
commented on June 13, 2024
telsin
commented on June 13, 2024
Just FYI, I'm seeing the same thing with IPFIX templates/flow data. Just commenting to be sure it gets addressed in that pipeline as well.
from elastiflow.
 mrplow87
commented on June 13, 2024
mrplow87
commented on June 13, 2024
The manual sampling rate has only been applied to logstash/elastiflow/conf.d/20_filter_20_netflow.logstash.conf. Like @telsin, I see the same issue with IPFIX flow data from Juniper MX 480 devices.
Adding the workaround code you committed in 9a139c3 to elastiflow/conf.d/20_filter_30_ipfix.logstash.conf allows for correct values to be calculated.
from elastiflow.
 Ondjultomte
commented on June 13, 2024
Ondjultomte
commented on June 13, 2024
A question, does elasticflow extrapolate the sampled netflow rate to full/normal rate now ?
from elastiflow.
 mweinelt
commented on June 13, 2024
mweinelt
commented on June 13, 2024
@robcowart I can also confirm that applying the sampling dictionary (as described in #52 (comment)) to the ipfix filters in 3.4.1 gets sampling working for MX480 running JUNOS 16.1.
If you would be so kind as to apply this change there as well, as you intended in #52 (comment).
Thank you!
from elastiflow.
 scamp
commented on June 13, 2024
scamp
commented on June 13, 2024
Hi @robcowart , looks like workaround introduced in 9a139c3 does not work for flows with IPv6 entries received from NetFlow v9 exporter.
flow.sampling_interval is 0, regardless of setting in dictionary.
Flows with IPv4 entries work as expected, counters for bytes and packets are adjusted.
from elastiflow.
robcowart
commented on June 13, 2024
Is there anyone in this issue that can send me a PCAP of the options template and data from one of these flow sources? I want to make sure this is being handled properly in the new ElastiFlow Unified Flow Collector, but I need some data for testing. You can send to me directly at [email protected].
from elastiflow.
robcowart
commented on June 13, 2024
The limitations of Logstash complicate this issue. For example a dictionary of IP to sample rate mappings treats the IP as string, not an IP address type. This makes it challenging especially for the IPv6 addresses. The new ElastiFlow Unified Flow Collector handles this better. First it supports option data, so that the device can report on the sampling rates directly and the collector can adjust accordingly. When an external dictionary is used, the IP entries are handled as true IP address data types which ensures accurate matching of entries to the raw data. I recommend taking a look at the new collector.
from elastiflow.
robcowart
commented on June 13, 2024
This issue is being closed as this legacy version of ElastiFlow is now deprecated and is to be archived. Please try the new ElastiFlow, request a free Basic Tier license, and join the ElastiFlow Community Slack. Thank you.
from elastiflow.
Related Issues (20)
- Import PCAP file from a USB File to ElasticFlow HOT 1
- RISKIQ behind proxy HOT 1
- Can't access ElastiFlow 5.0.0 in Docker HOT 2
- Centos 7 Install Logstsh sFlow codec fails HOT 1
- ElasticFlow : Netflow VLAN data is not populated in elastiflow HOT 2
- Elastiflow : Not generating enough data in Elastic HOT 2
- ElasticSearch 7.12 ... just checking :) HOT 3
- I can't see data (elastiflow) in kibana HOT 1
- docker image - flowcoll should recover once elasticsearch become available HOT 3
- index-pattern remain elastiflow empty HOT 8
- Invalid request payload JSON format HOT 4
- Elastic upgrade from 7.10 to 7.12 HOT 5
- source.as.organization.name always public HOT 2
- logstash is running but not able to see Sflow data HOT 3
- netflowv5 mikrotik no data in dashboard HOT 6
- kibana terms list might be incomplete because the request is taking to long HOT 1
- Mapper_parsing_exception HOT 2
- No matching indices found: No indices match pattern "elastiflow-flow-codex-*" HOT 2
- no data in threats HOT 2
- The legacy ElastiFlow is deprecated. TRY THE NEW ELASTIFLOW!!!
Recommend Projects
-
 React
React
A declarative, efficient, and flexible JavaScript library for building user interfaces.
-
Vue.js
🖖 Vue.js is a progressive, incrementally-adoptable JavaScript framework for building UI on the web.
-
 Typescript
TypeScript is a superset of JavaScript that compiles to clean JavaScript output.
-
TensorFlow
An Open Source Machine Learning Framework for Everyone
-
Django
The Web framework for perfectionists with deadlines.
-
 Laravel
A PHP framework for web artisans
-
D3
Bring data to life with SVG, Canvas and HTML. 📊📈🎉
-
Recommend Topics
-
javascript
JavaScript (JS) is a lightweight interpreted programming language with first-class functions.
-
web
Some thing interesting about web. New door for the world.
-
server
A server is a program made to process requests and deliver data to clients.
-
Machine learning
Machine learning is a way of modeling and interpreting data that allows a piece of software to respond intelligently.
-
Visualization
Some thing interesting about visualization, use data art
-
Game
Some thing interesting about game, make everyone happy.
Recommend Org
-
Facebook
We are working to build community through open source technology. NB: members must have two-factor auth.
-
Microsoft
Open source projects and samples from Microsoft.
-
Google
Google ❤️ Open Source for everyone.
-
Alibaba
Alibaba Open Source for everyone
-
D3
Data-Driven Documents codes.
-
Tencent
China tencent open source team.
from elastiflow.