Giter Club home page Giter Club logo

pivottable's Introduction

npm cdnjs tests license

PivotTable.js

PivotTable.js is a Javascript Pivot Table library with drag'n'drop functionality built on top of jQuery/jQueryUI and originally written in CoffeeScript by Nicolas Kruchten.

It is available under an MIT license from CDNJS and NPM and Bower under the name pivottable. And on Packagist.org, it is nicolaskruchten/pivottable.

PivotTable.js can be used with Python/Jupyter and R/RStudio and you can try it right now in your browser on a CSV file.

Are you using React? Check out the React port: react-pivottable.

What does it do?

PivotTable.js' basic function is to enable data exploration and analysis by turning a data set into a summary table and then optionally adding a true 2-d drag'n'drop UI to allow a user to manipulate this summary table, turning it into a pivot table, very similar to the one found in older versions of Microsoft Excel with a bunch of extra developer-oriented features and some visualization effects. With optional add-ons, the summary table can be rendered as various kinds of charts, turning the pivot table into a pivot chart.

image

The animation above is based on the Canadian Parliament 2012 dataset example.

Where are the demos/examples?

There are lots on the examples page but here are some good entry points:

Why is it good?

  • it's lightweight: the core (without chart support) is a single file with less than 1000 LOC of CoffeeScript, compiles down to 6.3kb of Javascript minified and gzipped, and depends only on jQuery and jQueryUI's 'sortable'
  • it works wherever jQuery and jQueryUI work (tested with jQuery 1.8.3 and jQueryUI 1.9.2)
  • it works acceptably fast in Chrome on commodity hardware up to around a hundred thousand records, depending on the cardinality of the attributes.
  • its UI is localizable
  • its layered architecture allows for summary table generation with or without the pivot table UI around it (if you don't use the UI, then there is no dependency on jQueryUI)
  • it works with common input formats
  • its derived attributes can be created on the fly based on the whole input record by passing in a function
  • its complex aggregation functions can compute values based on the whole input record (e.g. weighted averages)
  • it has built-in support for basic heatmap and bar chart renderers, and optional extra renderers that add charting or TSV export support
  • its extension points allow aggregation functions, table output, UI and visualizations to be tailored to specific applications
  • it works on mobile devices with jQuery UI Touch Punch
  • it has a test suite

How do I use the UI?

PivotTable.js implements a pivot table drag'n'drop UI similar to that found in popular spreadsheet programs. You can drag attributes into/out of the row/column areas, and specify rendering, aggregation and filtering options. There is a step-by-step tutorial in the wiki.

How do I load the code?

PivotTable.js implements the Universal Module Definition (UMD) pattern and so should be compatible with most approaches to script loading and dependency management: direct script loading i.e. from CDNJS or with RequireJS, Browserify etc. For the latter options, you can grab it from NPM with npm install pivottable or via Bower with bower install pivottable.

If you are loading the scripts directly (as in the examples), you need to:

  1. load the dependencies:
    1. jQuery in all cases
    2. jQueryUI for the interactive pivotUI() function (see below)
    3. D3.js, C3.js and/or Google Charts if you use charting plugins
  2. load the PivotTable.js files:
    1. pivot.min.js
    2. any plugins you wish to use

The dependencies and PivotTable.js files can be loaded:

  1. By copying the files from their official distributions to your project and loading them locally (the dist directory is where you will find the PivotTable.js files)
  2. From a Content Distribution Network (CDN) like CDNJS

(The examples load dependencies from CDNJS and PivotTable.js locally)

How do I use the code?

There are two main functions provided by PivotTable.js: pivot() and pivotUI(), both implemented as jQuery plugins, as well as a bunch of helpers and templates.

pivot()

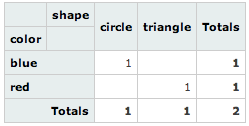
Once you've loaded jQuery and pivot.js, this code (demo):

$("#output").pivot(
    [
        {color: "blue", shape: "circle"},
        {color: "red", shape: "triangle"}
    ],
    {
        rows: ["color"],
        cols: ["shape"]
    }
);

appends this table to $("#output") (the default, overridable behaviour is to populate the table cells with counts):

image

pivotUI()

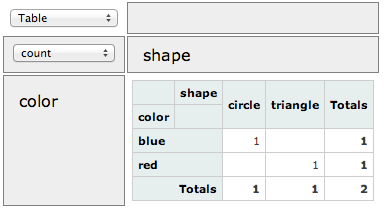
A slight change to the code (calling pivotUI() instead of pivot() ) yields the same table with a drag'n'drop UI around it, so long as you've imported jQueryUI (demo):

$("#output").pivotUI(
    [
        {color: "blue", shape: "circle"},
        {color: "red", shape: "triangle"}
    ],
    {
        rows: ["color"],
        cols: ["shape"]
    }
);

image

Note that pivot() and pivotUI() take different parameters in general, even though in the example above we passed the same parameters to both. See the FAQ.

See the wiki for full parameter documentation.

Where is the documentation?

More extensive documentation can be found in the wiki:

How can I build the code and run the tests?

To install the development dependencies, just run npm install, which will create a node_modules directory with the files required to run the Gulp build system.

After modifying any of the .coffee files at the top of the repo, you can compile/minify the files into the dist directory by running node_modules/gulp/bin/gulp.js

Once that's done, you can point your browser to tests/index.html to run the Jasmine test suite. You can view the current test results here.

The easiest way to modify the code and work with the examples is to leave a node_modules/gulp/bin/gulp.js watch serve command running, which will automatically compile the CoffeeScript files when they are modified and will also run a local web server you can connect to to run the tests and examples.

How can I contribute?

Pull requests are welcome! Here are some Contribution Guidelines.

I have a question, how can I get in touch?

Please first check the Frequently Asked Questions and if you can't find what you're looking for there, or in the wiki, then please create a GitHub Issue. When creating an issue, please try to provide a replicable test case so that others can more easily help you. Please do not email the author directly, as you will just be asked to create a Github Issue :)

Copyright & Licence (MIT License)

PivotTable.js is © 2012-2024 Nicolas Kruchten, Datacratic, other contributors

Permission is hereby granted, free of charge, to any person obtaining a copy of this software and associated documentation files (the "Software"), to deal in the Software without restriction, including without limitation the rights to use, copy, modify, merge, publish, distribute, sublicense, and/or sell copies of the Software, and to permit persons to whom the Software is furnished to do so, subject to the following conditions:

The above copyright notice and this permission notice shall be included in all copies or substantial portions of the Software.

THE SOFTWARE IS PROVIDED "AS IS", WITHOUT WARRANTY OF ANY KIND, EXPRESS OR IMPLIED, INCLUDING BUT NOT LIMITED TO THE WARRANTIES OF MERCHANTABILITY, FITNESS FOR A PARTICULAR PURPOSE AND NONINFRINGEMENT. IN NO EVENT SHALL THE AUTHORS OR COPYRIGHT HOLDERS BE LIABLE FOR ANY CLAIM, DAMAGES OR OTHER LIABILITY, WHETHER IN AN ACTION OF CONTRACT, TORT OR OTHERWISE, ARISING FROM, OUT OF OR IN CONNECTION WITH THE SOFTWARE OR THE USE OR OTHER DEALINGS IN THE SOFTWARE.

pivottable's People

Contributors

amla-nathan avatar ammachado avatar andrewkittredge avatar brendtumi avatar dampee avatar ddomingues avatar dhurimkelmendi avatar ebellumat avatar emaringolo avatar fabiomontefuscolo avatar faheydesign avatar fastcatch avatar gabegorelick avatar jfromaniello avatar khoden avatar laurensrietveld avatar marclaporte avatar meatballs avatar mwasiluk avatar nicolaskruchten avatar pbrekelmans avatar phowat avatar pkpapani avatar polfo avatar pperliti avatar radekdostal avatar sgranata82 avatar shrimalmadhur avatar yinhaibo01 avatar zhoulvjun avatar

Stargazers

 avatar  avatar  avatar  avatar  avatar  avatar  avatar  avatar  avatar  avatar  avatar  avatar  avatar  avatar  avatar  avatar  avatar  avatar  avatar  avatar  avatar  avatar  avatar  avatar  avatar  avatar  avatar  avatar  avatar  avatar  avatar  avatar  avatar  avatar  avatar  avatar  avatar  avatar  avatar  avatar  avatar  avatar  avatar  avatar  avatar  avatar  avatar  avatar  avatar  avatar  avatar  avatar  avatar  avatar  avatar  avatar  avatar  avatar  avatar  avatar  avatar  avatar  avatar  avatar  avatar  avatar  avatar  avatar  avatar  avatar  avatar  avatar  avatar  avatar  avatar  avatar  avatar  avatar  avatar  avatar  avatar  avatar  avatar  avatar  avatar  avatar  avatar  avatar  avatar  avatar  avatar  avatar  avatar  avatar  avatar  avatar  avatar  avatar  avatar  avatar

Watchers

 avatar  avatar  avatar  avatar  avatar  avatar  avatar  avatar  avatar  avatar  avatar  avatar  avatar  avatar  avatar  avatar  avatar  avatar  avatar  avatar  avatar  avatar  avatar  avatar  avatar  avatar  avatar  avatar  avatar  avatar  avatar  avatar  avatar  avatar  avatar  avatar  avatar  avatar  avatar  avatar  avatar  avatar  avatar  avatar  avatar  avatar  avatar  avatar  avatar  avatar  avatar  avatar  avatar  avatar  avatar  avatar  avatar  avatar  avatar  avatar  avatar  avatar  avatar  avatar  avatar  avatar  avatar  avatar  avatar  avatar  avatar  avatar  avatar  avatar  avatar  avatar  avatar  avatar  avatar  avatar  avatar  avatar  avatar  avatar  avatar  avatar  avatar  avatar  avatar  avatar  avatar  avatar  avatar  avatar  avatar  avatar  avatar  avatar  avatar  avatar

pivottable's Issues

OnClick event

It's very important to have ability to click on cell and get array of aggregated values...
Without this it's very difficult to integrate pivottable in the any serious project...
Usualy OLAP-table is something like a filter to details table...

P.S. Good work. Best javascript pivot table! )

Sorry for my very bad english((

Separate data table production from DOM construction

Currently you are caculating the pivot data table and then constructing the DOM elements.
This a violation of separation of concerns.

If you separated the functionality, it could be easily used with AngularJS applications (for example)

  1. updatePivotData
  2. support iterators for table header and rows (data only)
  3. provide call backs for table header

New input formats

Should add:

  • array of arrays (first is header)
  • function that calls back

Variable predefined combinations

Hi Nikolas
I wonder if there is a way i can do some predefined variable combinations , i mean , i don't want user can perform centain combinations that are not logical , so i would like to create these possible combinations once i had data on client.

Thanks

Distinguish between row/col and record/attribute

The input data is a set of records with attributes (not fields or variables, because derivedAttributes is part of the public API already).

The pivot table is a function of colAttrs and rowAttrs (not colVars and rowVars) and has rows and columns whose headers are derived from rowKeys and colKeys.

Should be an internal refactoring, with some passes on the documentation to make things coherent.

GET COLUM TOTAL

Hi
i would like to know how to get a column total to use it in an agregator function, is this possible ?

Thanx

Pivot example

I am looking to use the built in aggregate functions via the pivot() function and am not sure how to pass them in. Is it possible to add an example of how to call them?
In particular I am looking for intSum aggregate example.

Wonderfully useful tool!

Expand/Collapse Fields

Good morning Nicolas, i'm using this tool and it is so interesting. But miss a resource of expand or collapse a cell like occurs in microsoft excel. Do you intend to develop this? Or is this already exists?
Sorry for my english.
Rafael

Add examples for aggregation functions

It is not clear how aggregate functions work. Currently, in my personal use cases, only "count" works. However, the rest of the functions (sum, avg, etc...), when selected, the cells display empty values.

It would be useful to add examples for this in the documentation.

How to override col and row names.

I would like to override the col and row names for displaying.

For Example:
{color: "blue", shape: "circle"},
{color: "red", shape: "triangle"}

The above json column value is color and row value is shape. But i want to display instead of color as "Background Color" and shape as "Graph Shape".

Currently i am returning the json from java object.

Can you help me on this.

numbers are not correctly sorted

pivotbug

numbers are sorted like strings even if i declare it as numbers in my json

data to reproduce this screenshot table:
{'CUSTOMER':'A','QUANTITY':4,'ITEM':'qq','MONTH':2},
{'CUSTOMER':'B','QUANTITY':2,'ITEM':'ww','MONTH':3},
{'CUSTOMER':'C','QUANTITY':6,'ITEM':'ww','MONTH':3},
{'CUSTOMER':'A','QUANTITY':2,'ITEM':'tt','MONTH':3},
{'CUSTOMER':'A','QUANTITY':1,'ITEM':'ww','MONTH':2},
{'CUSTOMER':'C','QUANTITY':2,'ITEM':'qq','MONTH':1},
{'CUSTOMER':'B','QUANTITY':5,'ITEM':'ww','MONTH':2},
{'CUSTOMER':'C','QUANTITY':4,'ITEM':'qq','MONTH':1},
{'CUSTOMER':'A','QUANTITY':5,'ITEM':'tt','MONTH':11},
{'CUSTOMER':'B','QUANTITY':3,'ITEM':'qq','MONTH':14},
{'CUSTOMER':'B','QUANTITY':6,'ITEM':'ww','MONTH':3}

map definition:
{
rows: ['CUSTOMER'],
cols: ['MONTH'],
vals: ['QUANTITY'],
aggregatorName: 'intSum',
effectsName: 'Heatmap'
}

In chrome example is not working

version: Version 28.0.1500.72 m

Console error:

Failed to load resource: Origin null is not allowed by Access-Control-Allow-Origin. file:///C:/Users/Impel123/Desktop/issues%20fixes/pivot/pivottable-master/pivottable-master/examples/mps.json

XMLHttpRequest cannot load file:///C:/Users/Impel123/Desktop/issues%20fixes/pivot/pivottable-master/pivottable-master/examples/mps.json. Origin null is not allowed by Access-Control-Allow-Origin.

Data source size

Hi, I'm having trouble implementing a rather large data source through the pivot table. The source is currently about 300,000 rows with 12 columns.

As I begin to increase the number of rows I'm selecting, it gets slower and slower, eventually not loading at all. I mean, the data is returned from the server, but the page is just blank. Here are some numbers:
1,000 1.12MB 581ms
10,000 2.4MB 939ms
15,000 3.6MB 1.46s
50,000 12.0MB 4.76s

This is # of records, size of response and response time in Chrome x64.

Anything after 15,000 does not render a chart or table at all.

I see someone posted in #29 a similar issue and he said that he resolved it by breaking his ajax requests apart. But I'm not really sure how to do this. I can't find anything in the documentation that lets data be loaded in piecemeal, after the initial instantiation of the table. Is this possible?

% of column or row

it would be useful to be able to add the operator '% of column' or '% of row' to the results table.

Options parameter cols not working for pivotUI

I've noticed that the cols option parameter does not seem to work for pivotUI (rows is fine), whereas it works fine for pivot.

Here is a snippet of code which illustrates what I'm trying to do:

rows = ['Amount Bin100'];
cols = ["Scheme", "Code"];

var derivers = $.pivotUtilities.derivers;
$("#pivottable").pivotUI(filteredLocations, {
    derivedAttributes: {
        "Amount Bin100": derivers.bin("Amount", 100),
        "Amount Bin1000": derivers.bin("Amount", 1000)
    },
    hiddenAttributes: hiddenAttributes,
    cols:cols, rows: rows
});

});

Any idea why cols is not working for pivotUI, but works if I replace pivotUI with pivot ?

Joining deriver

Some sort of function that holds a mapping of disaggregated to aggregated?

Subtotals

Is there a way to create subtotals on rows and columns when exists more than one field in each axis?

Rafael

Sorting by totals

Is there a simple way of sorting by totals? I know right now it sorts by the attribute name... but is there a way to sort by the attribute value? Thanks!

Uncaught RangeError: Maximum call stack size exceeded

This happens when handling a 90mb data object on the pivot table. For smalled datasets, it works fine.

Unfortunately, the application that I use this for return a high number of json objects. Is there a workaround/fix for this behaviour?

% of column/row total

Hi, I was wondering if it is possible to write an aggregator that shows sums as percentages of the row or column total?

Percentage

Hi
Is there a way to calculate percetages over rows colums or grand total ??
Can I use the symbol % as format ?

Thanx

Remember last options/settings

--- initially ---
$("#cube").pivotUI(mps, {
rows: ["Year", "Name"],
cols: ["Category"],
vals: ["Number"],
effectsName: "Heatmap",
aggregatorName: "intSum"
});

--- since i need to reload the data due to some reasons ---
$("#cube").pivotUI(mps);

The cube forgets all the current options (user might have changed the rows, columns and vals).

Data collision with multiple tables on same page

When creating a pivot table on a page that already contains one, the new one inherits some of the old one's parameters. I've confirmed this with cols and rows. For example, if I add the attribute "Sex" as a column, then the new pivot table will be created with Sex as a column (see attached image). Even worse, the user can't drag the column to remove it.

It looks like the issue is with the use of #id selectors like $("#rows li nobr"). If there's more than one pivot table on the page, then data from an existing one will be selected.

image

Aggregate area:performs the operation only on one field

Hi,
actually when i drop the two fields in aggregate area,then it performs the aggregate function only on one field.but i need it to perform that functionality on all the fields that is present in aggregation area.
is there any way to do that.
thanks in advance.

Hidding agregator/renderer

Is there an option to "hide" the aggregator/renderer drop-down through the init code?

Something like:

pivotOpts : {
rows : [ 'Name' ],
vals : [ 'Age' ],
rendererName : 'Heatmap',
aggregatorName : 'intSum',
hideAggregator : true
}

Currently after it gets rendered I'm doing something like:

  if(hideAggregator){
        $("#aggregator").hide();
    }

extra coding support

I have a project where we would like to calculate % of row and column, sorting, and other features not currently in your great pivottable tool. Can we work on this and submit code to you for possible inclusion? if so, i guess i can put you in touch with the programmer to discuss standards and such?

PivotChart renderer

Once the pivot() function has been split into render(model()), create a PivotChart renderer

Bug: Derived Attrs error

Hello,

First of all, thanks for such a wonderful work!. I was playing around with the derived attributes and I found the following error when you are trying to use it.

Uncaught TypeError: Object [object global] has no method 'splice'

My solution was to omit the removeAt key in the deriveAttributes function and it worked.

deriveAttributes = function(record, derivedAttributes, f) {
var k, v, _ref, _ref2;
console.log(derivedAttributes);
for (k in derivedAttributes) {
if(k!="removeAt"){ // I Included this
v = derivedAttributes[k];
record[k] = (_ref = v(record)) != null ? _ref : record[k];
}
}
for (k in record) {
if (!__hasProp.call(record, k)) continue;
if ((_ref2 = record[k]) == null) {
record[k] = "null";
}
}
return f(record);
};

Hope its the right approach,

Thanks,

Andrés.

Add use-case documentation

  • time&space data (space includes stuff like campaigns, budget categories)
  • binary trial data (click through rate, dropped call rate)
  • ratio data (average order value, normalized data)

sorting

it would be useful to be able to sort the output table columns (A-Z, Z-A) such that the end result is something like 'top 10 provinces who voted NDP' or similar result.

Request example using HTML table as input

Hi, I am struggling to get a pivot table working using an HTML table as input.

I have it laid out properly, as far as I can tell with thead->th elements as my attributes and tbody->tr->td elements as my data.

My table id is "players" and I instantiate the pivottable as such:

<script>
    var input = $("#players");
     $(function(){
                    $("#output").pivotUI(input,
                                                { 
        rows: ["Weapon"], 
        cols: ["PlayerName"] 
    });
     });
</script>

I am not a very experience jQuery guy, so I might be doing something very silly.

Any chance I could get a more complete example than is currently in the input formats docs?

cheers

Values with dashes might not be counted correctly

$("#output").pivot(
    [
        {a: "1-0", b: "0"},
        {a: "1", b: "0-0"}
    ],
    {
        rows: ["a", "b"],
        cols: []
    }
);

Gives the following table

screen shot 2013-07-24 at 2 03 17 am

which is incorrect, expected two separate rows.

I propose you to use String.fromCharCode(0) or String.fromCharCode(0) + "-"

Drill-through/Output data from Pivot table entry: "pivot filtering"

I'm wondering if it's possible to output the records that have been binned into a given pivot table entry.

The use case is the following:

  • I have set up a pivot table, for instance with heatmap colouring.
  • I now want to click on a given pivot table entry of interest in order to filter on/ inspect / output those records, creating a filtered view of the initial input records.

i.e. I want to answer the question "Which records contribute to this pivot table entry?", and make use of them elsewhere in coordinated views.

Another approach would be to output the necessary row and column data that describes the pivot table entry in order to perform filtering externally (perhaps with crossfilter.js).

I have not looked into the source code to see how to approach this. It would be great to hear from you to know the difficultly level of this enhancement.

Recommend Projects

  • React photo React

    A declarative, efficient, and flexible JavaScript library for building user interfaces.

  • Vue.js photo Vue.js

    🖖 Vue.js is a progressive, incrementally-adoptable JavaScript framework for building UI on the web.

  • Typescript photo Typescript

    TypeScript is a superset of JavaScript that compiles to clean JavaScript output.

  • TensorFlow photo TensorFlow

    An Open Source Machine Learning Framework for Everyone

  • Django photo Django

    The Web framework for perfectionists with deadlines.

  • D3 photo D3

    Bring data to life with SVG, Canvas and HTML. 📊📈🎉

Recommend Topics

  • javascript

    JavaScript (JS) is a lightweight interpreted programming language with first-class functions.

  • web

    Some thing interesting about web. New door for the world.

  • server

    A server is a program made to process requests and deliver data to clients.

  • Machine learning

    Machine learning is a way of modeling and interpreting data that allows a piece of software to respond intelligently.

  • Game

    Some thing interesting about game, make everyone happy.

Recommend Org

  • Facebook photo Facebook

    We are working to build community through open source technology. NB: members must have two-factor auth.

  • Microsoft photo Microsoft

    Open source projects and samples from Microsoft.

  • Google photo Google

    Google ❤️ Open Source for everyone.

  • D3 photo D3

    Data-Driven Documents codes.