Giter Club home page Giter Club logo

interactivereport / cellxgene_vip Goto Github PK

View Code? Open in Web Editor NEW
121.0 6.0 42.0 122.16 MB

Enables cellxgene to generate violin, stacked violin, stacked bar, heatmap, volcano, embedding, dot, track, density, 2D density, sankey and dual-gene plot in high-resolution SVG/PNG format. It also performs differential gene expression analysis and provides a Command Line Interface (CLI) for advanced users to perform analysis using python and R.

Home Page: https://cellxgenevip-ms.bxgenomics.com

License: MIT License

CSS 3.41% JavaScript 20.73% Python 3.72% Shell 0.50% HTML 37.44% R 4.38% Jupyter Notebook 29.72% SCSS 0.11%
scrna-seq cellxgene scanpy visualization seurat svg publication-quality-plots cellxgene-vip

cellxgene_vip's Introduction

What's new

  • Upgrade to cellxgene v 1.1.1. After pull, please run "config.sh"
  • Install new modules if needed, e.g., pip install anndata==0.8.0

Cellxgene VIP unleashes full power of interactive visualization and integrative analysis of scRNA-seq, spatial transcriptomics, and multiome data

To meet the growing demands from scientists to effectively extract deep insights from single cell RNA sequencing, spatial transcriptomics, and emerging multiome datasets, we developed cellxgene VIP (Visualization In Plugin), a frontend interactive visualization plugin of cellxgene framework, which greatly expanded capabilities of the base tool in the following aspects. First, it generates a comprehensive set of over eighteen commonly used quality control and analytical plots in high resolution with highly customizable settings in real time. Second, it provides more advanced analytical functions to gain insights on cellular compositions and deep biology, such as marker gene identification, differential gene expression analysis, and gene set enrichment analysis. Third, it empowers advanced users to perform analysis in a Jupyter Notebook like environment, dubbed Command Line Interface (CLI) by programming in Python and/or R directly without limiting themselves to functional modules available via graphical user interface (GUI). Finally, it pioneers methods to visualize multi-modal data, such as spatial transcriptomics embedding aligned with histological image on one slice or multiple slices in a grid format, and the latest 10x Genomic Multiome dataset where both DNA accessibility and gene expression in the same cells are measured, under the same framework in an integrative way to fully leverage the functionalities mentioned above. Taken together, the open-source tool makes large scale single cell data visualization and analysis more accessible to biologists in a user-friendly manner and fosters computational reproducibility by simplifying data and code reuse through the CLI. Going forward, it has the potential to become a crowdsourcing ecosystem for the scientific community to contribute even more modules to the Swiss Army knife of single cell data exploration tools.
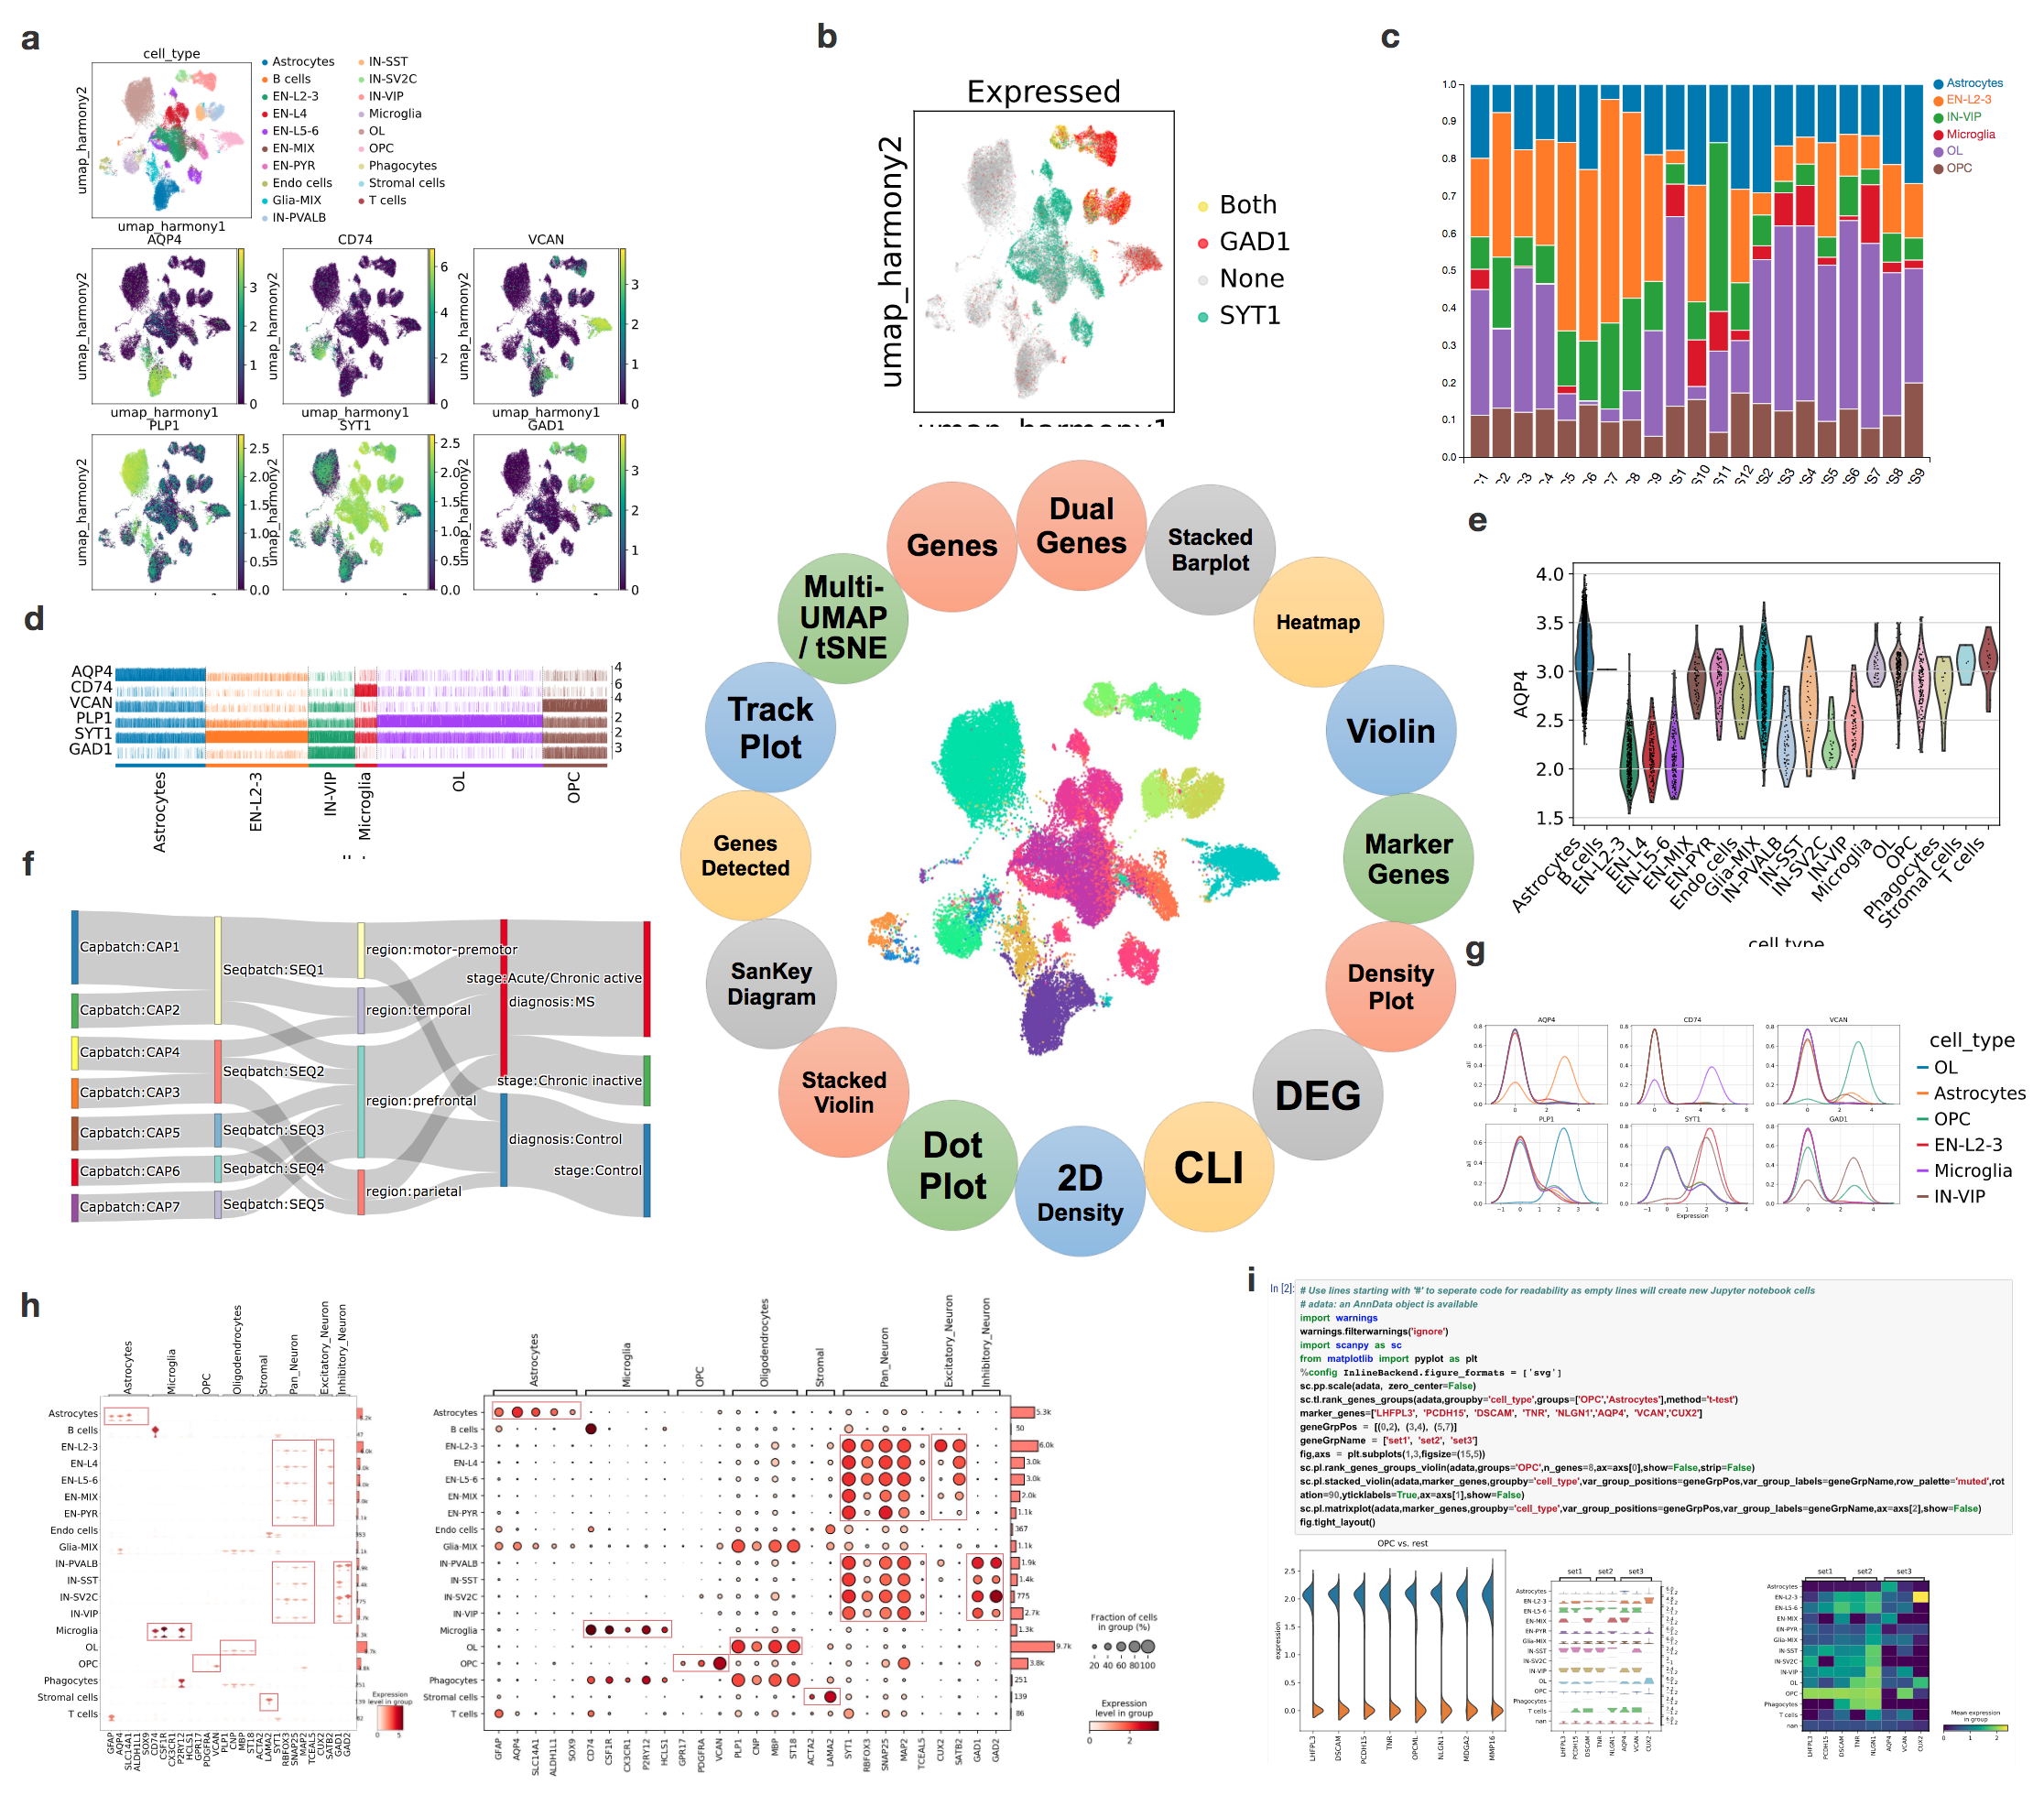
cellxgene_VIP Figure 1 | cellxgene VIP serves as an ecosystem of analytical modules that provide essential functions for interactive visualization and generation of publication-ready plots. Individual plots were assembled by bioInfograph22 with zoomable feature available at https://bit.ly/2QqdMg3 that is best viewed by Chrome. (a) Multi-tSNE/UMAP plot visually highlights which cells expressing cell markers on selected embedding (UMAP based on harmony batch correction in this example). (b) Dual-gene plot highlights cells express SYT1 and GAD1 (green SYT1 only, red GAD1 only, yellow co-expression of STY1 and GAD1), expression cutoff 2.2. (c) Stacked barplot demonstrates the fraction of each major cell type across each sample (C are Control and MS are MS patients). (d) Trackplot shows expression of lineage marker genes across individual cells in annotated clusters. (e) Violin plot shows the AQP4 gene expression across cell types. (f) Sankey diagram (a.k.a. Riverplot) provides quick and easy way to explore the inter-dependent relationship of variables in the MS snRNAseq dataset8. (g) Density plots shows expression of marker genes across annotated clusters and split across cell types. (h) Stacked violin and Dot plot are the key visualizations of selected cell markers across cell types. They highlight their selective expression and validates the scRNAseq approach and visualization method. (i) Command Line Interface (CLI) exposed by mini Jupyter Notebook to provide maximal flexibility of doing various analytics on the whole or sliced single cell dataset.

Installation instruction

1. Install anaconda if not available on server (https://docs.anaconda.com/anaconda/install/linux/)

bash ~/Downloads/Anaconda3-2020.02-Linux-x86_64.sh

2. One step installation for VIPlight (without CLI, Command Line Interface for programming)

Clone the repo to your local,

  • For Linux users
./install_VIPlight.sh
  • For MacOS users (including M1/M2 users)
./install_VIPlight.sh

Users can change the conda env location by changing appPATH in the above script. And lauch the VIP by (all input arguments the same as cellxgene:

./VIPlight launch <path/to/h5ad> --host <IP> -p <port>

And then skip following step 3/4/5/6/

3. Create and enable conda environment

git clone https://github.com/interactivereport/cellxgene_VIP.git
cd cellxgene_VIP

source <path to Anaconda3>/etc/profile.d/conda.sh (Default: /opt/anaconda3/etc/profile.d/conda.sh)
conda config --set channel_priority flexible
conda env create -n <env name, such as: VIP> -f VIP.yml (system-wide R) or VIP_conda_R.yml (local R under conda, no root privilege needed)

For Mac User, conda env create -n <env name, such as: VIP> -f VIP.macOS.yml

conda activate <env name, such as: VIP>
or
source activate <env name>

4. Install cellxgene by running config.sh in "cellxgene_VIP" directory

./config.sh
For Mac User, ./config.macOS.sh

5. Install R packages

export LIBARROW_MINIMAL=false
unset R_LIBS_USER
#  ensure that the right instance of R is used. e.g. system-wide: /bin/R or /usr/bin/R ; local R under conda: ~/.conda/envs/VIP_conda_R/bin/R
which R
#  The version of a Bioconductor package is controlled by BiocManager, whose version is provided

R -q -e 'if(!require(devtools)) install.packages("devtools",repos = "http://cran.us.r-project.org")'
R -q -e 'if(!require(Cairo)) devtools::install_version("Cairo",version="1.5-12",repos = "http://cran.us.r-project.org")'
R -q -e 'if(!require(foreign)) devtools::install_version("foreign",version="0.8-76",repos = "http://cran.us.r-project.org")'
R -q -e 'if(!require(ggpubr)) devtools::install_version("ggpubr",version="0.3.0",repos = "http://cran.us.r-project.org")'
R -q -e 'if(!require(ggrastr)) devtools::install_version("ggrastr",version="0.2.1",repos = "http://cran.us.r-project.org")'
R -q -e 'if(!require(arrow)) devtools::install_version("arrow",version="2.0.0",repos = "http://cran.us.r-project.org")'
R -q -e 'if(!require(Seurat)) devtools::install_version("Seurat",version="3.2.3",repos = "http://cran.us.r-project.org")'
R -q -e 'if(!require(rmarkdown)) devtools::install_version("rmarkdown",version="2.5",repos = "http://cran.us.r-project.org")'
R -q -e 'if(!require(tidyverse)) devtools::install_version("tidyverse",version="1.3.0",repos = "http://cran.us.r-project.org")'
R -q -e 'if(!require(viridis)) devtools::install_version("viridis",version="0.5.1",repos = "http://cran.us.r-project.org")'
R -q -e 'if(!require(hexbin)) devtools::install_version("hexbin",version="1.28.2",repos = "http://cran.us.r-project.org")'
R -q -e 'if(!require(ggforce)) devtools::install_version("ggforce",version="0.3.3",repos = "http://cran.us.r-project.org")'
R -q -e 'if(!require(RcppRoll)) devtools::install_version("RcppRoll",version="0.3.0",repos = "http://cran.r-project.org")'
R -q -e 'if(!require(fastmatch)) devtools::install_version("fastmatch",version="1.1-3",repos = "http://cran.r-project.org")'
R -q -e 'if(!require(BiocManager)) devtools::install_version("BiocManager",version="1.30.10",repos = "http://cran.us.r-project.org")'
R -q -e 'if(!require(fgsea)) BiocManager::install("fgsea")'
R -q -e 'if(!require(rtracklayer)) BiocManager::install("rtracklayer")'
R -q -e 'if(!require(rjson)) devtools::install_version("rjson",version="0.2.20",repos = "https://cran.us.r-project.org")'
R -q -e 'if(!require(ComplexHeatmap)) BiocManager::install("ComplexHeatmap")'

# These should be already installed as dependencies of above packages
R -q -e 'if(!require(dbplyr)) devtools::install_version("dbplyr",version="1.0.2",repos = "http://cran.us.r-project.org")'
R -q -e 'if(!require(RColorBrewer)) devtools::install_version("RColorBrewer",version="1.1-2",repos = "http://cran.us.r-project.org")'
R -q -e 'if(!require(glue)) devtools::install_version("glue",version="1.4.2",repos = "http://cran.us.r-project.org")'
R -q -e 'if(!require(gridExtra)) devtools::install_version("gridExtra",version="2.3",repos = "http://cran.us.r-project.org")'
R -q -e 'if(!require(ggrepel)) devtools::install_version("ggrepel",version="0.8.2",repos = "http://cran.us.r-project.org")'
R -q -e 'if(!require(MASS)) devtools::install_version("MASS",version="7.3-51.6",repos = "http://cran.us.r-project.org")'
R -q -e 'if(!require(data.table)) devtools::install_version("data.table",version="1.13.0",repos = "http://cran.us.r-project.org")'

6. Run cellxgene by specifiying a h5ad file storing scRNA-seq data along with a host and a port, use "ps" to find used ports to spare, see https://chanzuckerberg.github.io/cellxgene/posts/launch for details.

ps -ef | grep cellxgene
Rscript -e 'reticulate::py_config()'
# Run the following command if the output of the above command doesn't point to the Python in your env.
export RETICULATE_PYTHON=`which python`
cellxgene launch --host <xxx> --port <xxx> --disable-annotations --verbose <h5ad file>

7. From web browser (Chrome is preferred, Version 87.0.4280.88 or 87.0.4280.141 is used), access http(s)://host:port

You should be able to see this in Console of Chrome Developer Tools if everything is right. VIP_ready

note: while spinning up the cellxgene from HPC, do NOT use qlogin. ssh directly to the server.

Updating

./update.VIPInterface.sh all # if "interface.html" or "VIPInterface.py" is modified or new source code needs to go to right location, often.

./update.index_template.sh # if jsPanel is modified, very rare.

cellxgene_vip's People

Contributors

alexlenail avatar baohongz avatar biogen-clarivate avatar interactivereport avatar likejie avatar onionpork avatar z5ouyang avatar

Stargazers

 avatar  avatar  avatar  avatar  avatar  avatar  avatar  avatar  avatar  avatar  avatar  avatar  avatar  avatar  avatar  avatar  avatar  avatar  avatar  avatar  avatar  avatar  avatar  avatar  avatar  avatar  avatar  avatar  avatar  avatar  avatar  avatar  avatar  avatar  avatar  avatar  avatar  avatar  avatar  avatar  avatar  avatar  avatar  avatar  avatar  avatar  avatar  avatar  avatar  avatar  avatar  avatar  avatar  avatar  avatar  avatar  avatar  avatar  avatar  avatar  avatar  avatar  avatar  avatar  avatar  avatar  avatar  avatar  avatar  avatar  avatar  avatar  avatar  avatar  avatar  avatar  avatar  avatar  avatar  avatar  avatar  avatar  avatar  avatar  avatar  avatar  avatar  avatar  avatar  avatar  avatar  avatar  avatar  avatar  avatar  avatar  avatar  avatar  avatar  avatar

Watchers

 avatar  avatar  avatar  avatar  avatar  avatar

cellxgene_vip's Issues

make unit-test failing

path: cellxgene/server/

the make unit-test failed

if run in conda env, make, pytest and coverage need to be installed first to use the right python 3.7 to do make.

conda install make
conda install coverage
conda install pytest

Still seeing unit-test failing. See attachement
log.txt

Method Not Allowed error when trying to plot data through VIP

When launching VIP using /home/ubuntu/.Anaconda3/envs/VIP/bin/cellxgene launch test.h5ad --annotations-file ~/cellxgene/annotation_collection.csv --max-category-items 50 --port 3839 --host 0.0.0.0 --open I get an error when trying to plot violins, heatmap, UMAP, etc:

405<!DOCTYPE HTML PUBLIC "-//W3C//DTD HTML 3.2 Final//EN">
<title>405 Method Not Allowed</title>
<h1>Method Not Allowed</h1>
<p>The method is not allowed for the requested URL.</p>

Screenshot:
image

Any ideas?

bug in Group Violin, 2D density and Gene Detected

Hi all,

Thanks for developing such an excellent plugin.I can use all functions smoothly, except for the following three:
When I use Group Violin and 2D density, it will run in the background, but they do not return the correct picture:
屏幕快照 2021-01-20 下午8 02 41
屏幕快照 2021-01-20 下午8 15 09

When I use Gene Detected, it report errors like this:
屏幕快照 2021-01-20 下午8 16 39

What might these errors be related to?
Thanks!

Li

VIP not adding genes on Large Dataset (~100K cells)

Hello,

cellXgene VIP works fantastically on all datasets I have but one that is bigger than the others (~100k cells).
In particular, what it happens is that the cellXgene VIP plugin appears but the "add Gene" panel is blank at first.

I get the following error from the web consoles:
image

Moreover, when I try to add a gene (that I know) I obtain the following error from console:
image

One last info: the "gene is not present in the "add gene" panel appears if I insert a gene that is not there, it simply DOES NOT add the gene.

Can you help me out?

D.

GUI tweaking

  1. One of rain drop is partially covered by long text box
    sed -i "s|width: "190px"|width: "120px"|" "cellxgene/client/src/components/leftSidebar/topLeftLogoAndTitle.js"

  2. Three "VIP"s in title and right top corner

Bug in density plot

Label is overlapped on y-axis and there is another x,y-axis behind the plot.

Screen Shot 2020-05-27 at 3 55 55 PM

Aggregate cells by metadata category and plot against another category

Is it possible to aggregate cells by a specific metadata category, say Donor, and compare across another metadata category like Treatment status? I find this way to be easier to interpret for data with many (>200k) cells. If I were to do this comparison at the cell level with a gene that is highly dropped out or lowly expressed then the distribution would be heavily weighted towards zero but if I were to aggregate by mean or median then the data looks a bit cleaner and easier to interpret.

Multi-UMAP layout is ugly if the number of categories in legend is between 10 and 30

Layout is fine if the number is greater than 30 as you have shown.

I tested here.
http://demo.bxgenomics.com:8081/

Screen Shot 2020-05-16 at 6 06 09 PM

Suggestion:
We may want to return two separate figures to AJAX call as it is easier to control the size and layout combined UMAPs out nicely, as in block [18] and [20] of the below notebook,
https://nbisweden.github.io/workshop-scRNAseq/labs/compiled/scanpy/scanpy_02_dim_reduction.html

We may encode two or more images in returning JSON.
https://stackoverflow.com/questions/41251824/how-to-return-multiple-values-in-an-ajax-call

bug in "dual gene" which allows negative exp cutoff

Please do not allow negative value as expression cutoff in "dual gene" and other tabs using expression cutoff values.

Please see below which breaks function if negative value (or lower than the minimum expression of a gene) is used.
image

this is how it looks when it is working properly (cutoff > 0.7):
image

image

DEG Welch's t-test (cellxgene) produces rows without gene names and mostly 0 for other columns

In DEG under VIP, when I select "All" in "Select the number of top DEG", number of genes are reported correctly is equal to number of cells in the dataset. For eg, if there are 4500 cells, then I am getting 4500 genes with proper values and gene names. All other rows doesn't have gene names (empty) and other values are mostly 0, with few exceptions. Whereas, for datasets with with number of cells are more than total number of genes in the object then it works fine. For eg, if the cell count is 30,000 and number of genes are 25,000, then the results are fine. I have updated to the latest version, still the problem persists.

Here is the input page,
image

and here is the output,
image

Cheers,
Ashick

Bugs related to DEG on Custom_annotation

  1. It takes long time to calculate number of cells in each category of Custom_annotation. Please don't perform counting on client side and let server to handle it.
  2. It won't perform DE if I select two categories. Here is the screenshot.

Screen Shot 2020-05-28 at 11 22 15 AM

cellxgene_VIP deploying with Heroku

Hi,
I would like to deploy the cellxgene VIP result with Heroku

and would like to know how to modify the "Dockerfile" provided by cellxgene

Here is my modified version and I'm getting this error


FROM ubuntu:bionic

ENV LC_ALL=C.UTF-8
ENV LANG=C.UTF-8

RUN apt-get update &&
apt-get install -y build-essential libxml2-dev python3-dev python3-pip zlib1g-dev python3-requests &&
apt-get install git -y
git clone https://github.com/interactivereport/cellxgene_VIP.git

COPY . .

RUN pip install -r requirements.txt

RUN conda env create -n VIP -f VIP.macOS.yml

RUN conda init bash

RUN conda activate VIP

RUN echo "Make sure flask is installed:"
RUN python -c "import flask"

COPY run.py .
RUN ./config.macOS.sh

ENTRYPOINT ["cellxgene"]


and getting below errors

E: Unable to locate package clone
E: Unable to locate package https://github.com/interactivereport
E: Couldn't find any package by glob 'https://github.com/interactivereport'
E: Couldn't find any package by regex 'https://github.com/interactivereport'
The command '/bin/sh -c apt-get update && apt-get install -y build-essential libxml2-dev python3-dev python3-pip zlib1g-dev python3-requests && apt-get install git -y git clone https://github.com/interactivereport/cellxgene_VIP.git' returned a non-zero code: 100
▸ Error: docker build exited with Error: 100

Thanks,

issue with plotting umap tsne

User can change the embedding names, not always x_umap, x_tsne. Example below:
image

when this happens, umap/tnse plotting in VIP failed since it would assume the name would be x_umap, x_tnse.
image

Could we look in adata.obsm to find out which embeddings are contained, and populate them in the drop down menu?

Thanks!

Discrepancy in expression values between VIP and CellXGene

Hi, I'm noticing that the expression range seems to differ between CellXGene and the VIP plugin.

In the example dataset (https://cellxgenevip-ms.bxgenomics.com) it looks like CD79A has a max normalized expression of 7.485:
image

But when I plot the distribution of this gene across clusters I see that the y-axis is capped at 20:

image

How is this 20 computed? Also what does the Expression cutoff: field correspond to? How can I get these values on the same scale?

cellxgene_VIP installation error

Hello, and first of all congratulations for your tool, it seems very useful and I'd like to propose it in our scSeq visualization and Analysis workflow in my laboratory.

I am writing you because I have troubles installing the tool on my workstation and I can't figure out why.
I followed the instruction you put on the website, namely:

  1. create an empty python 3.7 conda environment
  2. clone your git repo
  3. run config.sh (not as root of course)

the config.sh gives a series of errors in the installations. I attache the whole log in this thread because the list of errors in without any doubt very long and I'm scratching my head trying to figure out what's working and whatnot.

Hope you can help me out on this.

Cheers,

Daniele
cellxgene_VIP_install.log

error in installation

Could you help with the below error?

[email protected] /home/ec2-user/.nvm/versions/node/v4.4.5/lib/node_modules/npm
make[1]: *** [ci] Error 1
make[1]: Leaving directory `/home/ec2-user/downloads/cellxgene_VIP/cellxgene/client'
make: *** [build-client] Error 2
pip uninstall -y cellxgene || :
Found existing installation: cellxgene 0.16.4
Uninstalling cellxgene-0.16.4:
  Successfully uninstalled cellxgene-0.16.4
pip install dist/cellxgene*.tar.gz
WARNING: Requirement 'dist/cellxgene*.tar.gz' looks like a filename, but the file does not exist
Processing ./dist/cellxgene*.tar.gz
ERROR: Could not install packages due to an EnvironmentError: [Errno 2] No such file or directory: '/home/ec2-user/downloads/cellxgene_VIP/cellxgene/dist/cellxgene*.tar.gz'

make: *** [install-dist] Error 1
Traceback (most recent call last):
  File "<string>", line 1, in <module>
ModuleNotFoundError: No module named 'server'
cp: cannot create regular file ‘/server/app/.’: No such file or directory
cp: cannot create regular file ‘/server/common/web/static/.’: No such file or directory
cp: cannot create directory ‘/server/common/web/static/.’: No such file or directory
cp: cannot create regular file ‘/server/common/web/static/.’: No such file or directory
cp: target ‘/server/common/web/static/.’ is not a directory
cp: cannot create directory ‘/server/common/web/static/.’: No such file or directory
cp: cannot create regular file ‘/server/app/.’: No such file or directory

ls -l /server/common/web/static/.

ls: cannot access /server/common/web/static/.: No such file or directory

Error: The port selected is in use, please configure an open port.

Hello.
I've been able to install cellxgene_VIP but the visualization plugin window is "blank".
When I restart the program I now get a new error:

Error: The port selected 5005 is in use, please configure an open port.

I've tried restarting it with multiple ports 5005 to 5100 and I get the same message with all of them.

Any suggestions what might be going on?
Thanks

pandas error when create new label

Hi,
I created a new category and got the below error when use that variable for grouping in the violin and other plots. other category variables did not have error. Could you help?

ERROR @server: Traceback (most recent call last): KeyError: "Passing list-likes to .loc or [] with any missing labels is no longer supported. The following labels were missing: Index(['test'], dtype='object'). See https://pandas.pydata.org/pandas-docs/stable/user_guide/indexing.html#deprecate-loc-reindex-listlike"

DEG

Dear staff,
I the following error when I am executing DEG

RROR @server: Traceback (most recent call last):
File "", line None
SyntaxError: in volcano.R: Error in library(ggplot2) : there is no package called ‘ggplot2’
Execution halted

Hosting cellxgene_VIP with Heroku

Hi,
Thanks for the nice work, which makes it much easier to visualize the result with so many flexible functions.
I've hosted the cellxgene result successfully with Heroku, but I don't know what to do with your plugin version. What should be modified in the Dockerfile mentioned in cellxgene github?

I've tried to replace pip3 install cellxgene with git clone, but it does not work though...

FROM ubuntu:bionic

ENV LC_ALL=C.UTF-8
ENV LANG=C.UTF-8

RUN apt-get update && \
    apt-get install -y build-essential libxml2-dev python3-dev python3-pip zlib1g-dev python3-requests python3-aiohttp && \
    python3 -m pip install --upgrade pip && \
    # pip3 install cellxgene
    apt-get install -y git &&\
    git clone https://github.com/interactivereport/cellxgene_VIP.git 

Forgive me if this question is not so directly to your package development.

Thank you.

install error

I'm having an issue installing cellxgene_VIP at config.sh step

/config.sh

Cloning into 'cellxgene'...
remote: Enumerating objects: 15941, done.
remote: Counting objects: 100% (640/640), done.
remote: Compressing objects: 100% (401/401), done.
remote: Total 15941 (delta 295), reused 461 (delta 231), pack-reused 15301
Receiving objects: 100% (15941/15941), 202.22 MiB | 6.54 MiB/s, done.
Resolving deltas: 100% (11203/11203), done.
Note: switching to 'bedbc87ed6178cd00a586feac3e99d4912d1c74e'.

You are in 'detached HEAD' state. You can look around, make experimental
changes and commit them, and you can discard any commits you make in this
state without impacting any branches by switching back to a branch.

If you want to create a new branch to retain commits you create, you may
do so (now or later) by using -c with the switch command. Example:

git switch -c

Or undo this operation with:

git switch -

Turn off this advice by setting config variable advice.detachedHead to false

HEAD is now at bedbc87 Release 0.16.7
sed: 1: "server/requirements.txt": bad flag in substitute command: 'q'
sed: 1: "cellxgene/client/index_ ...": command c expects \ followed by text
sed: 1: "cellxgene/client/src/co ...": command c expects \ followed by text
sed: 1: "cellxgene/client/src/ut ...": command c expects \ followed by text
rm -rf build/ client/build build dist cellxgene.egg-info
cd server && /Applications/Xcode.app/Contents/Developer/usr/bin/make clean
rm -f common/web/templates/index.html
rm -rf common/web/static
rm -f common/web/csp-hashes.json
cd client && /Applications/Xcode.app/Contents/Developer/usr/bin/make clean
rm -rf node_modules
rm -f tests/screenshots/.png
cd client && /Applications/Xcode.app/Contents/Developer/usr/bin/make ci build
npm ci
/bin/bash: npm: command not found
make[1]: *** [ci] Error 127
make: *** [build-client] Error 2
pip uninstall -y cellxgene || :
WARNING: Skipping cellxgene as it is not installed.
pip install dist/cellxgene
.tar.gz
WARNING: Value for scheme.headers does not match. Please report this to pypa/pip#9617
distutils: /Users/miniconda3/envs/VIP/include/python3.8/UNKNOWN
sysconfig: /Users/miniconda3/envs/VIP/include/python3.8
WARNING: Additional context:
user = False
home = None
root = None
prefix = None
WARNING: Requirement 'dist/cellxgene*.tar.gz' looks like a filename, but the file does not exist
Processing ./dist/cellxgene*.tar.gz
ERROR: Could not install packages due to an OSError: [Errno 2] No such file or directory: '/Users/cellxgene_VIP-master/cellxgene/dist/cellxgene*.tar.gz'

make: *** [install-dist] Error 1
cp: /Users/miniconda3/envs/VIP/lib/python3.8/site-packages/server/common/web/static/.: No such file or directory
sed: 1: "/Users/minico ...": bad flag in substitute command: 'n'

ls -l /Users/miniconda3/envs/VIP/lib/python3.8/site-packages/server/common/web/static/.

ls: /Users/miniconda3/envs/VIP/lib/python3.8/site-packages/server/common/web/static/.: No such file or directory

thanks !

DEG in VIP get different list of genes from FindMarkers function

When I choose Welch's t-test(diffxpy) from VIP DEG, I got different list of genes when I run the below line in R:

 FindMarkers(pima_scrna, ident.1 = "DKD", ident.2 = "LD",group.by='sampletype', min.pct = 0.5,
                               test.use='t')

the logfc from VIP looks weird something like 1071.22 which is very big.

error loading cellxgene

Hi all,

Thanks for developing such an excellent plugin.But I have some problems with its use.

When I try to run through cellxgene's example data(pbmc3k.h5ad), it works well.But when I use my own data or modify pbmc3k.h5ad by scanpy, some errors will appear.I noticed that there can be no null values in categorical annotation.And I can run the data normally by installing cellxgene separately.
Here is the error message and web page information:
Screen Shot 2020-12-20 at 4 52 42 PM
Screen Shot 2020-12-20 at 4 14 36 PM

How should I start troubleshooting? I have no idea what the problem is.

Thanks!

Li

UMAP/tSNE in VIP legend overlapping with another plot

When the annotation contains a lot of groups in it, the plot legend would be big, When plotting multiple umap/tsne side by side, the legend would be overlapping with another plot.

Please see below
image

Would it be possible to move the legend or just make the next plot right below (not to the right) the previous plot?

Thanks!

Embedding doesn't work on t-sne

Only UMAP is dealt with in VIPInterface.py

def EMBED(data):
adata = createData(data)
subSize = 4
ncol = int(data['ncol'])
ngrp = len(data['grp'])
ngene = len(data['genes'])
nrow = ngrp+math.ceil(ngene/ncol)

step =11
grpCol = {gID:math.ceil(len(list(adata.obs[gID].unique()))/step) for gID in data['grp']}

fig = plt.figure(figsize=(ncolsubSize,subSizenrow))
gs = fig.add_gridspec(nrow,ncol)
for i in range(ngrp):
ax = sc.pl.umap(adata,color=data['grp'][i],ax=fig.add_subplot(gs[i,0]),show=False)
if grpCol[data['grp'][i]]>3:
ax.legend(ncol=grpCol[data['grp'][i]],loc=6,bbox_to_anchor=(1,0.5),frameon=False)
for i in range(ngene):
x = int(i/ncol)+ngrp
y = i % ncol
sc.pl.umap(adata,color=data['genes'][i],ax=fig.add_subplot(gs[x,y]),show=False)

return iostreamFig(fig)

Partial Legend in Density Plot

Only legend for the first row is shown. Also, there is a huge space between the last row and x-axis label, "Expression".

Screen Shot 2020-05-27 at 7 11 57 PM

Improvements on density plot

  1. Change "Desity estimation precision" to "Bandwidth". Also add the explanation "The bandwidth controls how tightly the curve is fit to the data, much like the bin size in a histogram.";
  2. Please add "Expression" as x-axis label;
  3. Optimize the layout of the legend into multiple columns when it is long

Screen Shot 2020-05-26 at 8 37 45 AM

Handle failed calls / errors gracefully after AJAX call

The current AJAX calls only handle successful calls. Please return error message to GUI, stop spinning wheel and give control back to user. Here is one example of current ajax code block.

$.ajax({
type:"POST",
url: "/VIP",
data:JSON.stringify(D),
contentType: 'application/json;charset=UTF-8',//
success: function(res){
document.getElementById("EMBEDfig").innerHTML = '';// height="450" width="450"
$(".EMBEDbt").prop("disabled",false);
$(".EMBEDpngBT").prop('disabled',false);
document.getElementById("EMBEDspin").style.visibility="hidden";
}

VIP button does not appear in cellxgene

Hi all,

Thanks for developing this plugin, it looks great in the demo and I'm excited to start using it.
I installed VIP as instructed in the readme (no errors occurred, just a bunch of warnings), but when I launch cellxgene I don't see the VIP button in my browser.
How should I start troubleshooting? I have no idea what the problem is.

Thanks!

Lisa

The server situation required to deploy cellxgene-vip

Hello!
I plan to deploy cellxgene to the server, but I don't know the required server situation.
For example, when I plan to deploy 5 data sets of 100k cells, what is the server situation I need, such as running memory?

Thanks!

Seurat4 SeuratDisk exported h5ad cause blank VIP menu

If we are using Seurat v4 and SeuratDisk to export h5ad file, it seems that cellxgene basic still works fine but cellxgene VIP came up as blank.

library(Seurat)
library(SeuratDisk)
SaveH5Seurat(query, filename = "data.h5Seurat")
Convert("data.h5Seurat", dest = "h5ad")

after "Combine & Abbr." doing cell selection

Current the "Combine & Abbr." works on de-select all annotations and then select a few to create combinations as "custom grouping". That worked well.

Then next step if one wants to create Violin plot, now it requires select cells (refresh button would bring selected cells to VIP). Without selecting all annotations, it does not allow to select any cell even with lasso tool. So Violin function would not work.

If one select all annotations by clicking "Check All Features" on "Combine & Abbr." tab, cell selection is possible again, however "custom grouping" disappeared.

We might need a way to keep the "custom grouping" annotation while all features/annotations are re-selected to enable cell selection.

Thanks!

unable to start device PNG

I just downloaded the latest version from GitHub.
I get the error message for DEG: unable to start device PNG.

I was able to fix this by adding:
options(bitmapType='cairo');

To the beginning of the volcano.R script.

Not sure if this is a "hack" or not but I thought you should be made aware.

Recommend Projects

  • React photo React

    A declarative, efficient, and flexible JavaScript library for building user interfaces.

  • Vue.js photo Vue.js

    🖖 Vue.js is a progressive, incrementally-adoptable JavaScript framework for building UI on the web.

  • Typescript photo Typescript

    TypeScript is a superset of JavaScript that compiles to clean JavaScript output.

  • TensorFlow photo TensorFlow

    An Open Source Machine Learning Framework for Everyone

  • Django photo Django

    The Web framework for perfectionists with deadlines.

  • D3 photo D3

    Bring data to life with SVG, Canvas and HTML. 📊📈🎉

Recommend Topics

  • javascript

    JavaScript (JS) is a lightweight interpreted programming language with first-class functions.

  • web

    Some thing interesting about web. New door for the world.

  • server

    A server is a program made to process requests and deliver data to clients.

  • Machine learning

    Machine learning is a way of modeling and interpreting data that allows a piece of software to respond intelligently.

  • Game

    Some thing interesting about game, make everyone happy.

Recommend Org

  • Facebook photo Facebook

    We are working to build community through open source technology. NB: members must have two-factor auth.

  • Microsoft photo Microsoft

    Open source projects and samples from Microsoft.

  • Google photo Google

    Google ❤️ Open Source for everyone.

  • D3 photo D3

    Data-Driven Documents codes.