![]()


D3Blocks builds on the graphics of d3 javascript (d3js) to create the most visually attractive and useful charts with only a few lines of Python code! The documentation pages contains detailed information about the working of the blocks with many examples.

See here an overview for all the blogs
pip install d3blocks     # Normal installation
pip install -U d3blocks # Force updategit clone https://github.com/d3blocks/d3blocks.git
cd d3blocks
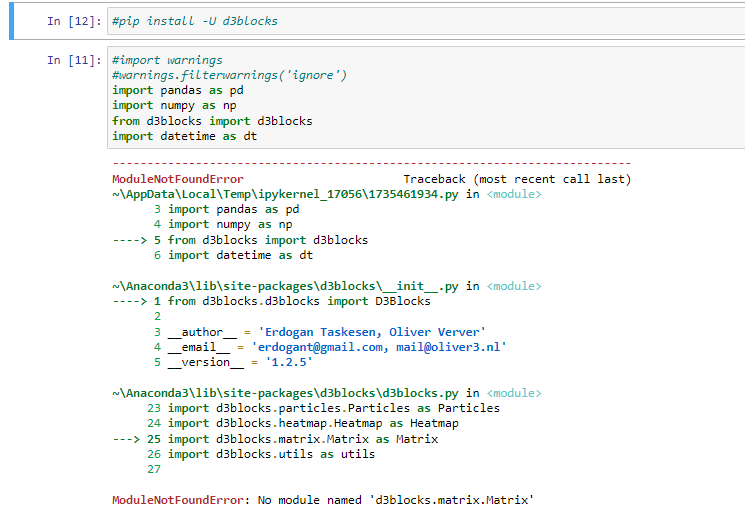
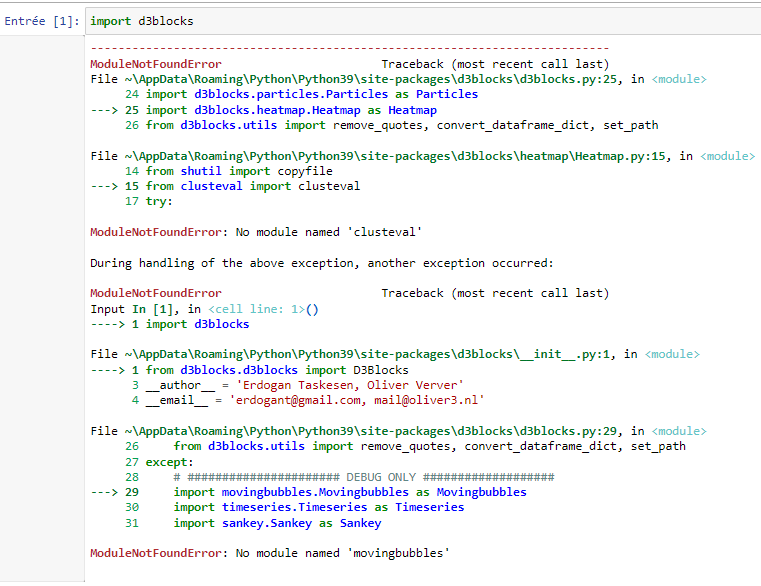
pip install -U .from d3blocks import d3blocks
# Initialize
d3 = D3Blocks()| nr | Block | Function | Blog |
|---|---|---|---|
| 1 | D3graph | d3.d3graph() |
D3graph |
| 2 | Elasticgraph | d3.elasticgraph() |
Elasticgraph |
| 3 | Sankey | d3.sankey() |
Sankey |
| 4 | Movingbubbles | d3.movingbubbles() |
Movingbubbles |
| 5 | Scatter | d3.scatter() |
Scatter |
| 6 | Heatmap | d3.heatmap() |
Heatmap |
| 7 | Chord diagram | d3.chord() |
D3Blocks |
| 8 | Timeseries | d3.timeseries() |
D3Blocks |
| 9 | Image slider | d3.imageslider() |
D3Blocks |
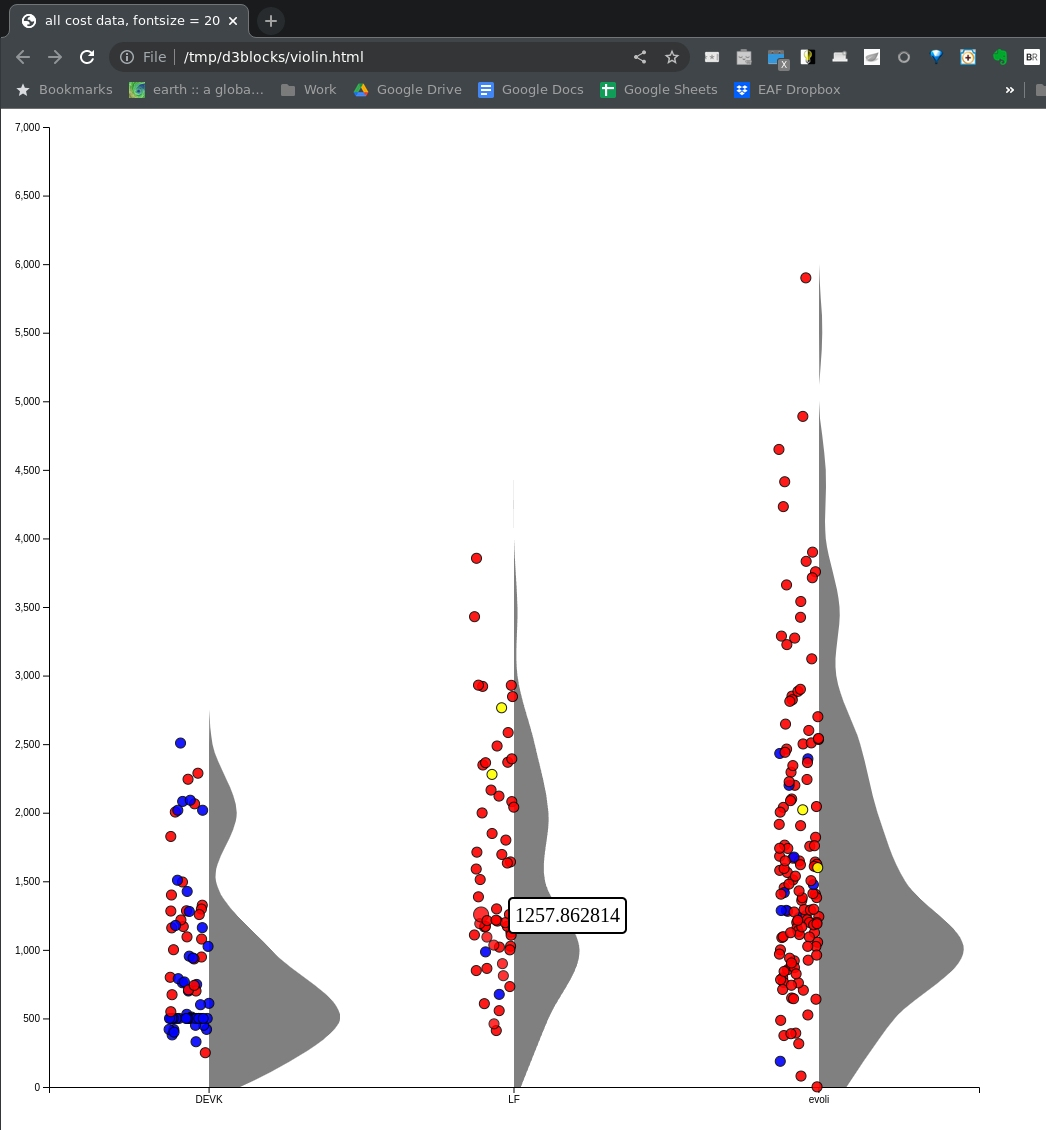
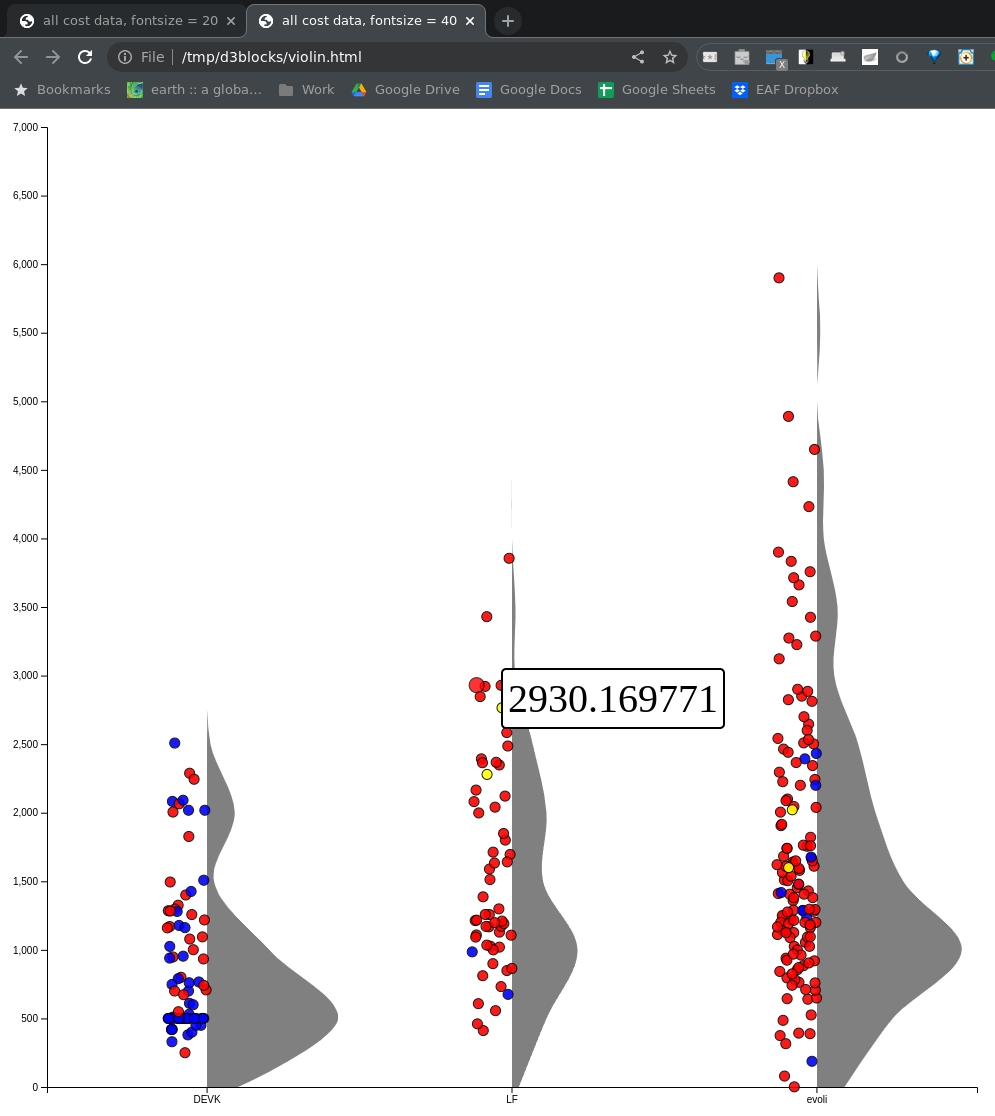
| 10 | Violin plot | d3.violin() |
D3Blocks |
| 11 | Particles | d3.particles() |
D3Blocks |
| 12 | Treemap | d3.treemap() |
D3Blocks |
| 13 | Maps | d3.maps() |
D3Blocks |
| 14 | Circlepacking | d3.circlepacking() |
D3Blocks |
| ----- | ------------------------------------------------------------------------------------ | ------------------------------ | -------------------------------------------------------------------------------------------------------------------------------------- |