bigomics / omicsplayground Goto Github PK
View Code? Open in Web Editor NEWVisual self-service analytics platform for big omics data.
Home Page: http://www.bigomics.ch
License: Other
Visual self-service analytics platform for big omics data.
Home Page: http://www.bigomics.ch
License: Other
When adding styling to elements in a module, try to avoid using the element ID to set customised style, and instead create a new class and use that for the custom styling. If the module ID ever changes, the styling linked with the ID will no longer work, whereas the class will still show as expected.
Correlation column not appearing when datatype is counts (Dataview/counts) [CS from PLX]
A significant portion of the startup time is taken up by creating the Orca server (~half a minute for me). It seems the only use of it is to download static plotly plots. I would be worthwhile looking into an alternative such as plotly::orca and removing the initOrca function.
There is some issue between shiny and orca on Windows (at least for me) where it doesn't like the temporary file path, but can be resolved by making a temporary file within the project and copying that file to the file argument in downloadHandler.
trimws() is more efficient removing outer whitespace
[premsubr in googlegroups 03.05.2021]
Is it possible to choose different normalization methods? TMM, etc....
[17.05.2021 from Premsubr in googlegroups]
Hi,
After using the latest changes from GitHub (listed from 7-8 days or so ago) , using the source code version of omicsplayground the program freezes after displaying all the splash screen and just at the data up,oad window -- the window becomes gray and takes no inputs
Error in R is as follows:
DBG [BiomarkerBoard:<input_pdx_select>]  reacted
Warning: Error in if: argument is of length zero
  113: <reactive:corrected_counts> [modules/UploadModule.R#247]
   97: countsRT
   96: renderUI [modules/MakeContrastModule.R#89]
   95: func
   82: renderFunc
   81: output$load-upload_panel-makecontrast-UI
    1: shiny::runApp
[checkTables] called
[checkTables] 1 :
[checkTables] 2 :
[checkTables] 3 :
[checkTables] 5 :
[checkTables] 10 :
[ComputePgxServer:@enable] enabling compute button
DBG [LoadingBoard::inputData] ---------- reacted ---------------
DBG [LoadingBoard::inputData] AUTHENTICATION= none
DBG [LoadingBoard::inputData] auth$logged= FALSE
Warning in mapply(children, flex, FUN = function(el, flexValue) { :
  longer argument not a multiple of length of shorter
Warning: The 'plotly_restyle' event tied a source ID of 'pcoords' is not registered. In order to obtain this event data, please add `event_register(p, 'plotly_restyle')` to the plot (`p`) that you wish to obtain event data from.
DBG [BiomarkerBoard:<input_pdx_select>]  reacted
Warning: Error in <observer>: object 'COLLECTIONS' not found
  44: <observer> [boards/ClusteringBoard.R#1405]
   1: shiny::runApp
Warning in mapply(children, flex, FUN = function(el, flexValue) { :
  longer argument not a multiple of length of shorter
With an application as large as this, it is worth splitting out the app.R file into separate ui.R and server.R files. The UI and server logic are two separate pieces of functionality and are easier to deal with in separate files.
Since there seems to be a lot of business logic that isn't part of the shiny app (most of the code in the /R folder), it would be worthwhile to consider converting this project into an R package. All of the non-shiny code would be exported from the package, and then you gain some of the best practices and tools that packages have. It'll naturally force your code to be more robust. The shiny app can be created inside the inst/ folder and will only contain code that is explicitly related to the web application, and this way it will be easier to manage the codebase - it'll be clear what parts of the code can be developed and tested independently of the shiny app. I don't think it would be a huge mission to convert the current project to a package because it seems the files are mostly organized in such a way that files are either fully shiny related or not. A file that doesn't use render*(), input$, output$, observe(), reactive() or UI elements is most likely a good file to move into the package and export its functions.
pgx.initDatasetFolder in global.R uses verbose = 1, whereas the functions inside use TRUE. Aim to be consistent in the variable classes.
I would love to see the implementation of MV imputation strategies into the platform.
Kind regards
Thorben
In server.R when initializing all the board modules, all of them take the entire env object as a sole parameter. This defeats one of the main purposes of using modules - being explicit about your requirements and limiting the scope of objects you can use/modify. Most of the boards only use one or two values (such as env[[“load”]][[“inputData”]] or env[[“expr”]][[“selected_gxmethods”]]) so each module should list the individual parameters it actually needs to use and only take those values
the "non" in method slot it uses COMBAT batch correction. isn't better to change this name?
Why do we unlock package internals?
I'm asking because this requires the package to be loaded in the global environment; we can't use the namespace for pathview
I set up a docker container to run Omics Playground (v2.5), and processed one of the public datasets to make a .ptx file. It uploaded ok, but when I clicked on "Compute!" there was one thing that raised some questions. 1) Where does the data get uploaded to when you're running your own docker instance? The docker container itself? Or is it getting uploaded to Omics Playground Cloud? Any info would be appreciated!
[originally posted on https://groups.google.com/d/msgid/omicsplayground/f964ce0a-8191-4ab8-ba50-94d258877dceo%40googlegroups.com]
I've been working on setting up a stand-alone instance on shiny-server, and kept getting a "something went wrong" error where the shiny app wouldn't load. Looking at the logs (attached), it boils down to the orca server not starting under shiny. I made sure it was in my path, I made sure it wasn't an issue with X11 forwarding, pretty much everything I could find. Eventually, I got it to work by running orca server in a docker container ("docker pull quay.io/plotly/orca") , and commenting out the lines that create the orca server and specifically check the local instance in shiny/global.R as below:
omicsplayground-kraig-20200812-154813-46793.log
Relevant log section below:
`*****************************************
***** starting local ORCA server ********
'*****************************************
Unable to init server: Could not connect: Connection refused
Unable to init server: Could not connect: Connection refused
(orca:6886): dbind-ERROR **: 15:48:20.326: AT-SPI: Couldn't connect to accessibility bus. Is at-spi-bus-launcher running?
Trace/breakpoint trap (core dumped)
Warning in system("orca --version", intern = TRUE) :
running command 'orca --version' had status 133
Error in if (orca_version() >= "1.1.1") "--graph-only" :
argument is of length zero
Calls: runApp ... source -> withVisible -> eval -> eval ->
Execution halted`'
System Info:
Ubuntu 18.04 LTS
Shiny Server v1.5.12.933 (Node.js v10.15.3)
Docker v19.03.12
(Let me know what other info is relevant and I will add it)
There are 16 instances of the ID sidebar, one for each tab page. I understand that there is only one sidebar visible at any given time, but they all exist on the page (just not visible) at the same time, which is not legal. You cannot have more than one element with the same ID.
If you pass the namespace to tabView then you can set unique IDs for each sidebar.
All UI elements should be created from the UI part of a module which improves the code readability and performance.
Would be nice to show the statistics of the selected database: how many drugs, how many perturbation profiles.
When I open the "Overlay/Similarity table" under the "Signature/Test Signatures" tab, I noticed that hovering over individual Histogram entries does not show the name of the entry, but shows instead "%{text}". I have included a screenshot below to highlight the bug:

[email Thorben S. 19.05.2021]
"And lastly, I have some more feedback for you: We think it would be very convenient if the home screen/data view would offer the function of filtering or sorting the datasets by the uploaddate."
The local installation needs to be able to work without errors. There are several packages that are being used which are no longer available on CRAN/BioConductor. If these packages are required for the application to run, it would help to install the specific version of the package that works from the archives.
I'm experiencing an inconsistent error message that affects some but not all of my datasets. When I open the "Dataview/Samples" tab, I do not see any phenotype clustering plot and get instead the following error message (see attached image):

Currently there is no feedback to the user while the app is calculating or plotting something. A simple spinner for example would solve this issue and improve the user experience.
There is a double sourcing of pgx-functions.R and pgx-files.R - in global.R and pgx-include.R
I have a dataset (~900 cells, 8000 genes) of scRNAseq that is loaded in and working pretty decently. However, the cytoplot graph is throwing an error. Looking at the logs I get:
Warning: Error in kde2d: bandwidths must be strictly positive
  187: stop
  186: kde2d
  185: pgx.cytoPlot
  184: <reactive>
  182: .func
  179: contextFunc
  178: env$runWith
  171: ctx$run
  170: self$.updateValue
  168: func
  167: renderPlot
  165: func
  125: drawPlot
  111: <reactive:plotObj>
   95: drawReactive
   82: origRenderFunc
   81: output$scell-sc_cytoplot-renderfigure
    1: runApp
I tried something suggested here: https://stackoverflow.com/questions/53075331/error-using-geom-density-2d-in-r-computation-failed-in-stat-density2d-b and replaced the following code:
    z1 <- kde2d( x1[j1], x2[j1], n=50)
    z2 <- kde2d( x1[j2], x2[j2], n=50)
    z3 <- kde2d( x1[j3], x2[j3], n=50)
    z4 <- kde2d( x1[j4], x2[j4], n=50)
with
    z1 <- kde2d( x1[j1], x2[j1], n=50, h = c(ifelse(bandwidth.nrd(x1[j1]) == 0, 0.1, bandwidth.nrd(x1[j1])), ifelse(bandwidth.nrd(x2[j1]) == 0, 0.1, bandwidth.nrd(x2[j1]))))
    z2 <- kde2d( x1[j2], x2[j2], n=50, h = c(ifelse(bandwidth.nrd(x1[j2]) == 0, 0.1, bandwidth.nrd(x1[j2])), ifelse(bandwidth.nrd(x2[j2]) == 0, 0.1, bandwidth.nrd(x2[j2]))))
    z3 <- kde2d( x1[j3], x2[j3], n=50, h = c(ifelse(bandwidth.nrd(x1[j3]) == 0, 0.1, bandwidth.nrd(x1[j3])), ifelse(bandwidth.nrd(x2[j3]) == 0, 0.1, bandwidth.nrd(x2[j3]))))
    z4 <- kde2d( x1[j4], x2[j4], n=50, h = c(ifelse(bandwidth.nrd(x1[j4]) == 0, 0.1, bandwidth.nrd(x1[j4])), ifelse(bandwidth.nrd(x2[j4]) == 0, 0.1, bandwidth.nrd(x2[j4]))))
to pre-compute the bandwidth value. That somewhat worked (some genes would plot), but gave a new error on the genes that didn't work (that I know are expressed in the dataset):
Warning: Error in contour.default: increasing 'x' and 'y' values expected
  188: stop
  187: contour.default
  185: pgx.cytoPlot
  184: <reactive>
  182: .func
  179: contextFunc
  178: env$runWith
  171: ctx$run
  170: self$.updateValue
  168: func
  167: renderPlot
  165: func
  125: drawPlot
  111: <reactive:plotObj>
   95: drawReactive
   82: origRenderFunc
   81: output$scell-sc_cytoplot-renderfigure
    1: runApp
Thoughts on what might be going on, or what else to try?
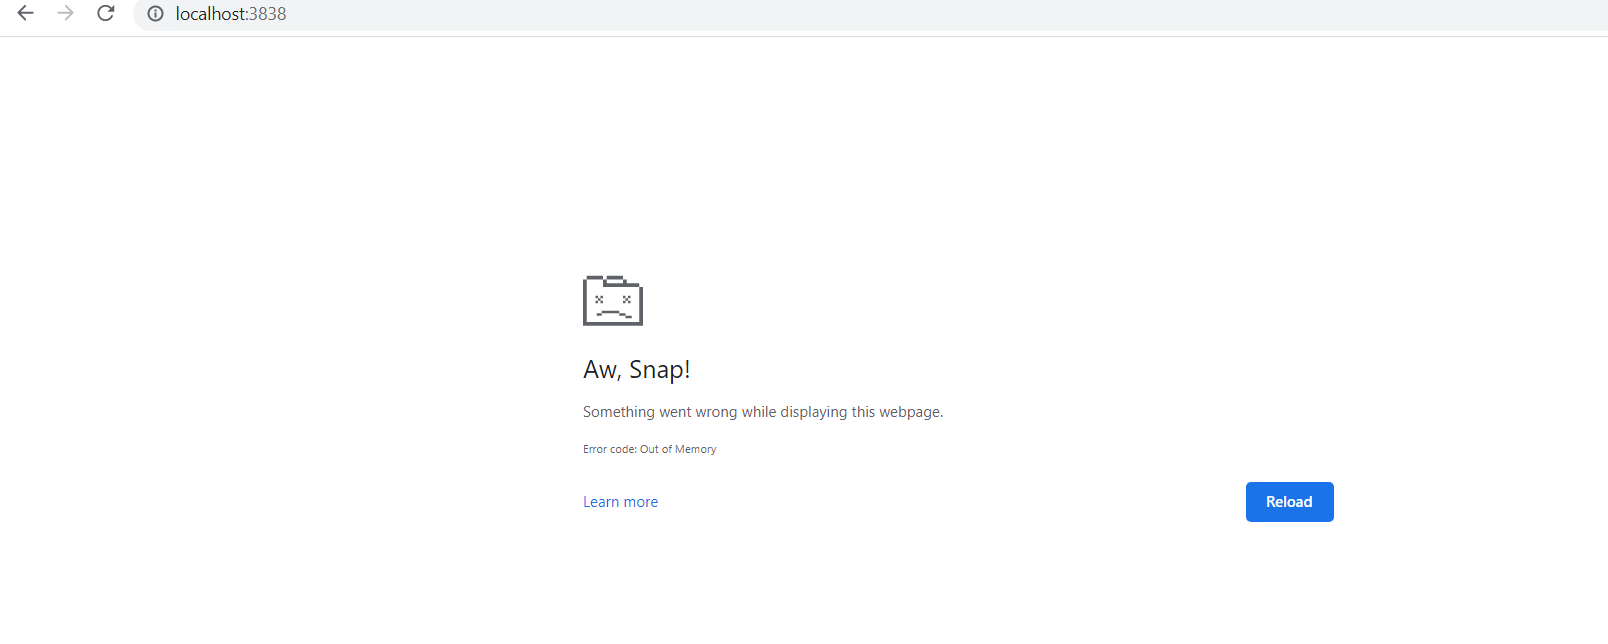
This has been a common complain among Chrome users. After a while the Platform crashes with the error below.
This is a recent problem that started about 3-4 weeks ago. Previous versions of Chrome did not show this error.
Star symbols not appearing in enrichment tab in Docker version but seems OK in source version. Stars appearing correctly in differential expression modules (docker+source).
[originally found by AM]
Hi, any plans to add support for isobaric labeling analyses?
I (as well as several other users) have noticed this frequent issue, which appears to be OS- and browser-independent. The yellow message boxes do not disappear once a scroll down menu has been closed and remain on the browser even when changing module (see picture below).

Hi there!
Can someone with sufficient rights rename master to main?
https://www.git-tower.com/learn/git/faq/git-rename-master-to-main
Cheers
I noticed an issue with the Partial connection networks plots (under the 'Expression' tab). The plots are not converted as pdf or png files, but instead saved as html files.
Sys.setlocale does not work on windows
An"out of bounds" error message (see picture below) appears when trying to visualise the leading edge graph.

The vast majority of customised styling is included in .css files, however there are a few instances where tags$style or the style parameter is being used - all CSS should be provided in a CSS file.
The header parameter of navbarPage() is meant to accept UI that will be shared among all the tabs. It's not meant to take arbitrary “setup” HTML. Instead, the entire navbarPage() can be wrapped in a tagList along with the other setup HTML. This also eliminates the double-tagList of the header and footer variables.
I recently started using omicsplayground, and started with the docker version. It seemed to work, then seemed to randomly break. Upon further investigation (and checking with the other install I have set up), it seems that some of the older data scripts keep the whole thing from starting. The main culprit I've seen is GSE98638-scliver.pgx (script to create it is scripts/pgx-GSE98638-scliver.) Removing that file from the data folder allows the entire software to function again.
The log file section when this happens is:
`
'*****************************************
******** parsing OPTIONS file ***********
*****************************************'
TITLE = Omics Playground
USER_MODE = PRO
AUTHENTICATION = none
ENABLE_UPLOAD = TRUE
MAX_SAMPLES = 20
MAX_COMPARISONS = 5
MAX_GENES = 19999
WATERMARK = TRUE
DEV_VERSION = FALSE
MODULES_DISABLED = tcga multi
Error in rownames<-(*tmp*, value = character(0)) :
attempt to set 'rownames' on an object with no dimensions
Calls: runApp ... pgx.initDatasetFolder -> pgx.initDatasetFolder1 -> rownames<- -> rownames<-
Execution halted
`
Is there any way to rework things such that the app throws a more visible error for bad files?
Currently everything is accessible from everywhere and it's impossible to know where a variable comes from and who should use it.
All inline javascript should be moved to separate .js files. Improves code readability and makes the JavaScript code easier to maintain.
Might also be useful to create multiple .js files (for example: firebase.js, userAuthentication.js, customInteractions.js ...)
There is a lot of dead code, which makes it more difficult to traverse the code and understand what's important and what's not.
omicsplayground/R/gx-heatmap.r
Line 1226 in c129c58
Is this warnin supposed to fire when dendrogram <- "none" or all the time?
Reading this huge list takes several seconds, is it absolutely necessary? Maybe consider moving this data into eg. a SQLite database where you can reference the required IDs rather than loading the entire list on init.
It seems like the app itself is single-thread. Do you think that is a shiny-server limitation, or something inherent to the app itself? I've got some horsepower to throw at it, would be great to speed it up.
[originally posted by email by KT on 13.08.2020]
Upload fails if CSV has extra empty lines. Some CSV files have erroneously trailing empty lines. Upload will fail and give an error by detecting "duplicated lines".
Continuing on my previous issue.
On the source version in R, I pulled the updates and now I get a new error: (the webpage becomes gray and hangs)
Warning in mapply(children, flex, FUN = function(el, flexValue) { :
longer argument not a multiple of length of shorter
Warning: The 'plotly_restyle' event tied a source ID of 'pcoords' is not registered. In order to obtain this event data, please add event_register(p, 'plotly_restyle') to the plot (p) that you wish to obtain event data from.
DBG [BiomarkerBoard:<input_pdx_select>] reacted
Warning: Error in : object 'COLLECTIONS' not found
44: [boards/ClusteringBoard.R#1405]
1: shiny::runApp
Warning in mapply(children, flex, FUN = function(el, flexValue) { :
longer argument not a multiple of length of shorter
Get rid of pryr, it's no longer maintained and a core dependency of the app.
Drug connectivity give "incorrect number of dimensions" if dataset has only 1 comparison.
[Axel GSE166321]
Problem: Volcano plot gives error ot "Must supply text to annotation" if logFC is too high and there are no significant genes.
Temporary solution: lower FC threshold
(on Timo's data)
The outputs are being downloaded as html files rather than PNG or PDF files in the Gene Correlation Network tab. I noticed the same issue with the Gene Ontology Map plot.
A declarative, efficient, and flexible JavaScript library for building user interfaces.
🖖 Vue.js is a progressive, incrementally-adoptable JavaScript framework for building UI on the web.
TypeScript is a superset of JavaScript that compiles to clean JavaScript output.
An Open Source Machine Learning Framework for Everyone
The Web framework for perfectionists with deadlines.
A PHP framework for web artisans
Bring data to life with SVG, Canvas and HTML. 📊📈🎉
JavaScript (JS) is a lightweight interpreted programming language with first-class functions.
Some thing interesting about web. New door for the world.
A server is a program made to process requests and deliver data to clients.
Machine learning is a way of modeling and interpreting data that allows a piece of software to respond intelligently.
Some thing interesting about visualization, use data art
Some thing interesting about game, make everyone happy.
We are working to build community through open source technology. NB: members must have two-factor auth.
Open source projects and samples from Microsoft.
Google ❤️ Open Source for everyone.
Alibaba Open Source for everyone
Data-Driven Documents codes.
China tencent open source team.