Giter Club home page Giter Club logo

yfiles-jupyter-graphs's Introduction

yFiles Graphs for Jupyter logo

PyPI version

A graph diagram visualization widget for Jupyter Notebooks and Labs powered by yFiles for HTML.

Easily visualize graphs from various sources: Networkx✅, igraph✅, neo4j✅, pygraphviz✅, and any structured Python dictionaries and lists. Many more formats supported indirectly via Networkx imports!

The widget is supported in the default Jupyter environments, but also in other environments like VS Code or Google Colab.

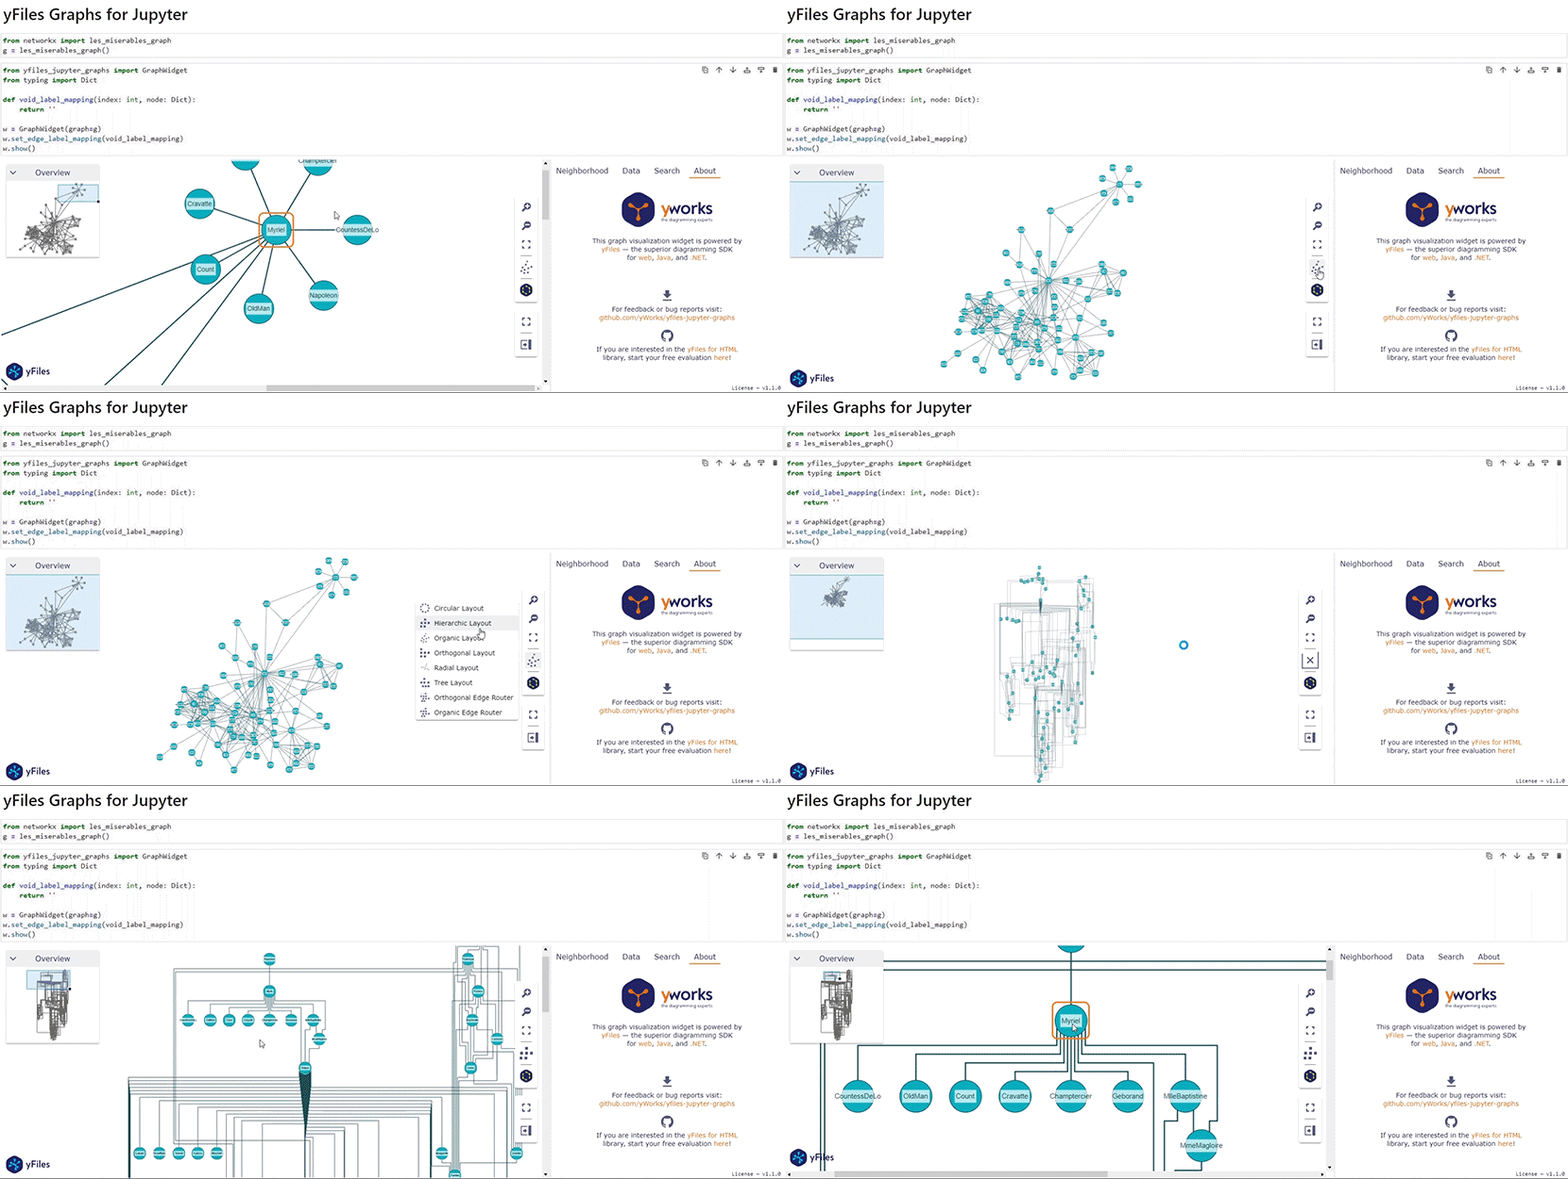
yFiles Graphs for Jupyter

Try the Introduction notebook on Google Colab here.

Supported Environments

Requirements

Installation

If you already have Jupyter installed, just pip install the prebuilt extension from the Python Package Index.

pip install yfiles_jupyter_graphs

If you want to start clean and get a fresh new Jupyter Lab with the widget readily installed and available, you can use docker, too:

Form a shell, create a docker image that contains all that is required:

mkdir yfiles-jupyter && cd yfiles-jupyter
echo -e "FROM jupyter/scipy-notebook\nRUN pip install yfiles-jupyter-graphs" > Dockerfile
docker build -t yfiles-jupyter-graphs-on-docker .

(the above has been tested successfully with scipy-notebook:lab-3.4.7 and yfiles-jupyter-graphs==1.2.1), but we want to make sure that it will also work with upcoming versions - file an issue if it doesn't work for you!)

You can then create a fresh new instance of your server from this image like so:

docker run -it -p 8888:8888 --name yfiles-jupyter yfiles-jupyter-graphs-on-docker

Usage

In a notebook which has the wiget installed in the server, in a Python cell, you can then do this:

"""Execute in jupyter notebook or jupyter lab"""
from yfiles_jupyter_graphs import GraphWidget
# shows empty widget
GraphWidget()

You can find the full documentation here.
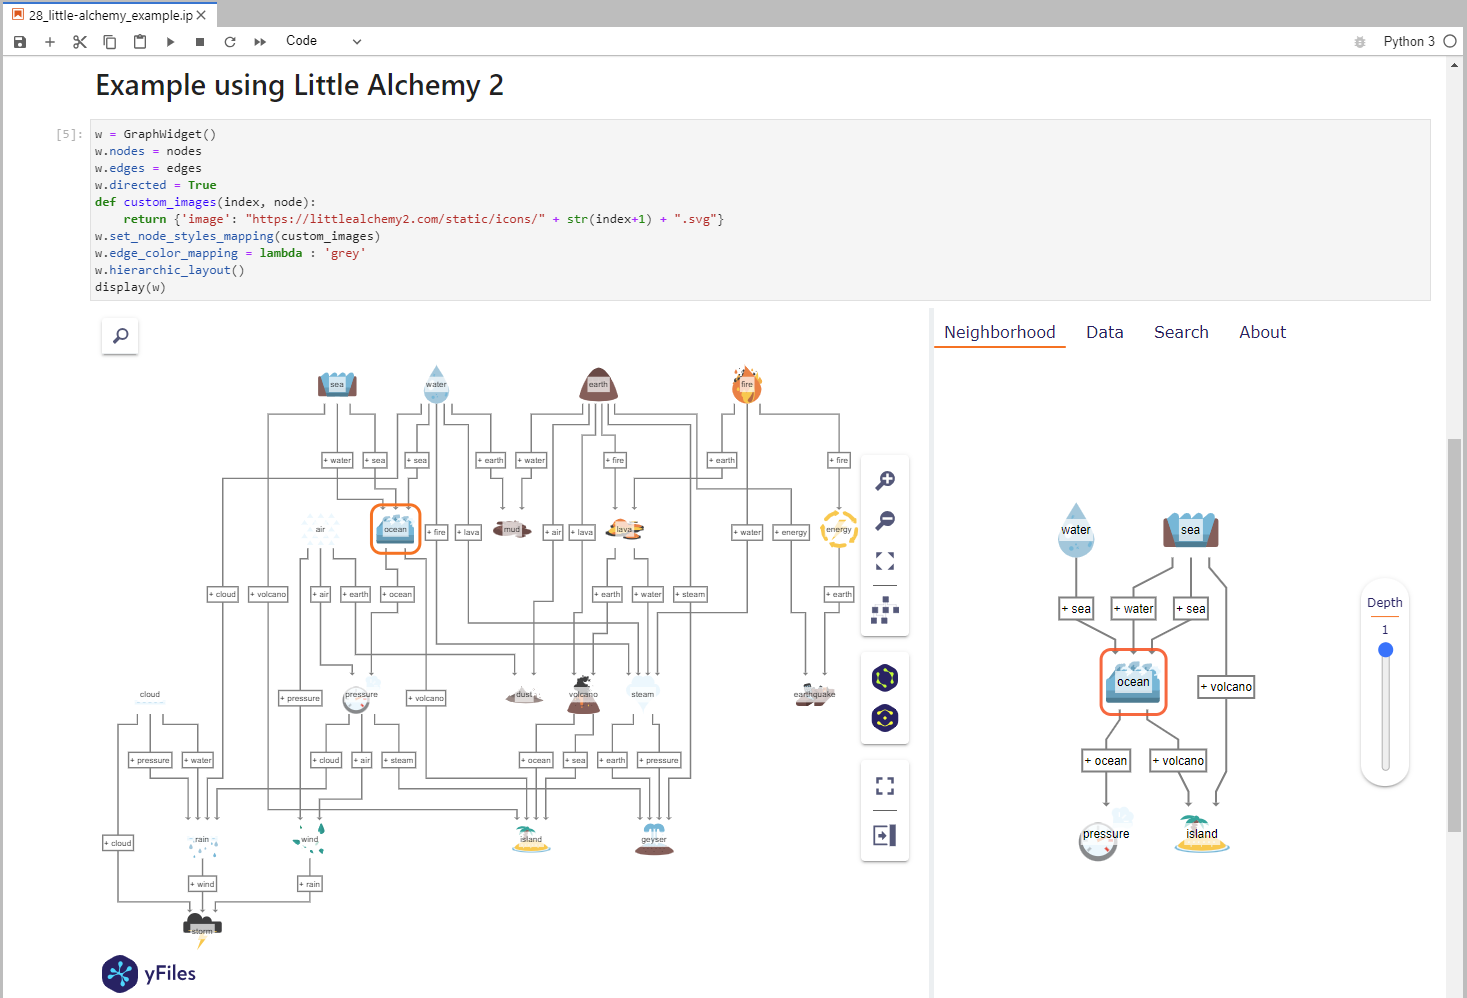
Features

neighborhood sidebar See Node Neighborhood
Open In Colab
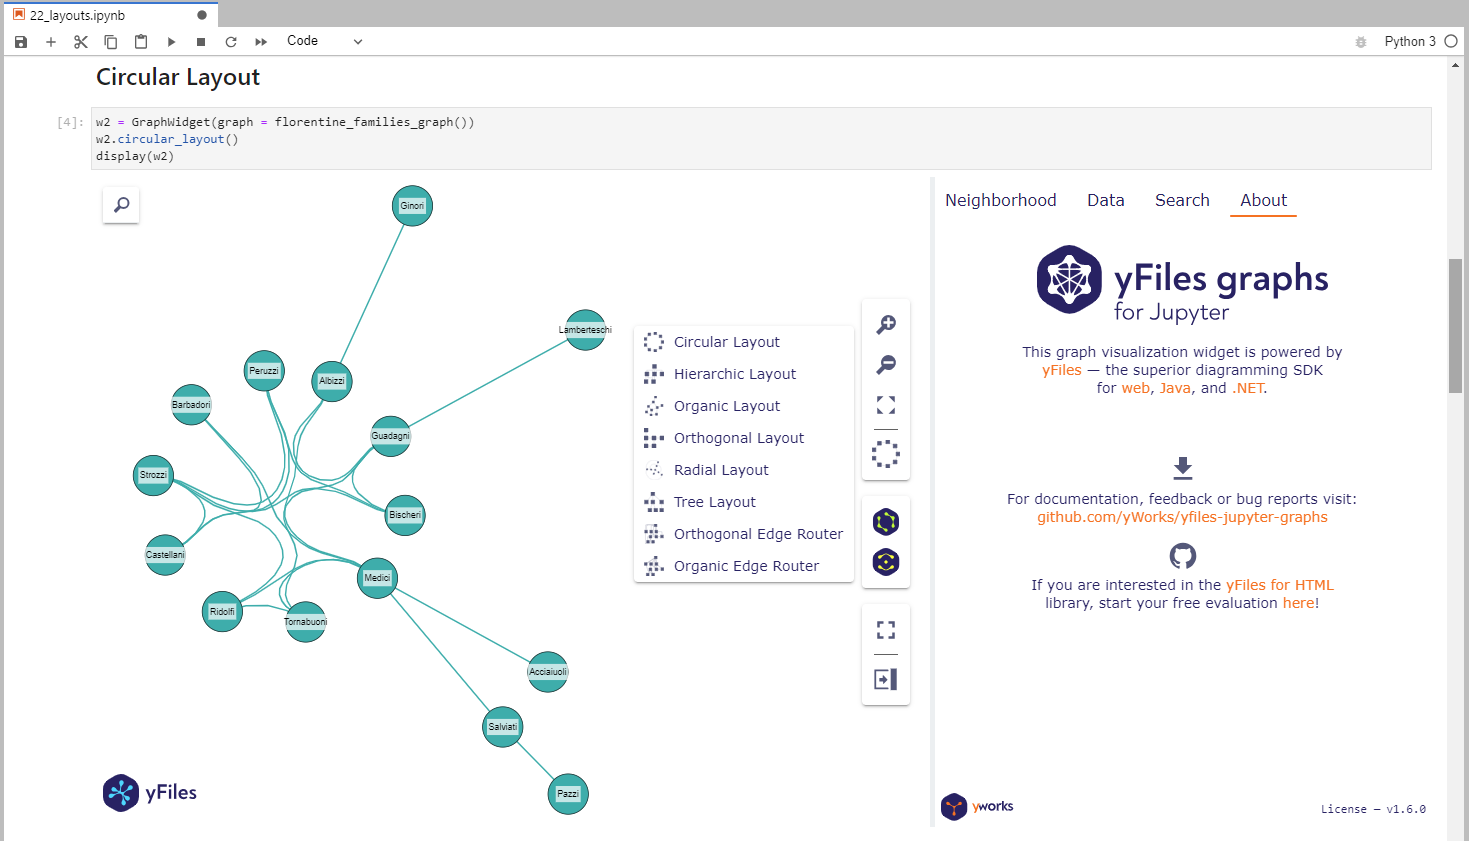
layouts Choose Graph Layout
Open In Colab
data sidebar Investigate Nodes or Edges Data
Open In Colab
search sidebar Search for Nodes or Edges
Open In Colab
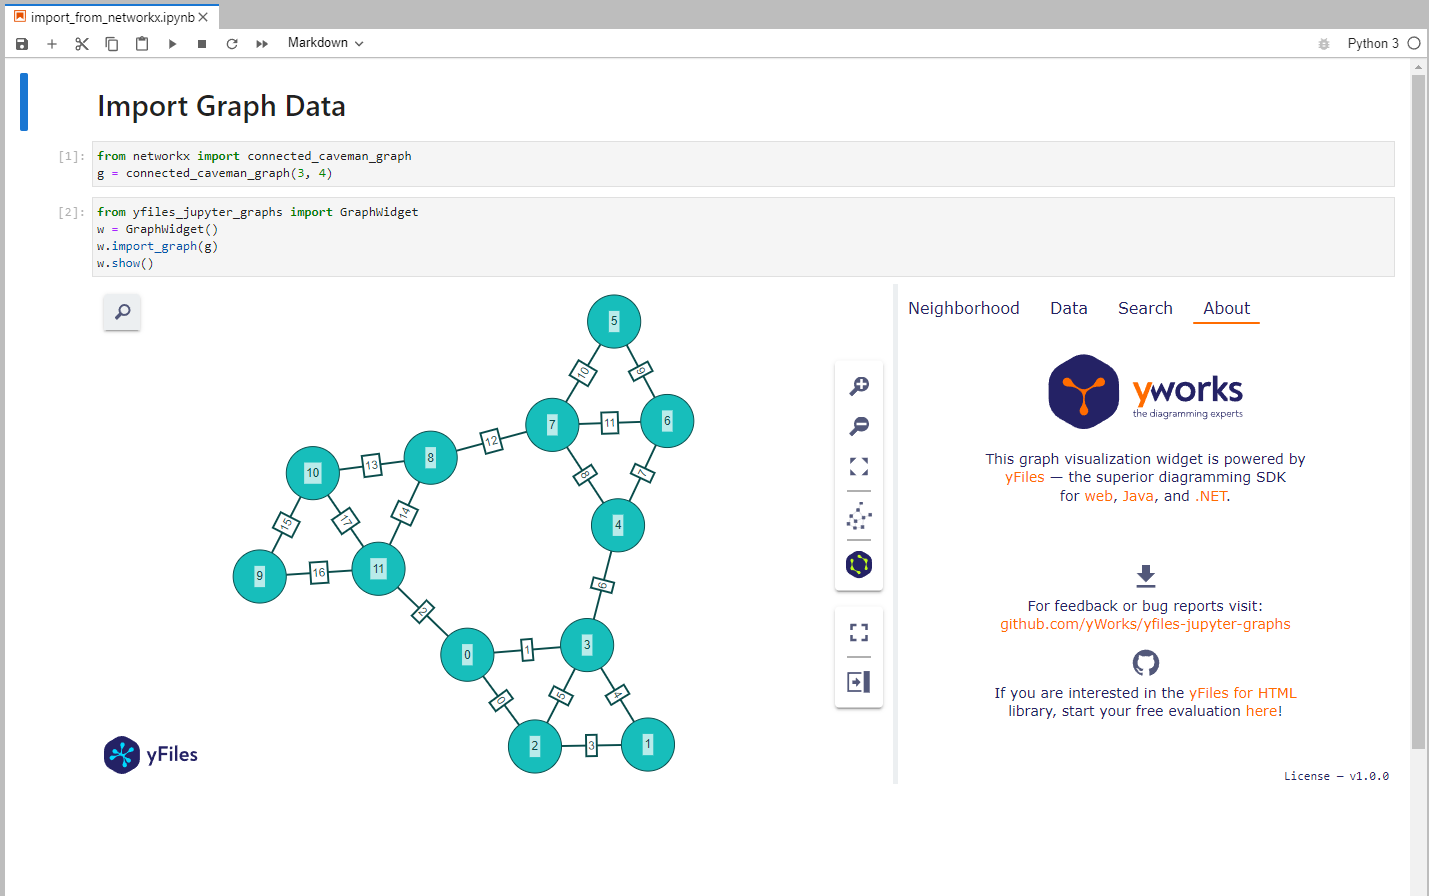
importer Import Graph Data
Open In Colab
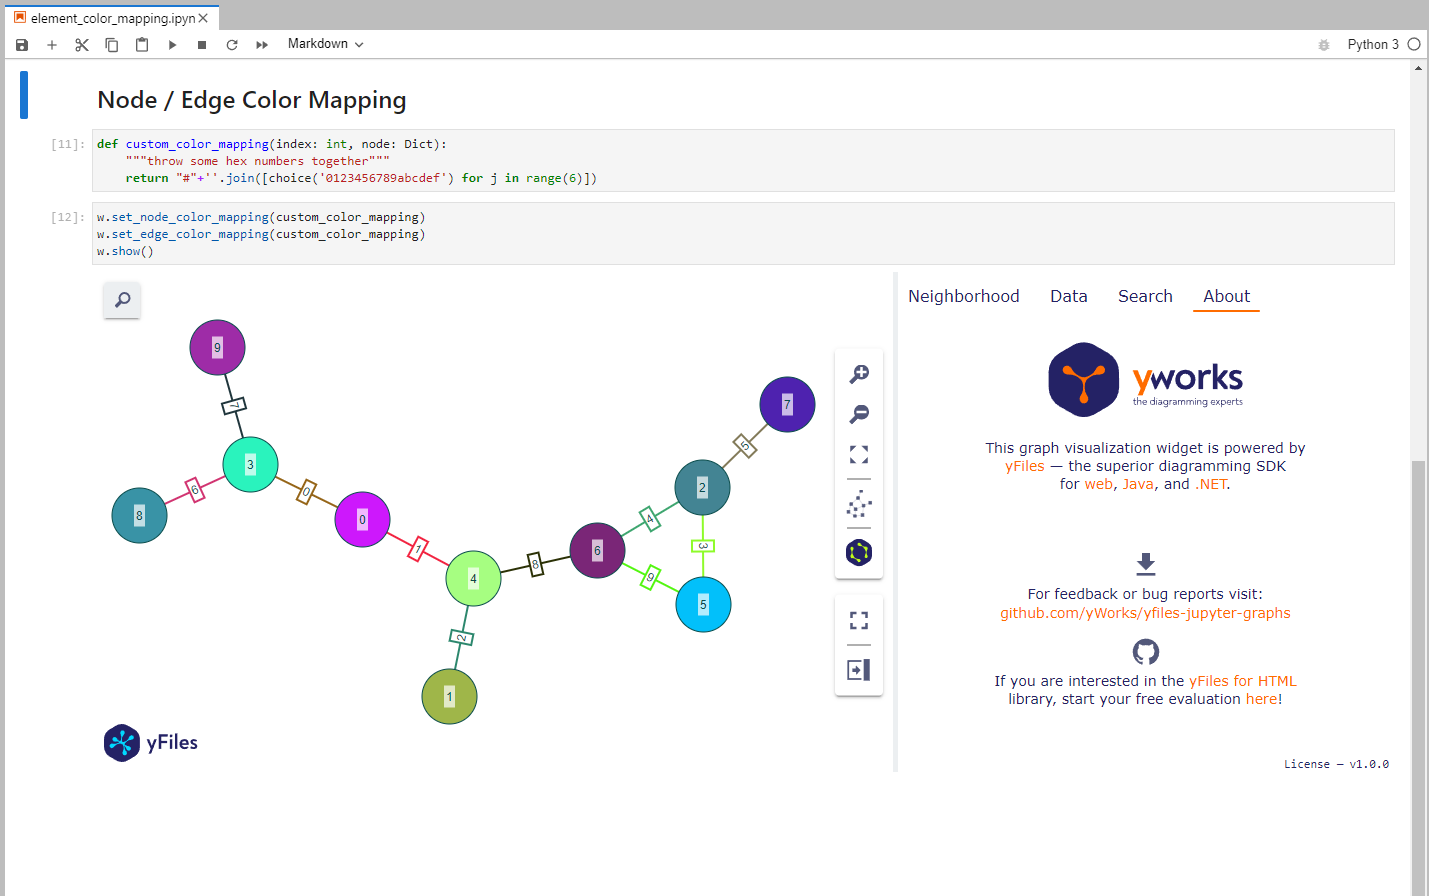
element color mapping Make Data Dependent Property Changes
Open In Colab

For example code look here.

Google Colab Examples

You can try the example notebooks in Google Colab by opening GitHub notebook URL: https://colab.research.google.com/github/yWorks/yfiles-jupyter-graphs/blob/main/examples/<notebook.ipynb>.

For example the Introduction notebook:
https://colab.research.google.com/github/yWorks/yfiles-jupyter-graphs/blob/main/examples/01_introduction.ipynb

Documentation

You can find the documentation here.

Code of Conduct

This project and everyone participating in it is governed by the Code of Conduct. By participating, you are expected to uphold this code. Please report unacceptable behavior to [email protected].

Feedback

This widget is by no means perfect. If you find something is not working as expected we are glad to receive an issue report from you. Please make sure to search for existing issues first and check if the issue is not an unsupported feature or known issue. If you did not find anything related, report a new issue with necessary information. Please also provide a clear and descriptive title and stick to the issue templates. See issues.

Dependencies

License

See LICENSE file.

yfiles-jupyter-graphs's People

Contributors

fskpf avatar yguy avatar

Stargazers

 avatar  avatar  avatar  avatar  avatar  avatar  avatar  avatar  avatar  avatar  avatar  avatar  avatar  avatar  avatar  avatar  avatar  avatar  avatar  avatar  avatar  avatar  avatar  avatar  avatar  avatar  avatar  avatar  avatar  avatar  avatar  avatar  avatar  avatar  avatar  avatar  avatar  avatar  avatar  avatar  avatar  avatar  avatar  avatar  avatar  avatar  avatar  avatar  avatar  avatar  avatar  avatar  avatar  avatar  avatar  avatar  avatar  avatar  avatar  avatar  avatar  avatar  avatar  avatar  avatar  avatar  avatar  avatar  avatar  avatar  avatar  avatar  avatar  avatar  avatar  avatar  avatar  avatar  avatar  avatar  avatar  avatar  avatar  avatar  avatar  avatar  avatar  avatar  avatar  avatar  avatar  avatar  avatar  avatar  avatar  avatar  avatar  avatar  avatar  avatar

Watchers

 avatar  avatar  avatar  avatar  avatar  avatar  avatar

yfiles-jupyter-graphs's Issues

Document ways to customize default graph imports

Describe the bug
the widget allows for easily importing many different graph formats. However it is unclear from the documentation or example how they can be customized.

To Reproduce
Steps to reproduce the behavior:

  1. Use any of the example on the internet that work with pandas dataframes or networkx graphs
  2. Import the graph using GraphWidget(graph = mygraph)
  3. Try to declare bindings for things like edge thickness, color, size, etc.
  4. You will run into all kinds of ugly Python errors because its unclear what "index" is referring to, nor what "node" or "edge" actually are

Expected behavior
I would love to see the examples augmented to show how to easily do bindings e.g. to a pandas column, or to a property declared in a networkx graph. Without them, it's hard to make the best out of the powerful binding features.

Multiselection on labels

Currently, selecting a label of an edge selects the edge itself. Using multiselection (holding CTRL) empties the selection, which is not the expected behaviour, and then selects the edge.

Error: No version of module yfiles-jupyter-graphs is registered

Describe the bug
The following error appears after having installed yfiles-jupyter-graphs.

To Reproduce
Steps to reproduce the behavior:

  1. pip install yfiles-jupyter-graphs
  2. done so in base conda environment and specific conda environment
  3. running `from yfiles_jupyter_graphs import GraphWidget

shows empty widget

GraphWidget()` in a notebook cell
4. See error
Works by the way in Safari but not in chromium based Brave Browser

Expected behavior
see the widget.

Screenshots
image

image image

Desktop (please complete the following information):

  • MacOs Sonoma 14.1 M2 arm64
  • Brave
  • 1.60.114

Additional context
Add any other context about the problem here.

Exception with ipywidgets 8 - AttributeError: 'super' object has no attribute '_ipython_display_'

Describe the bug
Widget fails with AttributeError: 'super' object has no attribute '_ipython_display_'

To Reproduce
For example, install the widget in a fresh environment:

$ conda create -n currentlab -c conda-forge python jupyterlab
$ conda activate currentlab
$ pip install yfiles-jupyter-graphs

Then inspect the ipywidgets version that has been installed implicitly by the yfiles-jupyter-graphswidget

$ pip list

It'll show ipywidgets 8.x.x.

Then try to run the widget in a jupyter lab notebook. Among other errors, it'll throw AttributeError: 'super' object has no attribute '_ipython_display_'

Expected behavior
It should just work.

Feature Request: being able to drag selected nodes

It would be great if it was possible to manually arrange the layout - sometimes it is very crowded. Perhaps by simple moving selected nodes when dragging on top of them instead of translating the view?

Document which styles can be specified

I haven't found the list of styles which I can override for a node or for an edge. There are examples, sure, but I saw nothing definitive. E.g., I know that I can change the node "color" and the node "shape" via set_node_styles_mapping(). Is there anything else? Can I set the node width to fit the label, for example? Or set a gradient background for the node? Change stroke color? Etc.

w.show() not working in jupyter notebook

Describe the bug
I am not able to see the actual diagram, but I get no error messages.

To Reproduce

from networkx import connected_caveman_graph
from yfiles_jupyter_graphs import GraphWidget
w = GraphWidget()
w.show()

g = connected_caveman_graph(3, 4)
w.import_graph(g)
w.show()

Expected behavior
I expected to see the diagram as in the example in guthub.

Screenshots
If applicable, add screenshots to help explain your problem.

Desktop (please complete the following information):

  • Mac M1
  • MacOs
  • Chrome
  • Notebook server 6.0.1
  • Ipython 7.27
  • Python 3.7.4

Additional context
Add any other context about the problem here.

Do not require "properties" to be specified by default for nodes

Describe the bug
For simple cases, it should not be required to provide "properties" for nodes.

To Reproduce
Steps to reproduce the behavior:

  1. Start with the introduction sample
  2. Omit "properties" from one of the nodes:
w.nodes = [
    {"id": 0},
    {"id": "one", "properties": {"firstName": "Bravo", "label": "Person B"}},
    {"id": 2.0, "properties": {"firstName": "Charlie", "label": "Person C", "has_hat": False}},
    {"id": True, "properties": {"firstName": "Delta", "label": "Person D", "likes_pizza": True}}
]
  1. Show the widget using w.show()
  2. Observe the error
File /opt/conda/lib/python3.9/site-packages/yfiles_jupyter_graphs/widget.py:976, in GraphWidget.default_element_label_mapping(index, element)
    939 @staticmethod
    940 def default_element_label_mapping(index: int, element: TDict):
    941     """The default label mapping for graph elements.
    942 
    943     Element (dict) should have key properties which itself should be a dict.
   (...)
    974 
    975     """
--> 976     properties = element['properties']
    977     return str(properties.get('label', properties.get('yf_label', index)))

Expected behavior
This should be required by default. Some people have nodes without properties and it would still be useful.

License.md missing space :-)

Describe the bug
When you come across such an INCREDIBLE repo:

  1. you feel the urge to say "Thank you!" somehow (bugs seem to be the only quick option except the star)
print("Thank you!\n" * 1000)
  1. you start wondering why doesn't it have 30k stars (and then you see it's only 2 months old, hmm...)
  2. you start thinking "for sure there must be a catch" (btw. I did NOT find any catch) and look at the license file - there I found the "bug" - there is a space chr missing after the comma 😄 (see below)

To Reproduce
Steps to reproduce the behavior:

  1. Go to LICENSE.md
  2. Scroll down to 1.2.ii
  3. See the missing space
... create derivative works,modify, translate, ...
                           ^

Expected behavior
There should be a space :-)

Additional context
OCD aside: big, BIG "thank you" for this (!)

Neighborhood view layout can crash the page

Describe the bug
In case of really really dense graphs, the neighborhood view (when used with more than one layer) can become a bottleneck and since it seems to be running the layout on the main thread, it can block the page.

To Reproduce
Steps to reproduce the behavior:

  1. Use a really really dense and large graph
  2. Click on a node
  3. Go to the overview and pull the slider down
  4. Observe the page freezing

Expected behavior
For truely large graphs, we should not be showing them in the overview anyway. But if we do, we should run the layout in a worker.

Failed to load model class 'GraphModel' from module 'yfiles-jupyter-graphs'

Describe the bug
[Open Browser Console for more detailed log - Double click to close this message]
Failed to load model class 'GraphModel' from module 'yfiles-jupyter-graphs'
Error: No version of module yfiles-jupyter-graphs is registered

Expected behavior
A clear and concise description of what you expected to happen.

Screenshots
image

image

Desktop (please complete the following information):

  • OS: Ubuntu 20.04 WSL
  • Browser : chrome 123.0.6312.58 (64 bit)
  • Version:
    yfiles-jupyter-graphs v1.5.0 enabled OK (python, yfiles_jupyter_graphs)
    jupyter-matplotlib v0.11.3 enabled OK
    jupyterlab_pygments v0.3.0 enabled OK (python, jupyterlab_pygments)
    @jupyter-notebook/lab-extension v7.1.2 enabled OK
    @jupyter-widgets/jupyterlab-manager v5.0.10 enabled OK (python, jupyterlab_widgets)

Add a dark mode to the widget

Jupyter Lab supports a dark theme which is currently not considered in the UI of the widget at all.

It would be nice to adjust the widget's UI to the (current) notebook theme.

Feature: Provide more styling options for labels

Users might want to further style their labels. Currently everything happens automatically.
What might be of interest is font size, text color, text wrapping/trimming/max text size, placement.

I could imagine we could do it similarly to the node styling options.

Currently, if someone wants to add more information to a label on the screen, there are only very few options and the only workaround is to create a custom template in the data explorer.

Default node / edge label mapping always creates labels in the diagram

Describe the bug
The default mappings for nodes and edges always fall back to the item's index if no label property is given. Therefore, graph items always have at least the index as label.

To Reproduce
Delete the label property in the data of the introduction graph and show the diagram.

Expected behavior
No label should be displayed if the data doesn't contain a label property.

Additional context
This behavior can be adjusted by setting another label mapping function:

def custom_label_mapping(index: int, node: Dict):
    """don't show any label"""
    return ''

w.set_node_label_mapping(custom_label_mapping)
w.set_edge_label_mapping(custom_label_mapping)

I think the better default may be to remove the index label fallback and let users explicitly add the index label by overwriting the label mapping.

Feature request: actions/callbacks for selected nodes

It would be great if there was an option to add new functions to the viewer.

E.g. add a button in a tab pane for triggering a Python function with the selected nodes as arguments. And allow the Python function to modify/update the graph.

I'm thinking along the lines of adding functionality like in Bloom - but this could be so much more powerful because you could integrate with all kinds of external sources from your code.

For very large graphs, offer DataExplorer view

When you try to open a large graph, it can take a while until the graph displays. Depending on initial layout and styling, it might take too long and annoy you, when you opened the graph accidentally or not being aware of its size.

In these cases, we could present a (configurable?) warning to the user and offer to immediately open the graph in data explorer mode where there should be fewer issues when you incrementally show the graph.

Plugin is not working with Sagemaker

Describe the bug
By deploying a notebook [Amazon Linux 2, Jupyter Lab 3 (notebook-al2-v2)] on Sagemaker, we want have the GraphWidget working on Jupyter Lab.

We are adding screenshots to showcase the problem. Restarting kernel does not change this behavior. We have also tried some setup on notebook start, no success.

To Reproduce
Check on screenshots.

Expected behavior
Have GraphWidget working on Sagemaker Jupyter Notebook.

Screenshots
Creating the instance and launching it
image

Notebook is fresh, we will create a new notebook file
image

Available plugin
image

Installed lib, and now it's on showing on labextension list
image

Full error
image

Desktop (please complete the following information):

  • OS: MacOS
  • Browser Chrome
  • Version MacOS -> 14.4.1 / Chrome -> 124.0.6367.91

Additional context

We also have tried creating custom kernels, with many different library versionings, no success also. We had a similar problem on kubeflow, but since we were able to create the image that is going to be used, we have managed to find a good versioning to have it working there. Same versioning does not work on Sagemaker.

On kubeflow, we had this configuration for it to work, on Python 3.9.16:

RUN python3 -m pip uninstall -y \
    traitlets
# Downgrading was necessary, found it somewhere when troubleshooting
RUN python3 -m pip install --no-cache-dir \
    traitlets==5.9.0
# Libs related to Neo4j and Graph visualization
RUN python3 -m pip install --no-cache-dir \
    ipywidgets==8.1.1 \
    jupyterlab-widgets==3.0.9 \
    yfiles_jupyter_graphs==1.4.8

EDIT:

Adding versioning of the Sagemaker notebook:

IPython          : 8.22.2
ipykernel        : 6.29.3
ipywidgets       : 8.1.2
jupyter_client   : 8.6.1
jupyter_core     : 5.7.2
jupyter_server   : 2.13.0
jupyterlab       : 4.1.5
nbclient         : 0.10.0
nbconvert        : 7.16.3
nbformat         : 5.10.3
notebook         : 7.1.2
qtconsole        : 5.4.4
traitlets        : 5.14.2

Allow hierarchically nested graphs.

yFiles easily supports nested graphs, and for large graphs this can really help with both exploration and visual clarity.
Offer ways to declare group nodes/node aggregations.

Also provide the option to expand/collapse nodes interactively and to start with collapsed group nodes.

Graph is invisible

Describe the bug
The graph is invisible unless I zoom in on a small section of the graph.

To Reproduce
Steps to reproduce the behavior:
Run the following notebook

Expected behavior
Always show the whole graph.

Screenshots
Screen Shot 2024-01-02 at 11 45 26 PM

Desktop (please complete the following information):

  • OS: Google Colab
  • Browser: Chrome Version
  • Version: 120.0.6099.129 (Official Build) (x86_64)

Additional context
Add any other context about the problem here.

PyPi package currently installs as `yfiles-jupyter-graphs` rather than `yfiles_jupyter_graphs`

Describe the bug
PyPi package currently installs as yfiles-jupyter-graphs rather than yfiles_jupyter_graphs. The dash chars are a syntax error and breaks imports. All package examples reference the syntactically correct underscore package name.

To Reproduce
Steps to reproduce the behavior:

  1. Install as described on the PyPi.org pkg page or the GitHub repo's readme.
  2. The installation will result in the dash-named package even if you request the underscore named package which processes but gives you the dash-named package.
  3. Try to run an example and it can't find the named package.
  4. Rename example to match the dash-named installation and you get a syntax error halt to execution.

Expected behavior
Installing should result in yfiles_jupyter_graphs package install.

Desktop (please complete the following information):

  • OS: M1 macOS

Feature Request: Widget Column Binding

Is it possible to do the column binding that Sebastian mentioned in this video in the Python widget?
Neo4j Live: Easy Graph Visualisations for Data Scientists with yworks
https://youtu.be/Kb6ZiXuq2eE?t=3519

I work with a lot of hierarchical data, where the nodes have properties about the level in the taxonomy that I would love to be able to visualize via the hierarchical view. In the video, Sebastion does this in the developer mode, is this something that can be achieved in the widget with the /node_position_mapping? https://github.com/yWorks/yfiles-jupyter-graphs/blob/main/examples/node_position_mapping.ipynb

Thank you!

Feature - navigate in the neighborhood

There is no mouse dragging or mouse wheel zooming enabled in the neighborhood view.
For larger graphs (greater depths) this makes it hard to see the whole neighborhood.
Can we add mouse navigation to it? This would also need the "mouse wheel scroll blocking when focused".

Unsupported host error is not readable in dark-theme

The unsupported host error is not readable when in Jupyter Lab is in dark theme:
image001

Dark theme results in a white default text color which is not considered in the error message.

You can still read the message when you either select the content of the error or (temporarily) switch to light theme in Jupyter Lab.

New version not working

Describe the bug
I am unable to remove the old version and replace it after the licence message.

To Reproduce
I used pip uninstall yfiles_jupyter_graphs, followed by pip install yfiles_jupyter_graphs.

Expected behavior
Even after restarting the notebook kernel, the new version does not run.

Screenshots

The license of this widget has expired.

To update the license, please install the new free version of the widget from the [Python Package Index](https://pypi.org/).

In case this doesn't work for you, let us know on [GitHub](https://github.com/yWorks/yfiles-jupyter-graphs/issues).

Desktop (please complete the following information):

  • iOS
  • Chrome

Additional context
Add any other context about the problem here.

Render an image of the graph when I view my notebook in GitHub or export the notebook as PDF

First, this widget is great! Thanks.

I often share a static copy of my data analysis notebooks as either HTML or PDF. For example, I send people links to the notebook stored in GitHub which does a good job of rendering most content. However, the yFiles widget gets rendered as:

GraphWidget(layout=Layout(height='500px', width='100%'))

It would be very useful if the widget was rendered as an image. This would allow people to view the graph without setting up a notebook server.

Support Visual Studio Code as Notebook host

Describe the bug
The widget currently does not work in the Visual Studio Code environment.

To Reproduce
Steps to reproduce the behavior:

  1. Open a notebook in Visual Studio Code and enable Notebook editing
  2. Install the plugin
  3. Try to run any of the examples
  4. On Windows you won't see anything - the widget is simply missing. On Mac, you might see an image saying that only localhost and 127.0.0.1 are supported

Expected behavior
Ideally the widget would also work in Visual Studio Code which has superior code editing functionality.

Additional context
Unfortunately the Visual Studio Code environment is not perfectly compatible to JupyterLab or JupyterNotebook. Specifically custom widgets do not work out-of-the box and custom steps are necessary. It's not perfectly clear what these steps are and whether it is feasible in the case of this plugin.

Plea for help
If you can help us better understand how to properly implement this (and whether this is even feasible given the current VSC architecture), we'll be happy to add this useful feature.

Show how to load Neo4j Graph Data into the plugin

It should be easy to provide support for neo4j graphs. This should be documented or built right into the extension.

Loading neo4j graph data results is pretty trivial already, actually:

%pip install neo4j

from neo4j import GraphDatabase
uri      = "bolt://uritodatabase" 
user     = "username"          # your user name 
                              # default is always "neo4j" 
                              # unless you have changed it. 
password = "putyoursecretpassword-here"

driver = GraphDatabase.driver(uri=uri,auth=(user,password))
session = driver.session()

result = session.run("MATCH (s)-[r]->(t) RETURN s,r,t LIMIT 20")
g = result.graph()

from yfiles_jupyter_graphs import GraphWidget
w = GraphWidget()

w.nodes = list(map(lambda neoNode: ({"id": neoNode.id, "properties":{**dict(neoNode.items()), "label":list(neoNode.labels)[0]}}), g.nodes))
w.edges = list(map(lambda relationship: ({"id": relationship.id, "start": relationship.start_node.id, "end": relationship.end_node.id, "properties": {**dict(relationship.items()), "label": relationship.type}}), g.relationships))

w.show()

Feature request: Full screen visualization only

A lot of websites now use jupyter notebooks for documentation. Essentially the HTML is built based off jupyter notebook. To support having visualizations in those environments, I would like an option that gives me a non-interactive static fullscreen only graph visualization.

Showing too many instances can crash WebGL2 browser engine

Describe the bug
A notebook with many different widgets can cause the browser to give up and "disable webgl" and thus basically disabling the widget until reload.

To Reproduce
Steps to reproduce the behavior:

  1. Use a PC with a less powerful built-in GPU and outdated drivers.
  2. Open an example notebook with lots of graph cells.
  3. Expand/collapse the sidebar to invalidate the WebGL contexts
  4. See error in console:

image

Expected behavior
The code should take into account that a browser might give up due to exhausted resources.

Desktop (please complete the following information):

  • OS: Windows 1, Intel HD graphics on i5
  • Edge

Consider adding convenience "overloads" to the binding properties

Right now we have to write:

w.edge_label_mapping = lambda index,edge : edge.get('properties',{}).get('variable','no value')

It would be awesome if we could automatically accept functions that only accept one argument (only the item? only the index?) and if there was a way to simply specify the name of the property as a string to use for binding:

w.edge_label_mapping = 'variableName'
// would be effectively the same as
w.edge_label_mapping = lambda index,edge : edge.get('properties',{}).get('variableName','no value')

Tooltips aren't properly shown in Jupyter Notebooks

Describe the bug
In Jupyter Notebooks (not Labs), the tooltips on items cannot be seen. They seem to be only 2 pixels in size.

To Reproduce
Steps to reproduce the behavior:

  1. Open one of the examples in plain default Jupyter labs
  2. Hover over a node
  3. See that no tooltips are coming

Expected behavior
You should see the tooltip.

It is probably not visible due to some conflicting css classes from the notebook.

Only 127.0.0.1 and localhost supported :(

Describe the bug
Getting a message:
"The widget only permits use on 127.0.0.1 and localhost. In case this doesn't work for you, let us know on GitHub."
When running the widget on https://go.dominodatalab.com/
platform.
It is common for companies to use platforms like Domino or Databricks to do jupyter notebooking, where host might be different. Is there a particular reason for this restriction?
Thanks.

Screenshots
image

Desktop (please complete the following information):
NAME="Ubuntu"
VERSION="18.04.6 LTS (Bionic Beaver)"
MS Edge browser

Support more style mappings for nodes

Currently, there are only size and color mappings for the existing circular nodes.

This is quite limited. A style mapping with more options (e.g. shape, image, ... ?) would be really beneficial in some scenarios.

Recommend Projects

  • React photo React

    A declarative, efficient, and flexible JavaScript library for building user interfaces.

  • Vue.js photo Vue.js

    🖖 Vue.js is a progressive, incrementally-adoptable JavaScript framework for building UI on the web.

  • Typescript photo Typescript

    TypeScript is a superset of JavaScript that compiles to clean JavaScript output.

  • TensorFlow photo TensorFlow

    An Open Source Machine Learning Framework for Everyone

  • Django photo Django

    The Web framework for perfectionists with deadlines.

  • D3 photo D3

    Bring data to life with SVG, Canvas and HTML. 📊📈🎉

Recommend Topics

  • javascript

    JavaScript (JS) is a lightweight interpreted programming language with first-class functions.

  • web

    Some thing interesting about web. New door for the world.

  • server

    A server is a program made to process requests and deliver data to clients.

  • Machine learning

    Machine learning is a way of modeling and interpreting data that allows a piece of software to respond intelligently.

  • Game

    Some thing interesting about game, make everyone happy.

Recommend Org

  • Facebook photo Facebook

    We are working to build community through open source technology. NB: members must have two-factor auth.

  • Microsoft photo Microsoft

    Open source projects and samples from Microsoft.

  • Google photo Google

    Google ❤️ Open Source for everyone.

  • D3 photo D3

    Data-Driven Documents codes.