Giter Club home page Giter Club logo

upsetjs / upsetjs Goto Github PK

View Code? Open in Web Editor NEW
119.0 4.0 13.0 13.31 MB

๐Ÿ˜  UpSet.js - a set visualization library for rendering UpSet Plots (a JavaScript re-implementation of UpSet(R) by Lex et al), Euler Diagrams, Venn Diagrams, and Karnaugh Maps

Home Page: https://upset.js.org

License: Other

JavaScript 6.92% TypeScript 88.62% HTML 3.99% CSS 0.39% PowerShell 0.09%
upset upsetr javascript typescript react visualization d3js venn venn-diagram euler

upsetjs's People

Contributors

dependabot[bot] avatar sgratzl avatar

Stargazers

 avatar  avatar  avatar  avatar  avatar  avatar  avatar  avatar  avatar  avatar  avatar  avatar  avatar  avatar  avatar  avatar  avatar  avatar  avatar  avatar  avatar  avatar  avatar  avatar  avatar  avatar  avatar  avatar  avatar  avatar  avatar  avatar  avatar  avatar  avatar  avatar  avatar  avatar  avatar  avatar  avatar  avatar  avatar  avatar  avatar  avatar  avatar  avatar  avatar  avatar  avatar  avatar  avatar  avatar  avatar  avatar  avatar  avatar  avatar  avatar  avatar  avatar  avatar  avatar  avatar  avatar  avatar  avatar  avatar  avatar  avatar  avatar  avatar  avatar  avatar  avatar  avatar  avatar  avatar  avatar  avatar  avatar  avatar  avatar  avatar  avatar  avatar  avatar  avatar  avatar  avatar  avatar  avatar  avatar  avatar  avatar  avatar  avatar  avatar  avatar

Watchers

 avatar  avatar  avatar  avatar

upsetjs's Issues

support load dump from url

e.g. ?url=...

how to deal with cross origin?
maybe use a script tag but with type 'application/json' and then parse it manually once it is loaded?

support direct interaction overlay

It would be great if there is an option to overlay the plot with a direct interaction layer that allows changing order, min, max, layout width, layout height, theme?

User story

In builder use cases (such as PowerBI) instead of numerous options it would be useful to have a layer on top that allows direct interaction

Support for different set 'modes'

It appears that the default 'mode' of displaying set membership in upsetjs is 'intersect' this differs from the original UpSet implementation from lex et. al https://upset.app/ and the associated UpSetR implementation by Jake Conway. It would be very useful for some applications to be able to pick 'distinct' and 'union' modes as you can in @jokergoo's re-implementation of UpSet within ComplexHeatmap.

This terminology is explained nicely in the ComplexHeatmap manual:

image
from: https://jokergoo.github.io/ComplexHeatmap-reference/book/upset-plot.html#upset-mode


oops meant for this to go to the upsetsj_r repo not the monorepo and looks like you do support it there in the asCombination functions just missed in the docs as it didn't feature in any examples.

Render intersection set only

Hi, i was looking through the documentation and examples, and i didn't seem to find a way to just render only the intersection. Is there a way to render the upset chart without the horizontal set like the image below?
image

move dump logic from app to react

the model already contains the dump logic for dumping the model. So far complete dump is part of the app but could be moved to react in order to provide yet another export button next to vega

optional legends for Venn/Euler diagram

It would be great if there is a option to show legends instead of inline labels for venn/euler diagrams.

User story

In case of a small chart or an euler diagram with a small overlap, the labels are hard to read. One option might be to create a legend in case each item is associated with a unique color which moves the labels from within the chart to a side legend explaining the color and its values.

image

Additional context

UpsetJS in spotfire

I've used static upset plots and have been looking for more interactive functionality. I'm curious if anyone has tried to get upsetjs into spotfire, that way data tables of giant datasets can't be linked and multiple other visualizations can be added.

add vega theme

which uses steelblue by default and on a selection / hover, change the opacity of the not hovered one.

improve combination generation

currently the generation is straightforward. Thus computing A&B&C is done separately. It would be faster to compute A&B&C by (A&B)&(A&C) or (A&B)&(B&C) which limits the number of elements to check.

so a different strategy would be to

  1. generate all 2 set combinations (A&B, A&C, B&C)
  2. generate all 3 set combinations by combining two set combinations: A&B & A&C = A&B&C
    ...

support set diff: A and B \ C

It would be great if upsetjs supports set diffs such as pure overlaps: so (A and B) \ C to be similar to a venn diagram.

left align set labels

i've been a huge fan of UpSet since i saw the demo at IEEE Vis back in 2014 and it's great to have such a versatile version!

currently the labels for sets, classed setTextStyle-upset-*, are text-anchor: middle; and clipped. if the set names happen to not fit in the allotted space, they become unreadable because the front of the label is trimmed off. if these labels where left aligned i think the chart would be more usable with long labels.

if i manually trim the length of the set names then the hover text is also trimmed, so my users can't actually see the full name of the set.

if i hack the css:

[class*="setTextStyle-upset"] {
    text-anchor: start;
    transform: translate(-40px, 0px);
}

the clip box doesn't translate with the text and cut's the text off.

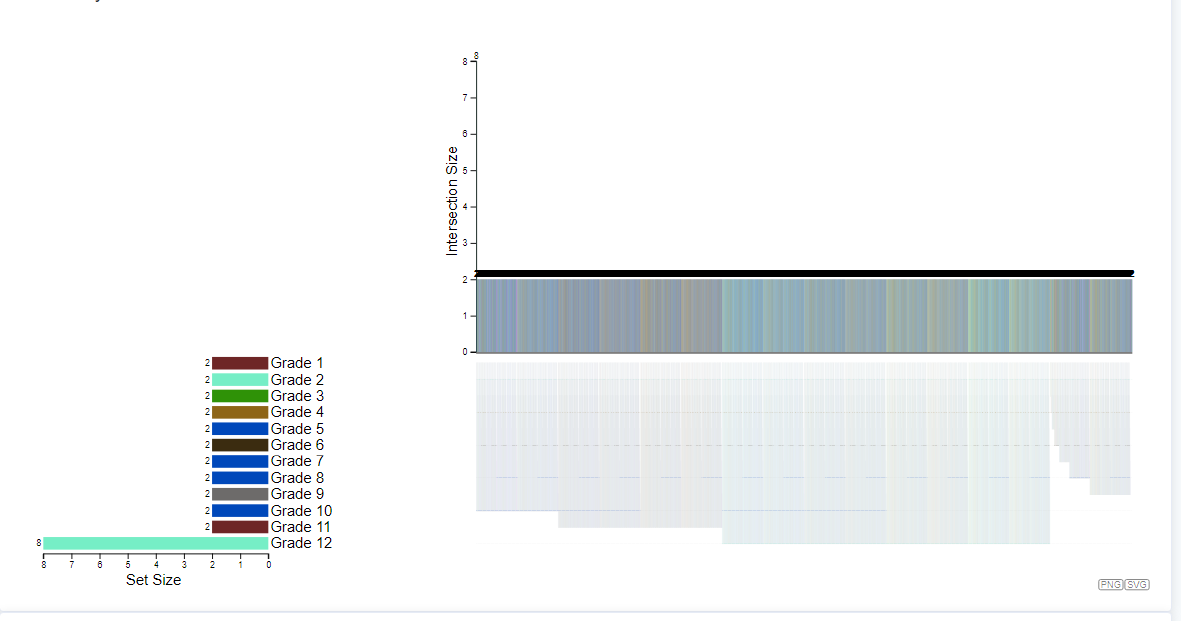
I have a very difficult problem

const elems = [
  { name: 'A', sets: ['S1', 'S2'] },
  { name: 'B', sets: ['S1'] },
  { name: 'C', sets: ['S2'] },
  { name: 'D', sets: ['S1', 'S3'] },
];

Hello, how do I only display B data containing S1 on upsetJS?

Should not import the named export 'version' (reexported as 'version') from default-exporting module (only default export is available soon)

When I use the Histogram import in react 18.0.0: import {Histogram} from '@upsetjs/plots'; for creating a Histogram, like the first example here, I get the following error:
ERROR in ./node_modules/vega/index.js 17:0-41
Should not import the named export 'version' (reexported as 'version') from default-exporting module (only default export is available soon)

However, the Histogram is created and when you close the error in the browser, the histogram works.

My solution

  • in ./node_modules/vega/index.js change export {version} from './package.json'; to export * as packageInfo from 'package.json'
  • in ./node_modules/vega/package.json change "version": "5.22.1", to "version": "packageInfo.version",
    After these two changes the Histogram works and no error is thrown.

Context

  • Version: react.js 18.0.0, upsetjs/plots: 1.11.0, upsetjs/react: 1.11.0
  • Browser: Firefox
  • OS : Windows 10

Shiny Click events

One feature that I want to add to my ShinyApp is to allow users to click the bar, and render a modal that shows them the elements of that intersection. Is this a possible feature to add?

Much appreciated it if this is possible!

-- Taotao

Allow specifying a CSP `nonce` to injected style tags

HTTP Content-Security-Policy (CSP) style-src directive specifies the valid sources for stylesheets. A common setting involves not including ยด'unsafe-inline'ยด to avoid certain XSS vectors.

Since UpSet.js components use injected style tags to customize the plots, they get blocked when a strict CSP directive is specified.
image
Note: The red lines are just manually redacted text in the screenshot

https://developer.mozilla.org/en-US/docs/Web/HTTP/Headers/Content-Security-Policy/style-src#unsafe_inline_styles
The injected style tags are dynamic, so it's impossible to specify a whitelisted content hash for them.

A solution for this issue would be using the arbitrary nonce whitelisting, where the server will generate a random string and UpSet.js components would receive those via props and append add them to the injected style tags.

option to force scales of bar charts on left and top to the same sizes

currently the scale on the left bar chart is not the same as the scale on the top. in cases where these bar charts show the same unit, it would be great to be able to coordinate these scales such that a bar of some size on the left has the same numeric value for a bar of the same size on the top.

this has been confusing for my users and specifically caused key insights to be overlooked.

one simple implementation would be to set the height, in pixels, of the top bar chart to be the width, in pixels, of the left bar chart. however this risks rather a lot of wasted white space if these two scales are significantly different. a more sophisticated approach would be to compute the .domains() of these two scales, and the .range() of the scale on the left in the same way you are currently, but set the .range() on the top scales such that equal values show up as the same size on both charts.

please forgive me if an option like this already exists. i've not been able to find an exhaustive list of options anywhere in the doc, and currently hunt through the story book for options. if that list is somewhere, even if it is in code, i'd love to see it.

thank you! :)

Recommend Projects

  • React photo React

    A declarative, efficient, and flexible JavaScript library for building user interfaces.

  • Vue.js photo Vue.js

    ๐Ÿ–– Vue.js is a progressive, incrementally-adoptable JavaScript framework for building UI on the web.

  • Typescript photo Typescript

    TypeScript is a superset of JavaScript that compiles to clean JavaScript output.

  • TensorFlow photo TensorFlow

    An Open Source Machine Learning Framework for Everyone

  • Django photo Django

    The Web framework for perfectionists with deadlines.

  • D3 photo D3

    Bring data to life with SVG, Canvas and HTML. ๐Ÿ“Š๐Ÿ“ˆ๐ŸŽ‰

Recommend Topics

  • javascript

    JavaScript (JS) is a lightweight interpreted programming language with first-class functions.

  • web

    Some thing interesting about web. New door for the world.

  • server

    A server is a program made to process requests and deliver data to clients.

  • Machine learning

    Machine learning is a way of modeling and interpreting data that allows a piece of software to respond intelligently.

  • Game

    Some thing interesting about game, make everyone happy.

Recommend Org

  • Facebook photo Facebook

    We are working to build community through open source technology. NB: members must have two-factor auth.

  • Microsoft photo Microsoft

    Open source projects and samples from Microsoft.

  • Google photo Google

    Google โค๏ธ Open Source for everyone.

  • D3 photo D3

    Data-Driven Documents codes.