Giter Club home page Giter Club logo

vscode-interactive-graphviz's Introduction

get in touch with Consensys Diligence
[ 🌐 📩 🔥 ]

Version Installs Ratings

Graphviz Interactive Preview (Visual Studio Code Extension)

A VSCode extension that provides syntax highlighting, snippets, and an interactive, zoom-, pan- and searchable, live preview with edge tracing for graphs in Graphviz / dot format.

graphviz_v01

Language Features

  • Graphviz/Dot Language Support / Syntax Highlighting and Snippets (thanks @joaompinto)
  • AutoCompletion
  • Rename Symbols
  • Find References of node IDs
  • Color selection via Color decoration
  • Hover information for settings
  • Shows syntax errors (only available when the preview of the document is active)

image

image

image

Interactivity Features

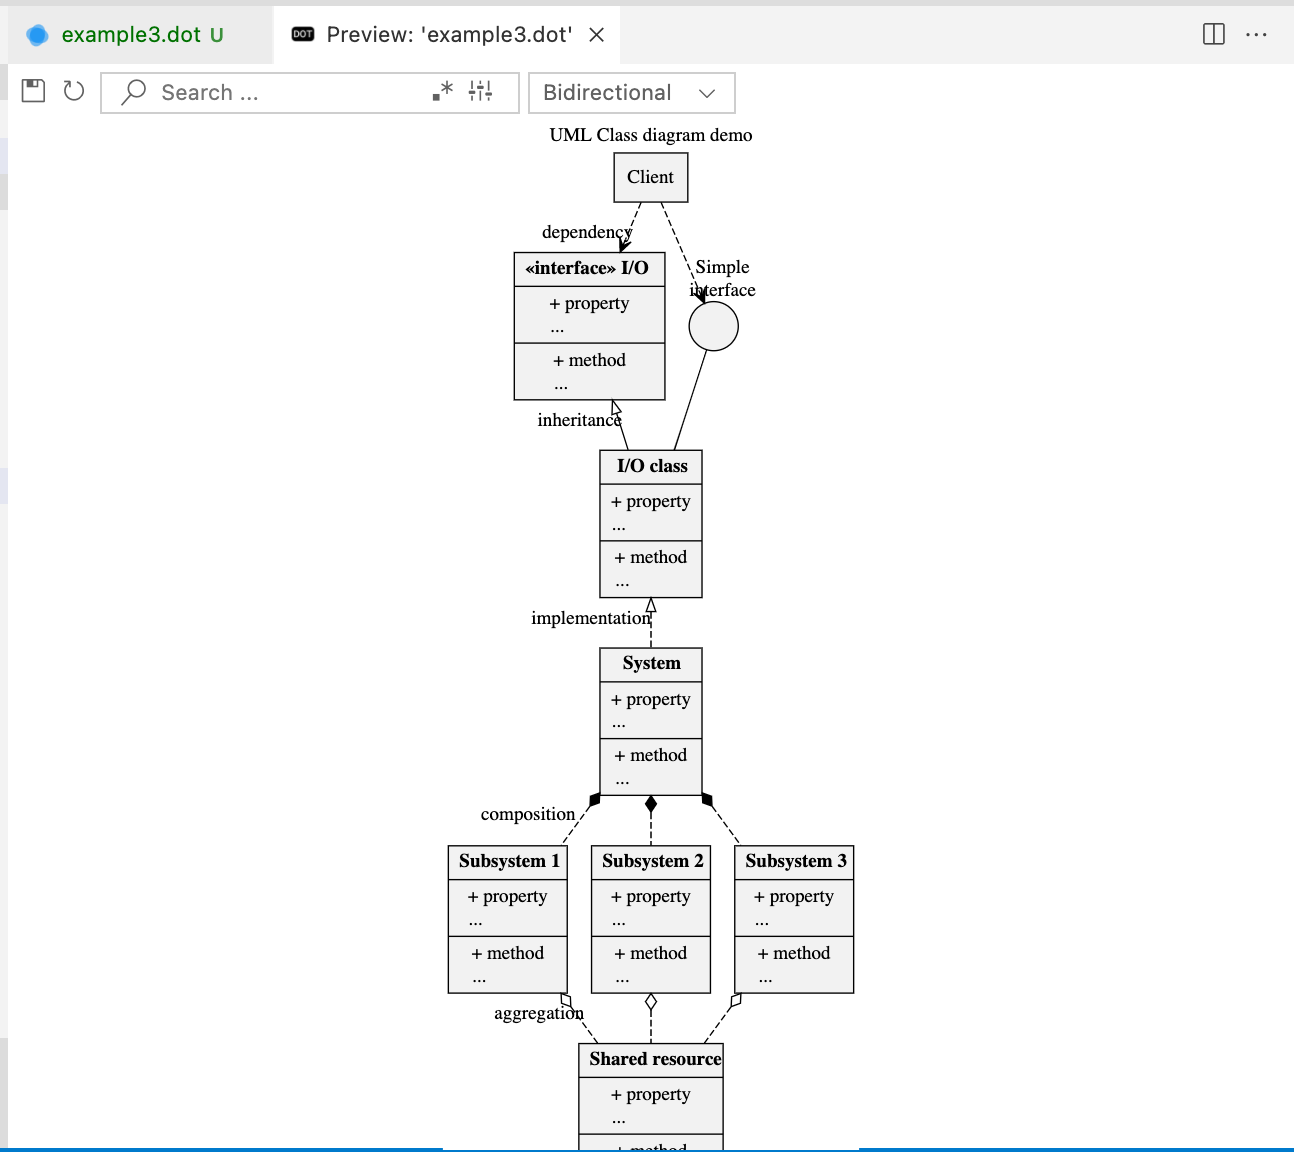
  • Renders dot/Graphviz sources in an interactive live preview.
  • Updates preview as you type.
  • Search for nodes in the graph.
  • Export the graph as svg or dot.
  • Interactive edge tracing. Click on a node to highlight incoming and outgoing edges (ESC to unselect). The Direction of the highlighting can be changed (options: single, upstream, downstream, bidirectional)
  • Configurable render engine, render options & tracing preference: e.g. transitionDelay, transitionDuration.

graphviz_v01_open image

Other features

  • Available on github.dev, vscode.dev
  • Developers: you can pass a callback function that receives the webPanel when executing the preview command. This allows you to override functionality that is provided by the webPanel, like handlers for click/dblClick events.

How to preview

Open a Graphviz/Dot file in the active editor and use either of the following methods to render the preview:

  • (a) open the command prompt (cmd+shift+p) and type > graphviz preview
  • (b) click the image button in the editor title
  • (c) from the editor window's context menu, select Preview Graphviz / Dot (beside)

image

image

Render Examples

semantic-arg-dark semantic-arg-dark semantic-arg-dark semantic-arg-dark

Developer Notes

Note:❗v0.0.8 introduced a breaking change: the render command was renamed from interactive-graphviz.preview.beside to graphviz-interactive-preview.preview.beside

The extension can be set run on development machines with

npm run watch

In order to test the extension as a web extension you have to start

npm run open-in-browser

Interact with this extension

  • add graphviz-interactive-preview to your package.json extension dependencies.
{
    "name": "your-extension",
    "extensionDependencies": ["tintinweb.graphviz-interactive-preview"],
}
  • Create one or multiple new panels displaying the rendered dot graph. Provide the document or uri object reference of the source code you want to render. Alternatively, you can also provide a document or uri reference of a virtual document and provide the graphviz dot source with the content field. In this case the extension will render the content and use the virtual document to extract the path information. The callback function receives the newly created webPanel. Overload webPanel.handleMessage((message) from your callback function to receive message events like onClick and onDblClick emitted from inside the dot render window.
let options = {
    document: <vscode.document>,
    uri: <vscode.uri>,
    content: <string: dotSrc>,
    callback: <function(webpanel){}>,
    allowMultiplePanels: <bool: false|[true]>,
    title: <string: RenderWindowTitle>,
    search: <optional string: Search | object: searchOptions>
}
            
vscode.commands.executeCommand("graphviz-interactive-preview.preview.beside", options)

Please do not hesitate to reach out if you are missing specific functionality.

Maintainers

see AUTHORS for a list contributors.

Credits

Copyright (c) Microsoft Corporation:

Release Notes

see CHANGELOG


vscode-interactive-graphviz's People

Contributors

bigbug avatar justinchuby avatar kaftejiman avatar michkot avatar tintinweb avatar

Stargazers

 avatar  avatar  avatar  avatar  avatar  avatar  avatar  avatar  avatar  avatar  avatar  avatar  avatar  avatar  avatar  avatar  avatar  avatar  avatar  avatar  avatar  avatar  avatar  avatar  avatar  avatar  avatar  avatar  avatar  avatar  avatar  avatar  avatar  avatar  avatar  avatar  avatar  avatar  avatar  avatar  avatar  avatar  avatar  avatar  avatar  avatar  avatar  avatar  avatar  avatar  avatar  avatar  avatar  avatar  avatar  avatar  avatar  avatar  avatar  avatar  avatar  avatar  avatar  avatar  avatar  avatar  avatar  avatar  avatar  avatar  avatar  avatar  avatar  avatar  avatar  avatar  avatar  avatar  avatar  avatar  avatar  avatar  avatar  avatar  avatar  avatar  avatar  avatar  avatar  avatar  avatar  avatar  avatar  avatar  avatar  avatar  avatar  avatar  avatar  avatar

Watchers

 avatar  avatar  avatar  avatar  avatar  avatar

vscode-interactive-graphviz's Issues

Feature Request: zoom to fit

I love that we can zoom in and out and pan around, and that the zoom scales with the window size. However, after adjusting the zoom and panning I cannot figure out how to reset the view to its original behavior of fitting the window width perfectly.

Would love a keyboard shortcut, command, button, context menu...some way to reset zoom.

Adopt VS Code's 'asWebviewUri' API

Hi, I maintain VS Code's Webview API

Issue

Our telemetry suggests that your extension uses webviews and may be loading resources in these webviews using hardcoded vscode-resource: URIs. These URIs have some important limitations and don't work properly when VS Code is run in a browser. We are also making changes in the desktop version of VS Code that may cause these URIs to not work properly in future versions of VS Code.

While we are making our best effort to continue support existing webview extensions that use vscode-resource: URIs on desktop versions of VS Code, we will not able to fully support all uses cases.

Fix

To ensure that your extension continues to work in as many environments as possible—including on web and remotely—please:

These APIs shipped around 2 years ago so they should be available in all modern versions of VS Code. You can find additional information about the issue here: microsoft/vscode#97962

Let me know if you have any questions about this change

Theme colors

Use the theme's colors as default color for the GV rendering

Allow highlighting only upstream or downstream dependencies in a DAG

I love the feature where I can select a node and see all the connected nodes. It would be great to have a toggle for highlighting only upstream or downstream dependencies in a DAG. This will help working with big graphs when one wants to understand which nodes contribute to a node.

Add scroll bars

Now scrolling the mouse will zoom in and out, which is very inconvenient. Horizontal and vertical scroll bars should be added.

Allow case insensitive matching in search

Regex search seems to be matching strings in the case sensitive mode. It would be convenient to default to case insensitive matching, much like the VS Code default.

Node images not showing in preview

With a test.dot file like:

digraph D { a [shape="none" label="Node a"; image="actor.png"]; b; a->b; }

and assuming actor.png is on the same folder as the dot file, the preview doesn't include an image object in the generated svg. Verified this by opening preview in the default browser. However, running this in the command line:

dot -Tsvg test.dot

makes graphviz to include the image when generating output, proving that graphviz does generate images for the node. Could I be missing an attribute, configuration or something?

Web Extension not working in Safari

The extension leads to errors in Safari. The Graphviz View can not be rendered and we get an infinite progress bar.

Console shows errors related to malformed Content-Security-Policy:

Screenshot 2022-02-15 at 20 29 59

Support For All GraphViz Renderers

In version 0.1.2, graphs appear to be rendered using the dot GraphViz renderer equivalent, with no option to switch to the other renderers supported by d3-graphviz, such as neato, fdp etc. Since all of the standard GraphViz renderers are supported by both d3-graphviz and hpcc-js-wasm, it seems like using any of the renderers should be relatively easy.

Suggest that support for other render types be added to the vscode extension if possible.

Rerendering of a graph hides the search results

If a given graph is already rendered and you try to search for a node, the search toolbar appears.
If you change the source of this graph, then it is rendered immediately in the preview window, however the search toolbar gets hidden.

Refactor code

The code in the index.html got very big. It should be split up and reorganised.

Rewrite content-folder with typescript

The content folder currently uses javascript files and distributed files. This has to be changed so that typescript is used and that it gets bundled.

how to enable preview?

Hi,

I just installed this but what should I do to enable the preview?
I tried the cmd + v and cmd + k + v and cmd + shift + v, none seem to work and it seems to render the dot file as plain text.

Am I mis-configuring the IDE (I'm new to VS Code)?

Thanks!
Steve

Screen Shot 2021-06-29 at 11 09 53 AM

[Bug] No preview auto-refresh while typing

The preview window doesn't automatically refresh when I start typing in the code editor. Even if I save the file at the end.

My setup is:

  • Windows 10 Professional x64
  • Visual Studio Code 1.42.0

Clickable nodes

On nodes only the actual rendered lines are clickable. The rest is not clickable. In the following example only the ellipsis line and the label are clickable. The white space within the ellipsis is not clickable - but I think it should be.

digraph { a -> b a-> c }

The marked red area is currently not clickable (same applies to node b and c):
Screenshot 2022-01-15 at 14 50 42

Maybe related to #21?

Subgraphs

Recognize subgraphs as symbols for the outline view

Visual editor

What do you guys think about offering an additional visual editor? This is meant in a way that the underlying DOT code is completely abstracted away from the user? In the background the DOT code could be generated and sent to our rendering engine.

Sensitivity to spaces

Dot format is sensitive to spaces. Quote from https://graphviz.org/doc/info/shapes.html#html

As is obvious from the above description, the interpretation of white space characters is one place where HTML-like labels is very different from standard HTML. In HTML, any sequence of white space characters is collapsed to a single space, If the user does not want this to happen, the input must use non-breaking spaces  . This makes sense in HTML, where text layout depends dynamically on the space available. In Graphviz, the layout is statically determined by the input, so it is reasonable to treat ordinary space characters as non-breaking. In addition, ignoring tabs and newlines allows the input text to be formatted for easier reading.

ERD diagram in DOT format
digraph {
  ranksep=1.0; rankdir=LR;
  node [shape = none, fontname="Roboto Mono"];
  "Blog.Comment" [label= <<table align='left' border='1' style='rounded' cellspacing='0' cellpadding='4' cellborder='0'><tr><td port='header@schema_module'><font point-size='18'>   Blog.Comment   </font></td></tr><tr><td border='1' sides='b' colspan='2'><font point-size='14'><i>comments</i></font></td></tr><tr><td align='left' port='field@id'>:id              <i><font color='gray54'>:id                 </font></i></td></tr><tr><td align='left' port='field@text'>:text            <i><font color='gray54'>:string             </font></i></td></tr><tr><td align='left' port='field@inserted_at'>:inserted_at     <i><font color='gray54'>:naive_datetime     </font></i></td></tr><tr><td align='left' port='field@updated_at'>:updated_at      <i><font color='gray54'>:naive_datetime     </font></i></td></tr><tr><td align='left' port='field@post_id'>:post_id         <i><font color='gray54'>:id                 </font></i></td></tr><tr><td align='left' port='field@user_id'>:user_id         <i><font color='gray54'>:id                 </font></i></td></tr></table>>]
  "Blog.Post" [label= <<table align='left' border='1' style='rounded' cellspacing='0' cellpadding='4' cellborder='0'><tr><td port='header@schema_module'><font point-size='18'>   Blog.Post   </font></td></tr><tr><td border='1' sides='b' colspan='2'><font point-size='14'><i>posts</i></font></td></tr><tr><td align='left' port='field@id'>:id              <i><font color='gray54'>:id                 </font></i></td></tr><tr><td align='left' port='field@title'>:title           <i><font color='gray54'>:string             </font></i></td></tr><tr><td align='left' port='field@text'>:text            <i><font color='gray54'>:string             </font></i></td></tr><tr><td align='left' port='field@inserted_at'>:inserted_at     <i><font color='gray54'>:naive_datetime     </font></i></td></tr><tr><td align='left' port='field@updated_at'>:updated_at      <i><font color='gray54'>:naive_datetime     </font></i></td></tr><tr><td align='left' port='field@user_id'>:user_id         <i><font color='gray54'>:id                 </font></i></td></tr></table>>]
  "Blog.User" [label= <<table align='left' border='1' style='rounded' cellspacing='0' cellpadding='4' cellborder='0'><tr><td port='header@schema_module'><font point-size='18'>   Blog.User   </font></td></tr><tr><td border='1' sides='b' colspan='2'><font point-size='14'><i>users</i></font></td></tr><tr><td align='left' port='field@id'>:id        <i><font color='gray54'>:id         </font></i></td></tr><tr><td align='left' port='field@email'>:email     <i><font color='gray54'>:string     </font></i></td></tr></table>>]

  "Blog.Post":"field@id":e -> "Blog.Comment":"field@post_id":w
  "Blog.User":"field@id":e -> "Blog.Comment":"field@user_id":w
  "Blog.User":"field@id":e -> "Blog.Post":"field@user_id":w
}

This is how it looks if rendered with dot utility:
зображення

And this is a screenshot from VS code:
зображення

Disable transition animation

For large files the transition animation seems to lead to a higher computation time.
During experiments it was seen, that an initial rendering of the file took 15 seconds. Subsequent renders of the same file (with small changes on only one node) then took about 45 seconds. It was seen that removing

graphviz
  .fade(true)
  .transition(transition)
  .tweenPaths(true) // default
  .tweenShapes(true) // default

from the code lead to significant better render times.
The removal of this code could possibly reduce the render times. Maybe already lowering transition is sufficient. A mechanism could be implemented strip away the transition if the underlying DOT render of the previous DOT source took over 15?? seconds.

Add official license file

In some files of the extension the MIT License is mentioned. It would be good to have a License file in the root folder of the repo.

Use a bright color for highlighting search results

The current highlight color for node search results is a light blue color. It is hard to notice when the node itself is colored. It would be nice to adapt the color to make the highlight more obvious, or use a brighter color by default (yellow?)

Restyle toolbars to use theme color

The toolbars for the number of search results and the error shall be restyled so that they use VS Code's theme Colors and so that they fit better into the visual appearance.

Base could be:

        .toolbar-danger {
            background-color: var(--vscode-inputValidation-errorBackground);
            border-color: var(--vscode-inputValidation-errorBorder);
            border-style: solid;
            font-size: .9em;
            margin-left: 5px;
            margin-right: 5px;
            margin-top: 3px;
            margin-bottom: 3px;
            padding: 5px;
            border-width: 1px;
        }

Allow fuzzy match in search

Searching only matches full strings at the moment. For working with very big graphs, it helps to allow fuzzy match or prefix match in the search feature.

How do I get the preview to render in dark mode?

In the screenshots, you show the graph rendering with a dark theme. I use a dark theme, and just created a simple dot file. In the preview though, the graph is shown as black outlines on a white background. What do I need to do to show the preview in dark mode?

Make subgraphs searchable

The new search system currently supports nodes and edges. Subgraphs are still missing. They should be added.

Example:

digraph {
    subgraph cluster_1 {
		node [style=filled];
		b0 -> b1 -> b2 -> b3;
		label = "process";
		color=blue
	}
    a -> b
    a -> b

    a -> c

    b1 -> d
    d -> b
    e -> d
    b -> f
}

Feature request: copy to clipboard

Instead of screenshotting and manually selecting the graph, it would make it easier to perform quick one-off shares (e.g. pasting in Slack) if there was a button or option to copy the current image to the clipboard.

Even better if there's a setting that allows the image placed on the clipboard to be a larger resolution than what's shown on screen.

[Bug] Interactive graph is not showing

When I generate a preview of my current .dot file, I do not obtain an interactive graph like this one:

image

Instead, I obtain a static graph.

My setup is:

  • Windows 10 Professional x64
  • Visual Studio Code 1.42.0

Preview callback webpanel.handleMessage's message.value.node is always "this"

Hi, thanks for the awesome extension. Sorry for the cryptic title.

I am developing an extension that generates a DOT file and previews it using your extension. I want to catch 'onClick' events on nodes to capture the clicked node ID.

I have the following code that correctly hooks to 'onClick' events.

preview(fullname: string, content: string) {
  let callback = (webpanel: any) => this.interactivePreviewWebpanelCallback(webpanel);
  vscode.workspace.openTextDocument(fullname).then( (document) => {
      let args = { document, content, callback };
      vscode.commands.executeCommand("graphviz-interactive-preview.preview.beside", args);
  });
}

interactivePreviewWebpanelCallback(webpanel: any) {
  let handler = (message: any) => { return this.interactivePreviewMessageHandler(message); }
  webpanel.handleMessage = handler;
}

interactivePreviewMessageHandler(message: any) {
  console.log(JSON.stringify(message));

  switch(message.command){
      case 'onClick':
          console.log("onClick");
          break;
      case 'onDblClick':
          console.log("onDblClick");
          break;
      default:
          console.warn('Unexpected command: ' + message.command);
  }
}

However, when I try to get the clicked node ID from message.value.node, it is always "this":

{"command":"onClick","value":{"node":"this"}}

Do you have any clues?

Thanks,

Jonathan

Recommend Projects

  • React photo React

    A declarative, efficient, and flexible JavaScript library for building user interfaces.

  • Vue.js photo Vue.js

    🖖 Vue.js is a progressive, incrementally-adoptable JavaScript framework for building UI on the web.

  • Typescript photo Typescript

    TypeScript is a superset of JavaScript that compiles to clean JavaScript output.

  • TensorFlow photo TensorFlow

    An Open Source Machine Learning Framework for Everyone

  • Django photo Django

    The Web framework for perfectionists with deadlines.

  • D3 photo D3

    Bring data to life with SVG, Canvas and HTML. 📊📈🎉

Recommend Topics

  • javascript

    JavaScript (JS) is a lightweight interpreted programming language with first-class functions.

  • web

    Some thing interesting about web. New door for the world.

  • server

    A server is a program made to process requests and deliver data to clients.

  • Machine learning

    Machine learning is a way of modeling and interpreting data that allows a piece of software to respond intelligently.

  • Game

    Some thing interesting about game, make everyone happy.

Recommend Org

  • Facebook photo Facebook

    We are working to build community through open source technology. NB: members must have two-factor auth.

  • Microsoft photo Microsoft

    Open source projects and samples from Microsoft.

  • Google photo Google

    Google ❤️ Open Source for everyone.

  • D3 photo D3

    Data-Driven Documents codes.