scikit-tda / persim Goto Github PK
View Code? Open in Web Editor NEWDistances and representations of persistence diagrams
Home Page: https://persim.scikit-tda.org
License: MIT License
Distances and representations of persistence diagrams
Home Page: https://persim.scikit-tda.org
License: MIT License
I'm using Python 3.8 and I have these:
$ pip3.8 list -u
Package         Version
--------------- -------
cycler          0.10.0
Cython          0.29.14
hopcroftkarp    1.2.5
Jinja2          2.11.1
joblib          0.14.1
kiwisolver      1.1.0
kmapper         1.2.0
llvmlite        0.31.0
MarkupSafe      1.1.1
matplotlib      3.1.3
numba           0.48.0
numpy           1.18.1
persim          0.1.2
Pillow          7.0.0
pip             20.0.2
pyparsing       2.4.6
python-dateutil 2.8.1
ripser          0.4.1
scikit-learn    0.22.1
scikit-tda      0.0.3
scipy           1.4.1
six             1.14.0
tadasets        0.0.4
umap-learn      0.3.10
The code below from http://persim.scikit-tda.org/notebooks/distances.html
import numpy as np
import persim
import persim.plot
import tadasets
import ripser
import matplotlib.pyplot as plt
gives the error
ModuleNotFoundError: No module named 'persim.plot'
Removing the import persim.plot the error
AttributeError: module 'ripser' has no attribute 'plot_dgms'
appears when calling ripser.plot_dgms().
Any idea how to solve it? Maybe documentation is outdated?
Code
import numpy as np
import persim
#import persim.plot
import tadasets
import ripser
import matplotlib.pyplot as plt

data_clean = tadasets.dsphere(d=1, n=100, noise=0.0)
data_noisy = tadasets.dsphere(d=1, n=100, noise=0.1)

plt.scatter(data_clean[:,0], data_clean[:,1], label="clean data")
plt.scatter(data_noisy[:,0], data_noisy[:,1], label="noisy data")
plt.axis('equal')
plt.legend()
plt.show()

dgm_clean = ripser.ripser(data_clean)['dgms'][1]
dgm_noisy = ripser.ripser(data_noisy)['dgms'][1]

ripser.plot_dgms([dgm_clean, dgm_noisy] , labels=['Clean $H_1$', 'Noisy $H_1$'])
Hi scikit-tda developers!
I am a PhD student from the Combinatorial Image Analysis research group (University of Seville) and I was wondering if we could add persistent entropy, which is a topological data analysis tool with information theory inspiration, to the Scikit-tda library. It has been used in several papers such as [1], [2] or [3], among others.
[1] Atienza, N., González-Díaz, R., & Rucco, M. (2017). Persistent entropy for separating topological features from noise in vietoris-rips complexes. Journal of Intelligent Information Systems, 1-19.
[2] Atienza, N., González-Díaz, R., & Soriano-Trigueros, M. (2018). A new entropy based summary function for topological data analysis. Electronic Notes in Discrete Mathematics, 68: 113-118.
[3] Rucco, M., González-Díaz, R., Jimenez, M.J., Atienza, N., Cristalli, C., Concettoni, E., Ferrante,A., & Merelli, A. (2017)A new topological entropy-based approach for measuring similarities among piecewise linear functions. Signal Processing, 130-138.
Greetings
Right now, the value at each pixel is computed by taking the distance from center of the pixel. We need to instead integrate over the entire pixel.
Could you add a GitHub release for v0.1.2? This will make it easier to keep the aur repository up to date
A barcode is a graphical representation as a collection of horizontal line
segments in a plane whose horizontal axis corresponds to the parameter and whose
vertical axis represents an (arbitrary) ordering of homology generators. [1]
I'd be happy to contribute my implementation.
I'm getting the following traceback, I think there was a change in the standard library https://docs.python.org/3/library/collections.abc.html
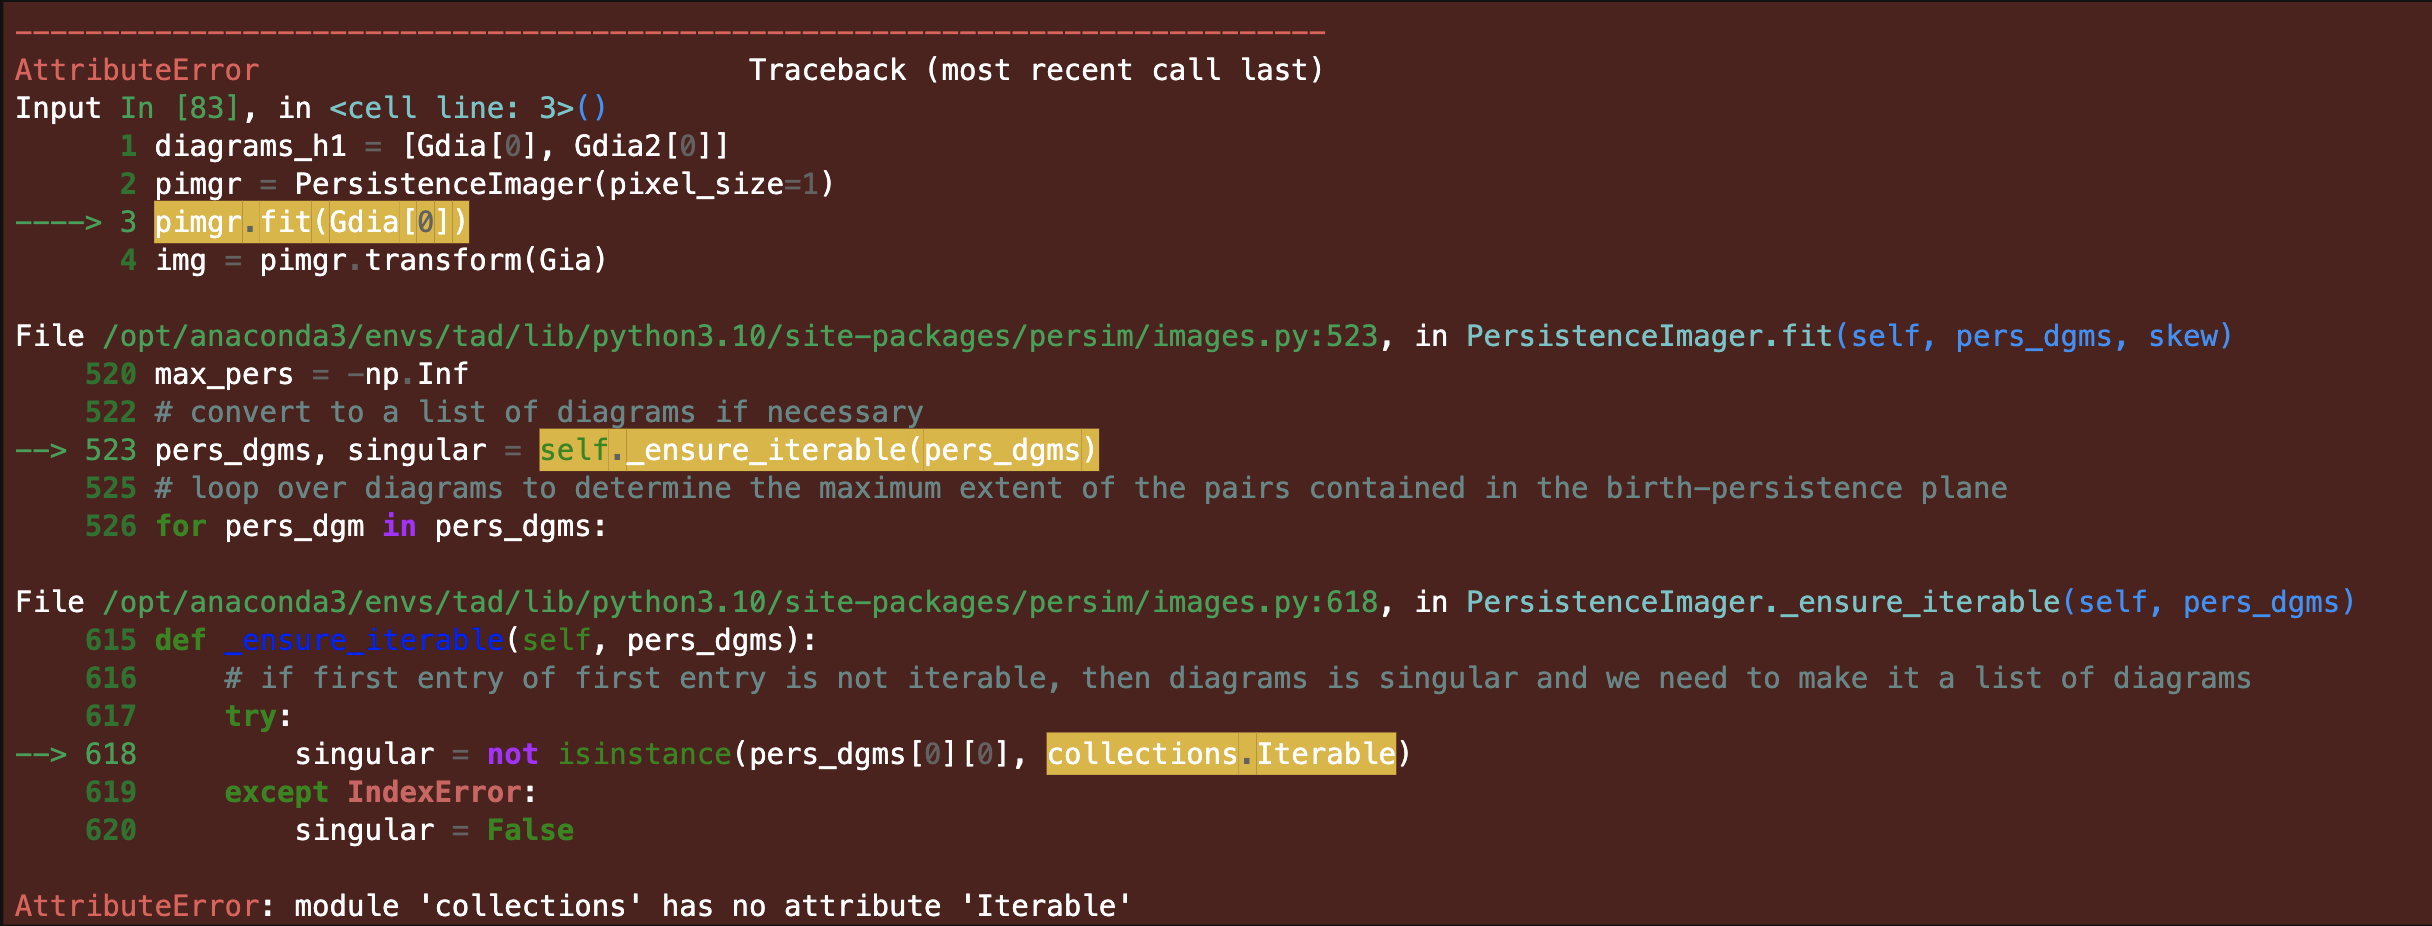
necessitating a small change to the source code on line 618
I am using py 3.10
Thanks
I have an issue producing Persistent Images using Prism in Python.
I'm generating Persistent Diagrams using Dionysus software in python. My problem is I can not generate persistent images from dionysus out. I have converted the output into a NumPy array but still give me a 'TypeError'. Below is my code and the error message:
import dionysus as d
import numpy as np
from sklearn.preprocessing import normalize
import matplotlib.pyplot as plt
from persim import PersImage
Image = plt.imread("8.png")
normed_matrix = normalize(Image, axis=1, norm='l1')
f_lower_star = d.fill_freudenthal(normed_matrix)
p = d.homology_persistence(f_lower_star)
dgms = d.init_diagrams(p, f_lower_star)
#### I do not have an issue until that point , it is the Persistent Image step that gives me error !
pim = PersImage(pixels=[20,20],spread=1,verbose=False )
img = pim.transform(dgms[1])
TypeError Traceback (most recent call last)
in
----> 1 img = pim.transform(dgms)
~/anaconda3/lib/python3.7/site-packages/persim/images.py in transform(self, diagrams)
92 diagrams = [diagrams]
93
---> 94 dgs = [np.copy(diagram, np.float64) for diagram in diagrams]
95 landscapes = [PersImage.to_landscape(dg) for dg in dgs]
96
~/anaconda3/lib/python3.7/site-packages/persim/images.py in (.0)
92 diagrams = [diagrams]
93
---> 94 dgs = [np.copy(diagram, np.float64) for diagram in diagrams]
95 landscapes = [PersImage.to_landscape(dg) for dg in dgs]
96
<array_function internals> in copy(*args, **kwargs)
~/anaconda3/lib/python3.7/site-packages/numpy/lib/function_base.py in copy(a, order, subok)
790
791 """
--> 792 return array(a, order=order, subok=subok, copy=True)
793
794 # Basic operations
I have later converted the dionysus output into a python list, and a numpy array using the following:
l = [(pt.birth, pt.death) for pt in dgms[1]]
f=np.asarray(l)
but I still get the same error !!!!
Any help will be appreciated.
Many Thanks
Aras
The 'persistence' weight function in PersistenceImager is the one defined here https://jmlr.org/papers/volume18/16-337/16-337.pdf (page 9) that is linear on persistence coordinate and goes from 0 if persistence coordinate is 0 to 1 if persistence coordinate is the maximum?
I have obtained negative values in a persistent image (they were very close to 0). How is that possible? I have used Gaussian kernel and 'persistence' weight function, so the values in a persistence image are sums of the product of nonnegative functions.
Full build log seen here, this is a superset of the failures reported for =perism-0.2.0.
I think your job is very meaningful and exciting!But I am a little confused about the description of Sliced Wasserstein distance.
"The general idea is to compute an approximation of the Wasserstein distance by computing the distance in 1-dimension repeatedly and use the results as a measure. "
Does this mean that Sliced Wasserstein distance is faster than Wasserstein in terms of time complexity?
If not, what is the difference between these two distances in this library?
Thank you for your attention!
Looking forward to your reply!
I'm having an issue with the bottleneck distance function, haven't dug into the code to figure out what's up but hoping that someone can hunt it down.
First issue: passing an empty diagram (in the form of an empty array) just throws an error.
Second issue: I seem to have created multiple instances of diagrams whose distance to themselves are non-zero:
dgmA = np.array([[0.11371516, 4.45734882]])
bottleneck(dgmA,dgmA)
returns 2.17181683. First guess is that this is caused by diagrams with a single point but can't be sure.
In the Nixkgs collection we see test failures on the build system with Python 3.10 and Python 3.11.
Executing pytestCheckPhase
============================= test session starts ==============================
platform linux -- Python 3.10.9, pytest-7.2.0, pluggy-1.0.0
rootdir: /build/persim-0.3.1
collected 104 items / 12 deselected / 92 selected

test/test_distances.py ..............................                    [ 32%]
test/test_landscapes.py ...........................F                     [ 63%]
[...]

=================================== FAILURES ===================================
____________________ TestTransformer.test_persistenceimager ____________________

self = <test_landscapes.TestTransformer object at 0x7fff83f6ec50>

    def test_persistenceimager(self):
        pl = PersistenceLandscaper(hom_deg=0, num_steps=5, flatten=True)
        assert pl.hom_deg == 0
        assert not pl.start
        assert not pl.stop
        assert pl.num_steps == 5
        assert pl.flatten
        dgms = [np.array([[0, 3], [1, 4]]), np.array([[1, 4]])]
        pl.fit(dgms)
        assert pl.start == 0
        assert pl.stop == 4.0
        np.testing.assert_array_equal(
            pl.transform(dgms),
            np.array([0.0, 1.0, 1.0, 1.0, 0.0, 0.0, 0.0, 1.0, 0.0, 0.0,]),
        )
        pl2 = PersistenceLandscaper(hom_deg=1, num_steps=4)
        assert pl2.hom_deg == 1
        pl2.fit(dgms)
        assert pl2.start == 1.0
        assert pl2.stop == 4.0
        np.testing.assert_array_equal(pl2.transform(dgms), [[0.0, 1.0, 1.0, 0.0]])
        pl3 = PersistenceLandscaper(hom_deg=0, num_steps=5, flatten=True)
        np.testing.assert_array_equal(
>           pl3.fit_transform(dgms),
            np.array([0.0, 1.0, 1.0, 1.0, 0.0, 0.0, 0.0, 1.0, 0.0, 0.0,]),
        )

test/test_landscapes.py:532:
_ _ _ _ _ _ _ _ _ _ _ _ _ _ _ _ _ _ _ _ _ _ _ _ _ _ _ _ _ _ _ _ _ _ _ _ _ _ _ _
/nix/store/avaqkdjpx2w50dgyq9769fa3ghvr8cvx-python3.10-scikit-learn-1.2.1/lib/python3.10/site-packages/sklearn/utils/_set_output.py:142: in wrapped
    data_to_wrap = f(self, X, *args, **kwargs)
_ _ _ _ _ _ _ _ _ _ _ _ _ _ _ _ _ _ _ _ _ _ _ _ _ _ _ _ _ _ _ _ _ _ _ _ _ _ _ _

self = PersistenceLandscaper(hom_deg=0, start=0, stop=4, num_steps=5)
dgms = [array([[0, 3],
       [1, 4]]), array([[1, 4]])]

    def fit_transform(self, dgms):
        self.fit(dgms=dgms)
>       vals = self.transform(dgms=dgms)
E       TypeError: PersistenceLandscaper.transform() missing 1 required positional argument: 'X'

persim/landscapes/transformer.py:132: TypeError
=============================== warnings summary ===============================
../../nix/store/sgaywpksqi4iqq1b148hagzcbmwpwzbm-python3.10-joblib-1.2.0/lib/python3.10/site-packages/joblib/backports.py:22
  /nix/store/sgaywpksqi4iqq1b148hagzcbmwpwzbm-python3.10-joblib-1.2.0/lib/python3.10/site-packages/joblib/backports.py:22:
[...]
-- Docs: https://docs.pytest.org/en/stable/how-to/capture-warnings.html
=========================== short test summary info ============================
FAILED test/test_landscapes.py::TestTransformer::test_persistenceimager - TypeError: PersistenceLandscaper.transform() missing 1 required positional ...
=========== 1 failed, 91 passed, 12 deselected, 11 warnings in 3.24s ===========Hi,
I would like to use this notebook and it used to be visible but there seem to be an issue with it now.
Is it possible to fix it?
Thanks,
Renaud
What is the value of mean parameter used if we use a gaussian kernel ? The gaussian kernel corresponding to a point of the diagram is centered in that point of the diagram?
This is the full build log and the failing tests appear to be a superset of the test failures reported for =perism-0.1.3.
bottleneck function repeatedly outputs non-zero distance between identical persistence diagram inputs. For example:
data = np.random.random((5,2))
pd = rips.fit_transform(data)
d = bottleneck(pd[0], pd[0])
d
0.05305507779121399
Note, at first pass it seems like d gets smaller as the number of points in data increases?
During the calculation of landscapes, how is the number of layers/lambdas decided?
The existing CI test pipeline stops at Python 3.8, and versions prior to 3.6 are not even included in Github's docker images anymore.
This issue is to bring the CI pipeline up to date to 3.12, which will facilitate the work in this milestone.
This issue blocks the other issues in that milestone.
If one passes a persistence diagram with infinite death times to any of these functions, they will return NaN. We should warn the user about this, and/or come up with a default option for dealing with infinite death times (e.g. making the infinite death times equal to the diameter of the point set or maximum non-infinite death time, or some specified value)
I want to generate a persistent image for H0,but the value in persimage always is nan.This makes me confuse.Can you give an example?
thanks!
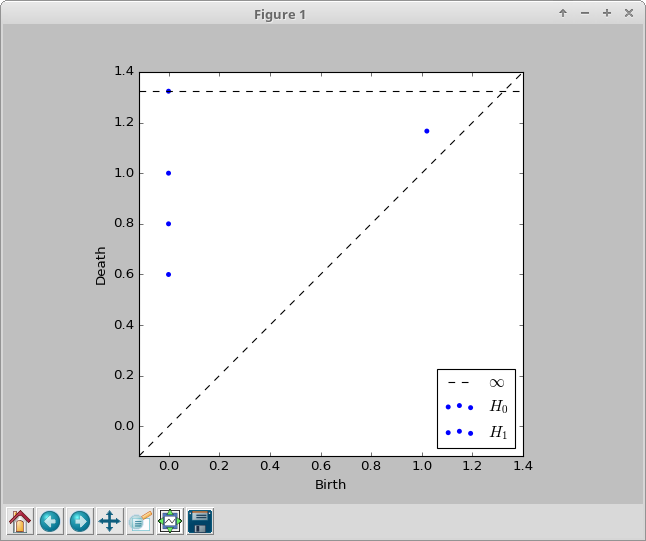
Hello,
I am running
pimgr = PersistenceImager(pixel_size=size,kernel_params={'sigma': [[1.0, 0.0], [0.0, 1.0]]})
pimgr.fit(diagrams_h1)
I was wondering if it possible to 1) drop features that extend to inf using flags in PersistenceImager or in Rips to avoid the "OverflowError: cannot convert float infinity to integer" error when calling pimgr.fit().
and 2) is it possible to compute the PersistenceImage using more than one level of homology(i.e. H0, H1, H2 rather than just H1 from the documentation example).
Thanks!
Hello,
I want to use your library but I got stuck. I would apperciate your help with my issue very much.
I'm trying to compute Wasserstein distance between two persistence diagrams generated through Python Ripser library. I found two interesting functions in Persim: sliced_wasserstein and wasserstein_matching.
My diagram generation looks like that:
data = json.loads(data)
data = pd.DataFrame.from_dict(data)
rips = Rips()
dgms = rips.fit_transform(data)
for i in dgms:
    print(type(i))
    i.tofile(directory+"diagram.txt")
plot_diagrams(dgms, show=False)
plt.savefig("persistence_diagram.png")
plt.close()
'dgms' is a list which contains numpy arrays, so I'm getting them out in my 'for' line.
My Wasserstein function usage looks like that:
with open(loc) as f:
    img1 = np.fromfile(f)
    f.close()
with open(loc2) as f:
    img2 = np.fromfile(f)
    f.close()
persim.sliced_wasserstein(img1, img2)
I tried to pass to wasserstein_matching three kinds of data (diagram in .png, dgms list and np.array) but all I constantly get is an error 'IndexError: too many indices for array'. So I switched into sliced_wasserstein where I get such error:
Traceback (most recent call last): File "C:/Users/Patka/PycharmProjects/MGR/Mapper.py", line 26, in <module> persim.sliced_wasserstein(img1, img2) File "C:\Users\Patka\environmentpython\lib\site-packages\persim\sliced_wasserstein.py", line 53, in sliced_wasserstein sw += step * cityblock(sorted(V1), sorted(V2)) ValueError: The truth value of an array with more than one element is ambiguous. Use a.any() or a.all() One weird thing for me is that when I print i.shape before saving to file, I get two dimensions, e.g. (12,2) but when I read from the same file using numpy.fromfile() I get a tuple (12,).
Does anybody have a cure for that? My final aim is to compute distances for lots of diagrams and to cluster them but I'm stuck on comparing two ones...
First of all, since I was not able to install via pip install persim, I got the source scikit-tda-master.zip and run the setup.py. Also, I'm using Python 2.7 with matplotlib version 1.5.1.
The minimal code below works except by the fact that the diagrams in both dimensions are in blue, not blue/orange, like in documentation.
MWE
import numpy as np
import matplotlib.pyplot as plt
from ripser import Rips
from persim import plot_diagrams
import matplotlib
print('my matplotlib is', matplotlib.__version__) # my matplotlib is 1.5.1

pts = np.array([ [0, 0], [.8, 0], [.6, 1], [0, 1]  ])
rips = Rips(maxdim=1, coeff=2, thresh=2)
diagramas = rips.fit_transform(pts)
print(diagramas[0])
print(diagramas[1])

plot_diagrams(diagramas, show=True)
See the screenshot.
Example:
This does not work: dgm = [[0, 2], [0, 6], [0, 8]];
This one works fine: dgm = [[0.0, 2.0], [0.0, 6.0], [0.0, 8.0]];
Thanks for solving the issue!
The default linear weighting function is being normalized per diagram rather than being fixed or normalized per experiment. As a consequence, the norm of a persistence image corresponding to a diagram with one point very close to the diagonal is not close to zero.
Lines 151 to 160 in 76b2b5a
I averaged different categories of persistent landscapes. How can I calculate the distance between a certain landscape with this average landscape? I want to use it to classify.
ripser behaves normally, but this happens even when I am copying and paste the sample codes in the User Guide. Here's the error code for the user guide codes:
Traceback (most recent call last):

  File "F:\HolyCross\Works\2020SUMMER\TDA\D0\untitled0.py", line 43, in <module>
    img = pim.transform(dgms[1])

  File "C:\Users\ThinkPad\anaconda3\lib\site-packages\persim\images.py", line 94, in transform
    dgs = [np.copy(diagram, np.float64) for diagram in diagrams]

  File "C:\Users\ThinkPad\anaconda3\lib\site-packages\persim\images.py", line 94, in <listcomp>
    dgs = [np.copy(diagram, np.float64) for diagram in diagrams]

  File "<__array_function__ internals>", line 6, in copy

  File "C:\Users\ThinkPad\anaconda3\lib\site-packages\numpy\lib\function_base.py", line 775, in copy
    return array(a, order=order, copy=True)

ValueError: Non-string object detected for the array ordering. Please pass in 'C', 'F', 'A', or 'K' instead
I am new in Python, may I know how I can solve this problem?
I have been plotting a bunch of persistence landscapes for a project I'm working on and I found several issues:
I am planning on submitting a PR to fix these issues. If there are any other issues with plotting landscapes, or any issues with the list I have above, please comment and let me know. Thanks!
Right now, Gaussian kernel and linear weighting function are hard coded. The functionality for this is half built, but needs to be threaded through all the way.
Sorry, but I really want to understand what this code do
curr_img[1:, 1:] - curr_img[:-1, 1:] - curr_img[1:, :-1] + curr_img[:-1, :-1]
in persim/images.py _transform
pers_img += wts[i]*(curr_img[1:, 1:] - curr_img[:-1, 1:] - curr_img[1:, :-1] + curr_img[:-1, :-1])
anybody...!!!
Why persistent landscape module is not working in persim?
The code below should produce a bottleneck distance of 0.5, but it outputs 0.
Any number of repeated intervals (but different between G and H) has the same issue.
import numpy as np
import persim
G= np.array([[ 0, 1], [0,1]])
H= np.array([[ 0, 1]])
print(persim.bottleneck(G, H))
This is the full build log, any idea what's going on?
Hello,
It seems that the current version of numpy does not have the datatype option for numpy.copy(),
which affects the following line:
Line 94 in a904795
Description:
The persim.bottleneck function returns an incorrect result for some input persistence diagrams. When using dgm1 = np.array([[0, 10]]) and dgm2 = np.array([[5, 5]]), the function incorrectly evaluates and returns 0, which is inconsistent with the expected behavior.
Environment:
Python version: 3.9.13
Persim version: 0.3.1
A declarative, efficient, and flexible JavaScript library for building user interfaces.
🖖 Vue.js is a progressive, incrementally-adoptable JavaScript framework for building UI on the web.
TypeScript is a superset of JavaScript that compiles to clean JavaScript output.
An Open Source Machine Learning Framework for Everyone
The Web framework for perfectionists with deadlines.
A PHP framework for web artisans
Bring data to life with SVG, Canvas and HTML. 📊📈🎉
JavaScript (JS) is a lightweight interpreted programming language with first-class functions.
Some thing interesting about web. New door for the world.
A server is a program made to process requests and deliver data to clients.
Machine learning is a way of modeling and interpreting data that allows a piece of software to respond intelligently.
Some thing interesting about visualization, use data art
Some thing interesting about game, make everyone happy.
We are working to build community through open source technology. NB: members must have two-factor auth.
Open source projects and samples from Microsoft.
Google ❤️ Open Source for everyone.
Alibaba Open Source for everyone
Data-Driven Documents codes.
China tencent open source team.