Giter Club home page Giter Club logo

geoplot's Introduction

geoplot: geospatial data visualization

geoplot is a high-level Python geospatial plotting library. It's an extension to cartopy and matplotlib which makes mapping easy: like seaborn for geospatial. It comes with the following features:

  • High-level plotting API: geoplot is cartographic plotting for the 90% of use cases. All of the standard-bearermaps that you’ve probably seen in your geography textbook are easily accessible.
  • Native projection support: The most fundamental peculiarity of geospatial plotting is projection: how do you unroll a sphere onto a flat surface (a map) in an accurate way? The answer depends on what you’re trying to depict. geoplot provides these options.
  • Compatibility with matplotlib: While matplotlib is not a good fit for working with geospatial data directly, it’s a format that’s well-incorporated by other tools.

Installation is simple with conda install geoplot -c conda-forge. See the documentation for help getting started.


Author note: geoplot is currently in a maintenence state. I will continue to provide bugfixes and investigate user-reported issues on a best-effort basis, but do not expect to see any new library features anytime soon.

geoplot's People

Contributors

akarve avatar lmmarsano avatar martinfleis avatar musicinmybrain avatar qulogic avatar residentmario avatar

Stargazers

 avatar  avatar  avatar  avatar  avatar  avatar  avatar  avatar  avatar  avatar  avatar  avatar  avatar  avatar  avatar  avatar  avatar  avatar  avatar  avatar  avatar  avatar  avatar  avatar  avatar  avatar  avatar  avatar  avatar  avatar  avatar  avatar  avatar  avatar  avatar  avatar  avatar  avatar  avatar  avatar  avatar  avatar  avatar  avatar  avatar  avatar  avatar  avatar  avatar  avatar  avatar  avatar  avatar  avatar  avatar  avatar  avatar  avatar  avatar  avatar  avatar  avatar  avatar  avatar  avatar  avatar  avatar  avatar  avatar  avatar  avatar  avatar  avatar  avatar  avatar  avatar  avatar  avatar  avatar  avatar  avatar  avatar  avatar  avatar  avatar  avatar  avatar  avatar  avatar  avatar  avatar  avatar  avatar  avatar  avatar  avatar  avatar  avatar  avatar  avatar

Watchers

 avatar  avatar  avatar  avatar  avatar  avatar  avatar  avatar  avatar  avatar  avatar  avatar  avatar  avatar  avatar  avatar  avatar  avatar  avatar  avatar  avatar  avatar  avatar  avatar  avatar  avatar  avatar  avatar  avatar  avatar  avatar  avatar  avatar  avatar  avatar

geoplot's Issues

Bug: Unknown property legend_values in gplt.choropleth

Hi,
I don't see legend_values in gplt.choropleth source code and of course while trying to run the command I got the error AttributeError: Unknown property legend_values

My question further is that I have a categorical column with values VLOW, LOW, MED, HIGH. I wanted to represent my geomap with:
(a) Legend with this specific order VLOW, LOW, MED, HIGH
(b) Colors of my choice say [darkred, red, blue, green] to make intuitive sense of the labels.

Part (a) as per my understanding would work by using legend_values = ['VLOW', 'LOW', 'MED', 'HIGH'] and legend_labels= ['VLOW', 'LOW', 'MED', 'HIGH'] with categorical = True. Currently as I can only use legend_labels, the legend label order is right, but the values in the map don't match the legend

I have no idea about how to do part (b)

Please help. Thanks!

Handle extent corner cases

There are some corner cases to the way that cartopy ax.set_extent is working as of now. Possible issue areas are extent settings involving very small areas and projection settings which cut across the international dateline.

Solving this isn't really a priority right now, which is why the tests are written around this issue (extent settings are tested in the tests at all). The root issue is really that I don't understand the way that cartopy goes about settings its extent deeply enough to debug what are and aren't valid extent tuples. To make progress on this front, I will need to compile a bunch of examples and probably will need to get help from a cartopy core dev.

For compilation purposes, here are some leads:

  1. Inputting a geopandas.GeoSeries containing only one object, a shapely.geometry.polygon with [c for c in polygon_geoseries.iloc[0].exterior.coords] of [(0.0, 0.0), (0.0, 3.2506e-319), (5e-324, 0.0), (0.0, 0.0)], into polyplot will cause it to crash. Note that despite the hideously small values, this is considered a valid polygon by shapely (shapely.is_valid == True). This test case was generated by hypothesis.
  2. In the sankey documentation, the Orthographic network path demo had to have its extent set manually to work.

subplot problem

I refer on Choropleth subplots

to subplot spatial map with data.

individually it works pretty well.

ax = gplt.polyplot(AB_base )


def power_scale(minval, maxval):

    def scalar(val):
        val = val + abs(minval) + 1
        return (val/100)**3/150
    return scalar


gplt.kdeplot(elevation,  ax=ax,linewidth=0,
             legend = True,
             shade_lowest=False,
             cbar = True,
              clip=AB_base.geometry, cmap='summer_r',
                  shade=True, alpha = 0.6)

gplt.pointplot(geo_station,  ax=ax,
               scale= 'elev(m)',  k = None,
                           limits =(1,30) , 
                          scale_func= power_scale,                             
              hue=geo_station['elev(m)'].astype(float), cmap='viridis_r',
                               alpha = 0.8,
               legend=True, legend_var='hue', 
              )

plt.title("~~~")
plt.show()

image

but when I subplot more variables like this:

def plot_to_ax(state, ax):
   
    
    gplt.polyplot(AB_base, ax = ax)

    gplt.kdeplot(elevation, linewidth=0.0, ax = ax,
                 shade_lowest=False,
                 clip=AB_base.geometry, cmap='summer_r',
                 shade=True, alpha = 0.6)

    gplt.pointplot(geo_station, k = None, ax=ax,
                   scale= state, limits =(1,30),                           
                   hue= state, 
                   cmap='viridis_r',alpha = 0.8,
                   legend=True, legend_var='hue'
                   )
    

# Finally, plot the data.
f, axarr = plt.subplots(2, 2, figsize=(5, 5))

plt.subplots_adjust(top=0.95)

plot_state_to_ax('ANUSPLIN_output', axarr[0][0])
axarr[0][0].set_title('ANUSPLIN (n=6679268)')

plot_state_to_ax('CaPA_output', axarr[0][1])
axarr[0][1].set_title('CaPA (n=854647)')

plot_state_to_ax('NARR_output', axarr[1][0])
axarr[1][0].set_title('NARR(n=215065)')

plot_state_to_ax('TPS_output', axarr[1][1])
axarr[1][1].set_title('TPS (n=126661)')

image

all plot in one result, I think the method should be good - as reference is from the official tutorial.
tried many ways and still get stuck in this problem for 3 days...

any advice or solutions?

thanks

Attempting to select Mollweide projection results in KeyError

Using 0.0.3, Matplotlib 2.0.2, Latest Jupyter:

plt.clf()
proj = gcrs.Mollweide(central_longitude=0.0)

fig, ax = plt.subplots(
    1,
    figsize=(16., 12.),
    dpi=100,
    frameon=False,
    subplot_kw={
        'aspect':'equal',
        'projection': proj
    },
)

Results in an error here:

~/dev/ocrtest/venv/lib/python3.6/site-packages/geoplot/crs.py in _as_mpl_axes(proj)
    278 
    279     """
--> 280     proj = proj.load(gpd.GeoDataFrame(), dict())
    281     return proj._as_mpl_axes()

~/dev/ocrtest/venv/lib/python3.6/site-packages/geoplot/crs.py in load(self, df, centerings)
     56 
     57     def load(self, df, centerings):
---> 58         return _generic_load(self, df, {'central_longitude': centerings['central_longitude']})
     59 
     60     def _as_mpl_axes(self): return _as_mpl_axes(self)

KeyError: 'central_longitude'

I'm seeing the same KeyError with quite a few other projections, too:

  • InterruptedGoodeHomolosine
  • Geostationary
  • Robinson
  • Sinusoidal

Add markerfacecolor & markeredgecolor params to _paint_carto_legend

Hi! Awesome work!

I've been using geoplot to make pointplots such as these.

image

My points are colored with a single color and hence I wanted that my legend would have the same markeredgecolor and facecolor that my points on the map had. I were exploring your codes and it seems that only way to change the legend coloring in _paint_carto_legend was to go and change the source code.

Hence, I would suggest to adding 'markerfacecolor' and 'markeredgecolor' parameters into the legend_kwargs which would allow to adjust those accordinly.

Keep up the good work!
Henrikki

How do you determine the central latitude/longitude values used in the examples?

Example from here:


# Load the data (uses the `quilt` package).
import geopandas as gpd
from quilt.data.ResidentMario import geoplot_data

boroughs = gpd.read_file(geoplot_data.nyc_boroughs())
collisions = gpd.read_file(geoplot_data.nyc_collision_factors())


# Plot the data.
import geoplot.crs as gcrs
import geoplot as gplt
import matplotlib.pyplot as plt

fig = plt.figure(figsize=(10,5))

ax1 = plt.subplot(121, projection=gcrs.AlbersEqualArea(central_latitude=40.7128, central_longitude=-74.0059))

Where do those central_latitude and central_longitude values come from?

fix Sankey Caps - or provide option?

I am working with Sankey - I use it to generate a network of O-D trips for NYC citibikes.
It is awesome, but one thing I found is that each edge caps with the square (?) - meaning that if radius of the node circle is similar to the width of the edge, we see edge corners.

It would be awesome to be able to either make round caps or stop edges at the node itself (see image below)

screenshot 2017-05-11 16 11 36

Can't import geoplot on OSX

I have installed geoplot on OSX using pip. I have the version geoplot (0.0.3).

When running import geoplot as gplt, I have the following error:

SyntaxError: invalid syntax (geoplot.py, line 1641)

I have checked the code and have found that an *args is passed as a first argument followed by named arguments.

I have solved the error (by replacing *args with args) and then I got an error about not finding the quad module: no module named quad.

Has anyone encountered this error before? Any workaround would be appreciated.

Here are some information about my configuration (obtained using watermark library):

2017-03-09 CET

CPython 2.7.10
IPython 4.0.2

pandas 0.18.1
geopandas 0+unknown
numpy 1.11.1
shapely 1.5.13
fiona 1.7.0.post2
pyproj 1.9.5.1
rtree 0.8.2

compiler   : GCC 4.2.1 Compatible Apple LLVM 7.0.0 (clang-700.0.72)
system     : Darwin
release    : 16.4.0
machine    : x86_64
processor  : i386
CPU cores  : 4
interpreter: 64bit
host name  : MacBook-Pro-de-Qucit.local
watermark 1.3.4

Thanks in advance!

GeoPlot on Windows

https://residentmario.github.io/geoplot/installing.html says "Windows ... Unforunately geoplot is not available on Windows yet due to an unresolved dependency issue. Sorry."

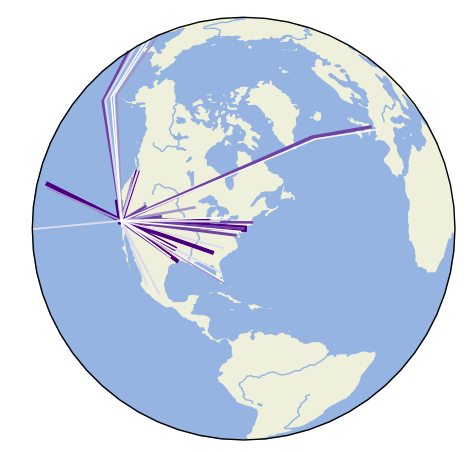
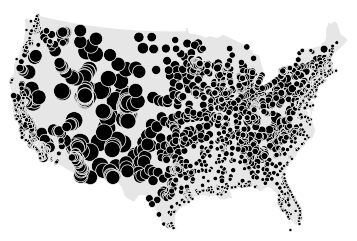
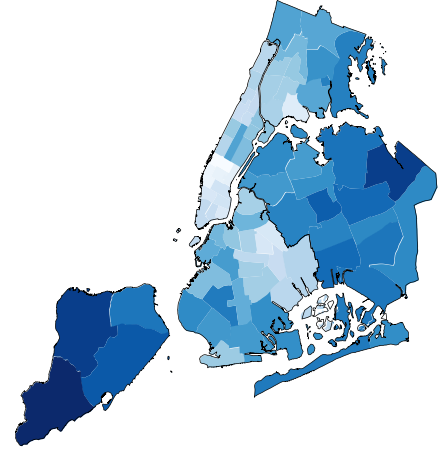
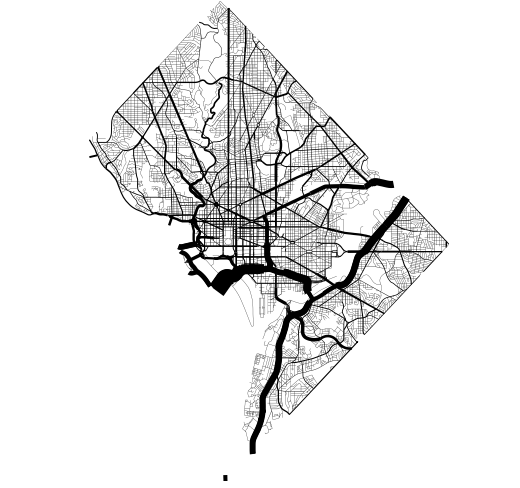
Seemed to install okay on Windows 10 using conda and usable in Jupyter notebooks. See attachment.
But not on the first try, in the 'stock' environment. See attachment.

geoplot_2017-10-23 22_21_56-

I did have to set up an environment and install GeoPandas first, then Geoplot. Your tutorial documentation should provide a link to Quilt - since it appears as code, it isn't obvious if it was part of GeoPlot or not to a beginner.

(C:\Users\Colossus\Anaconda3\envs\GeoProjects) C:\Users\Colossus>conda install -c conda-forge geopandas
Fetching package metadata ...............
Solving package specifications: .

Package plan for installation in environment C:\Users\Colossus\Anaconda3\envs\GeoProjects:

The following NEW packages will be INSTALLED:

backports:                     1.0-py36_1            conda-forge
backports.functools_lru_cache: 1.4-py36_1            conda-forge
click:                         6.7-py36_0            conda-forge
click-plugins:                 1.0.3-py36_0          conda-forge
cligj:                         0.4.0-py36_0          conda-forge
curl:                          7.49.1-vc14_2         conda-forge [vc14]
cycler:                        0.10.0-py36_0         conda-forge
descartes:                     1.1.0-py36_0          conda-forge
expat:                         2.2.1-vc14_0          conda-forge [vc14]
fiona:                         1.7.9-py36_1          conda-forge
freetype:                      2.7-vc14_1            conda-forge [vc14]
freexl:                        1.0.2-vc14_2          conda-forge [vc14]
gdal:                          2.1.3-py36_vc14_4     conda-forge [vc14]
geopandas:                     0.3.0-py36_0          conda-forge
geos:                          3.5.1-vc14_1          conda-forge [vc14]
hdf4:                          4.2.12-vc14_0         conda-forge [vc14]
hdf5:                          1.8.18-vc14_1         conda-forge [vc14]
icc_rt:                        2017.0.4-h97af966_0
icu:                           58.1-vc14_1           conda-forge [vc14]
intel-openmp:                  2018.0.0-hcd89f80_7
jpeg:                          9b-vc14_1             conda-forge [vc14]
kealib:                        1.4.7-vc14_3          conda-forge [vc14]
krb5:                          1.14.2-vc14_0         conda-forge [vc14]
libiconv:                      1.14-vc14_4           conda-forge [vc14]
libnetcdf:                     4.4.1.1-vc14_6        conda-forge [vc14]
libpng:                        1.6.28-vc14_1         conda-forge [vc14]
libpq:                         9.6.3-vc14_0          conda-forge [vc14]
libspatialindex:               1.8.5-vc14_1          conda-forge [vc14]
libspatialite:                 4.3.0a-vc14_15        conda-forge [vc14]
libtiff:                       4.0.7-vc14_0          conda-forge [vc14]
libxml2:                       2.9.5-vc14_0          conda-forge [vc14]
matplotlib:                    2.1.0-py36_0          conda-forge
mkl:                           2018.0.0-h36b65af_4
munch:                         2.2.0-py36_0          conda-forge
numpy:                         1.13.3-py36ha320f96_0
openjpeg:                      2.3.0-vc14_0          conda-forge [vc14]
pandas:                        0.20.3-py36_1         conda-forge
pcre:                          8.39-vc14_0           conda-forge [vc14]
proj4:                         4.9.3-vc14_4          conda-forge [vc14]
psycopg2:                      2.7.3.1-py36_0        conda-forge
pyproj:                        1.9.5.1-py36_0        conda-forge
pyqt:                          5.6.0-py36_4          conda-forge
pysal:                         1.14.2-py36_1         conda-forge
pytz:                          2017.2-py36_0         conda-forge
qt:                            5.6.2-vc14_2          conda-forge [vc14]
rtree:                         0.8.3-py36_0          conda-forge
scipy:                         0.19.1-py36h7565378_3
shapely:                       1.6.1-py36_1          conda-forge
sip:                           4.18-py36_1           conda-forge
sqlalchemy:                    1.1.13-py36_0         conda-forge
sqlite:                        3.13.0-vc14_0         conda-forge [vc14]
xerces-c:                      3.1.4-vc14_2          conda-forge [vc14]
zlib:                          1.2.8-vc14_3          conda-forge [vc14]

Proceed ([y]/n)? y

jpeg-9b-vc14_1 100% |###############################| Time: 0:00:00 419.24 kB/s
zlib-1.2.8-vc1 100% |###############################| Time: 0:00:00 559.25 kB/s
curl-7.49.1-vc 100% |###############################| Time: 0:00:00 526.12 kB/s
hdf5-1.8.18-vc 100% |###############################| Time: 0:00:19 687.67 kB/s
icu-58.1-vc14_ 100% |###############################| Time: 0:00:29 765.79 kB/s
libiconv-1.14- 100% |###############################| Time: 0:00:01 562.68 kB/s
libpng-1.6.28- 100% |###############################| Time: 0:00:00 559.08 kB/s
libtiff-4.0.7- 100% |###############################| Time: 0:00:01 476.98 kB/s
backports-1.0- 100% |###############################| Time: 0:00:00 0.00 B/s
click-6.7-py36 100% |###############################| Time: 0:00:00 261.89 kB/s
freetype-2.7-v 100% |###############################| Time: 0:00:01 436.01 kB/s
libnetcdf-4.4. 100% |###############################| Time: 0:00:00 556.16 kB/s
libxml2-2.9.5- 100% |###############################| Time: 0:00:04 698.61 kB/s
numpy-1.13.3-p 100% |###############################| Time: 0:00:02 1.79 MB/s
openjpeg-2.3.0 100% |###############################| Time: 0:00:01 495.75 kB/s
pytz-2017.2-py 100% |###############################| Time: 0:00:00 214.11 kB/s
sip-4.18-py36_ 100% |###############################| Time: 0:00:00 371.30 kB/s
sqlalchemy-1.1 100% |###############################| Time: 0:00:02 740.63 kB/s
cycler-0.10.0- 100% |###############################| Time: 0:00:00 989.30 kB/s
pyqt-5.6.0-py3 100% |###############################| Time: 0:00:07 670.47 kB/s
backports.func 100% |###############################| Time: 0:00:00 0.00 B/s
gdal-2.1.3-py3 100% |###############################| Time: 0:01:01 865.54 kB/s
pandas-0.20.3- 100% |###############################| Time: 0:00:11 753.15 kB/s
matplotlib-2.1 100% |###############################| Time: 0:00:10 641.83 kB/s

(C:\Users\Colossus\Anaconda3\envs\GeoProjects) C:\Users\Colossus>conda install geoplot -c conda-forge
Fetching package metadata ...............
Solving package specifications: .

Package plan for installation in environment C:\Users\Colossus\Anaconda3\envs\GeoProjects:

The following NEW packages will be INSTALLED:

cartopy:     0.15.1-py36_4 conda-forge
geoplot:     0.1.1-py_0    conda-forge
libxslt:     1.1.29-vc14_5 conda-forge [vc14]
lxml:        4.1.0-py36_0  conda-forge
olefile:     0.44-py36_0   conda-forge
owslib:      0.15.0-py_0   conda-forge
patsy:       0.4.1-py36_0  conda-forge
pillow:      4.3.0-py36_0  conda-forge
pyepsg:      0.3.2-py36_0  conda-forge
pyshp:       1.2.12-py_0   conda-forge
seaborn:     0.8.1-py36_0  conda-forge
statsmodels: 0.8.0-py36_0  conda-forge

Proceed ([y]/n)? y

olefile-0.44-p 100% |###############################| Time: 0:00:00 262.21 kB/s
libxslt-1.1.29 100% |###############################| Time: 0:00:00 527.79 kB/s
pillow-4.3.0-p 100% |###############################| Time: 0:00:00 1.21 MB/s
lxml-4.1.0-py3 100% |###############################| Time: 0:00:01 933.02 kB/s
patsy-0.4.1-py 100% |###############################| Time: 0:00:00 411.64 kB/s
statsmodels-0. 100% |###############################| Time: 0:00:09 700.37 kB/s
seaborn-0.8.1- 100% |###############################| Time: 0:00:01 273.89 kB/s

(C:\Users\Colossus\Anaconda3\envs\GeoProjects) C:\Users\Colossus>pip install quilt
Collecting quilt
Downloading quilt-2.7.0.tar.gz
Collecting appdirs>=1.4.0 (from quilt)
Downloading appdirs-1.4.3-py2.py3-none-any.whl
Collecting future>=0.16.0 (from quilt)
Downloading future-0.16.0.tar.gz (824kB)
100% |████████████████████████████████| 829kB 1.5MB/s
Requirement already satisfied: packaging>=16.8 in c:\users\colossus\anaconda3\envs\geoprojects\lib\site-packages (from quilt)
Requirement already satisfied: pandas>=0.19.2 in c:\users\colossus\anaconda3\envs\geoprojects\lib\site-packages (from quilt)
Collecting pyarrow>=0.4.0 (from quilt)
Downloading pyarrow-0.7.1-cp36-cp36m-win_amd64.whl (2.6MB)
100% |████████████████████████████████| 2.6MB 1.9MB/s
Requirement already satisfied: pyOpenSSL>=16.2.0 in c:\users\colossus\anaconda3\envs\geoprojects\lib\site-packages (from quilt)
Collecting pyyaml>=3.12 (from quilt)
Downloading PyYAML-3.12.tar.gz (253kB)
100% |████████████████████████████████| 256kB 1.8MB/s
Requirement already satisfied: requests>=2.12.4 in c:\users\colossus\anaconda3\envs\geoprojects\lib\site-packages (from quilt)
Collecting responses<0.6.1,>=0.5.1 (from quilt)
Downloading responses-0.6.0-py2.py3-none-any.whl
Requirement already satisfied: six>=1.10.0 in c:\users\colossus\anaconda3\envs\geoprojects\lib\site-packages (from quilt)
Collecting tables>=3.3.0 (from quilt)
Downloading tables-3.4.2-1-cp36-cp36m-win_amd64.whl (2.5MB)
100% |████████████████████████████████| 2.5MB 1.7MB/s
Collecting tqdm>=4.11.2 (from quilt)
Downloading tqdm-4.19.4-py2.py3-none-any.whl (50kB)
100% |████████████████████████████████| 51kB 1.2MB/s
Collecting xlrd>=1.0.0 (from quilt)
Downloading xlrd-1.1.0-py2.py3-none-any.whl (108kB)
100% |████████████████████████████████| 112kB 2.1MB/s
Requirement already satisfied: pyparsing in c:\users\colossus\anaconda3\envs\geoprojects\lib\site-packages (from packaging>=16.8->quilt)
Requirement already satisfied: python-dateutil>=2 in c:\users\colossus\anaconda3\envs\geoprojects\lib\site-packages (from pandas>=0.19.2->quilt)
Requirement already satisfied: pytz>=2011k in c:\users\colossus\anaconda3\envs\geoprojects\lib\site-packages (from pandas>=0.19.2->quilt)
Requirement already satisfied: numpy>=1.7.0 in c:\users\colossus\anaconda3\envs\geoprojects\lib\site-packages (from pandas>=0.19.2->quilt)
Requirement already satisfied: cryptography>=1.9 in c:\users\colossus\anaconda3\envs\geoprojects\lib\site-packages (from pyOpenSSL>=16.2.0->quilt)
Requirement already satisfied: chardet<3.1.0,>=3.0.2 in c:\users\colossus\anaconda3\envs\geoprojects\lib\site-packages (from requests>=2.12.4->quilt)
Requirement already satisfied: idna<2.7,>=2.5 in c:\users\colossus\anaconda3\envs\geoprojects\lib\site-packages (from requests>=2.12.4->quilt)
Requirement already satisfied: urllib3<1.23,>=1.21.1 in c:\users\colossus\anaconda3\envs\geoprojects\lib\site-packages (from requests>=2.12.4->quilt)
Requirement already satisfied: certifi>=2017.4.17 in c:\users\colossus\anaconda3\envs\geoprojects\lib\site-packages (from requests>=2.12.4->quilt)
Collecting cookies (from responses<0.6.1,>=0.5.1->quilt)
Downloading cookies-2.2.1-py2.py3-none-any.whl (44kB)
100% |████████████████████████████████| 51kB 2.3MB/s
Collecting numexpr>=2.5.2 (from tables>=3.3.0->quilt)
Downloading numexpr-2.6.4-cp36-none-win_amd64.whl (86kB)
100% |████████████████████████████████| 92kB 2.4MB/s
Requirement already satisfied: asn1crypto>=0.21.0 in c:\users\colossus\anaconda3\envs\geoprojects\lib\site-packages (from cryptography>=1.9->pyOpenSSL>=16.2.0->quilt)
Requirement already satisfied: cffi>=1.7 in c:\users\colossus\anaconda3\envs\geoprojects\lib\site-packages (from cryptography>=1.9->pyOpenSSL>=16.2.0->quilt)
Requirement already satisfied: pycparser in c:\users\colossus\anaconda3\envs\geoprojects\lib\site-packages (from cffi>=1.7->cryptography>=1.9->pyOpenSSL>=16.2.0->quilt)
Building wheels for collected packages: quilt, future, pyyaml
Running setup.py bdist_wheel for quilt ... done
Stored in directory: C:\Users\Colossus\AppData\Local\pip\Cache\wheels\41\dd\ee\c487611a88a67180d0b88de92417ec9556957d6e8776a68ef0
Running setup.py bdist_wheel for future ... done
Stored in directory: C:\Users\Colossus\AppData\Local\pip\Cache\wheels\c2\50\7c\0d83b4baac4f63ff7a765bd16390d2ab43c93587fac9d6017a
Running setup.py bdist_wheel for pyyaml ... done
Stored in directory: C:\Users\Colossus\AppData\Local\pip\Cache\wheels\2c\f7\79\13f3a12cd723892437c0cfbde1230ab4d82947ff7b3839a4fc
Successfully built quilt future pyyaml
Installing collected packages: appdirs, future, pyarrow, pyyaml, cookies, responses, numexpr, tables, tqdm, xlrd, quilt
Successfully installed appdirs-1.4.3 cookies-2.2.1 future-0.16.0 numexpr-2.6.4 pyarrow-0.7.1 pyyaml-3.12 quilt-2.7.0 responses-0.6.0 tables-3.4.2 tqdm-4.19.4 xlrd-1.1.0

(C:\Users\Colossus\Anaconda3\envs\GeoProjects) C:\Users\Colossus>quilt install ResidentMario/geoplot_data
Downloading 2ed72f0dcadd6ae5754664b6dc81ac0f52555d68f285f5f15267bea05d8496a5 (1/17)...
100%|█████████████████████████████████████████████████████████████████████████████| 1.67K/1.67K [00:00<00:00, 1.60MB/s]
Downloading 34bd0416df19c624f79475cf22bd9380f9c442a013ac5f2376157ad482e18aed (2/17)...
100%|█████████████████████████████████████████████████████████████████████████████| 1.33K/1.33K [00:00<00:00, 1.33MB/s]
Downloading 541fc9abd92d5c1e9f842a1a7fcdf667eb15dfd0358f47b84626909134b294c0 (3/17)...
100%|█████████████████████████████████████████████████████████████████████████████████████████| 141/141 [00:00<?, ?B/s]
Downloading 6ed12561ef35e5a1c9494fd23d565020649abccded02ce01ee105599826552ae (4/17)...
100%|██████████████████████████████████████████████████████████████████████████████████| 975/975 [00:00<00:00, 927KB/s]
Downloading 777fcc2d4ccda556acb1786990b14ae99e420d46f40b3c4edbd99a3fa63760b8 (5/17)...
100%|██████████████████████████████████████████████████████████████████████████████| 16.5K/16.5K [00:00<00:00, 117KB/s]
Downloading a01523501f4f24d413299ffb92a797b2cc84d503a4d90dfefa67901aa6c2c445 (6/17)...
100%|██████████████████████████████████████████████████████████████████████████████| 1.42M/1.42M [00:01<00:00, 900KB/s]
Downloading a015564a938943ce2aea8f317e1e53058233ce58a5bd4cdd125e59f782ef064e (7/17)...
100%|██████████████████████████████████████████████████████████████████████████████| 2.84M/2.84M [00:02<00:00, 998KB/s]
Downloading ba883b9d8a194028cb83f2fc75fedbc88cc072bfa863337a554bf972f4d604d5 (8/17)...
100%|██████████████████████████████████████████████████████████████████████████████| 1.13M/1.13M [00:01<00:00, 707KB/s]
Downloading babd0c3d702e85dacc7ad2f08250bf9823a6a7295367a110f130188e356fa7db (9/17)...
100%|██████████████████████████████████████████████████████████████████████████████| 3.44M/3.44M [00:07<00:00, 446KB/s]
Downloading c19a467e07d134f78b35f0d90354f50a7b696919ecbf53fb205f39780007e372 (10/17)...
100%|████████████████████████████████████████████████████████████████████████████████| 135K/135K [00:00<00:00, 561KB/s]
Downloading c794f51e6c045c775483df5f071881b9dde247ab4a62916897d952de92e87a75 (11/17)...
100%|██████████████████████████████████████████████████████████████████████████████| 94.2K/94.2K [00:00<00:00, 453KB/s]
Downloading cbdfc111c7f8b69c7da6a4c0ee191f780355deaafd90ac3b504262445f9638dc (12/17)...
100%|██████████████████████████████████████████████████████████████████████████████| 1.42M/1.42M [00:04<00:00, 347KB/s]
Downloading d2dcdbb925f5b02c9bf8600fe632db0ba0c1ea3b598e9b0ff24b8826f6e805b3 (13/17)...
100%|████████████████████████████████████████████████████████████████████████████████| 243K/243K [00:00<00:00, 608KB/s]
Downloading e128404cfc2cd0c4c749671ade13e9be39b22e924ddb601370ac3ff02c2bbd81 (14/17)...
100%|████████████████████████████████████████████████████████████████████████████████| 117K/117K [00:00<00:00, 592KB/s]
Downloading e134e406457a79959f52545b0d1fc75a8fb217b737889836685c878fc8d7e6e1 (15/17)...
100%|████████████████████████████████████████████████████████████████████████████████| 395K/395K [00:00<00:00, 577KB/s]
Downloading f1609dd6f76946cc6c1bdb17134ee598fe346bd013a6e7a749534acaf4d73d57 (16/17)...
100%|████████████████████████████████████████████████████████████████████████████████| 686K/686K [00:01<00:00, 505KB/s]
Downloading ff65dd10cb042b95a1cf5489aab3812e1e468eedc51fba7e3933e47b16b2775a (17/17)...
100%|█████████████████████████████████████████████████████████████████████████████| 1.77K/1.77K [00:00<00:00, 1.77MB/s]

(C:\Users\Colossus\Anaconda3\envs\GeoProjects) C:\Users\Colossus>

Choropleth map behavior

Hi, I was looking at the choropleth map function of this module, but the input argument seems a little bit confusing:

  1. The first input argument, df, is the "data being plotted". From your example, I deduced that df should be the information obtained from some shapefiles. If this is true, could you update the documentation and variable name, so that it is less confusing?

  2. From the documentation (as well as the examples), I cannot figure out how to plot continuously-valued data (for example, population density per state). The more intuitive input structure, in my opinion, is using a Python dictionary, with keys being names of polygons (corresponding to the polygons in the shapefiles), and values being the values to be mapped into colors (which can either be categorical or continuous). In this way, potential users who have their own shapefiles and the corresponding data (stored as a Python dict) can easily plot a choropleth map.

  3. The USA map lacks Alaska and Hawaii.

Incidentally, I was working on a similar choropleth map plotting problem, for which I submitted a pull request to matplotlib: matplotlib/basemap#366. I added Alaska and Hawaii elegantly into the corner of the USA map, and I also used Python dictionary as my input data structure.

Just offering my two cents.

slim down the repository!

I just cloned geoplot and it's >100MB!

I bet a lot of this comes from the data module...could you host that data online somewhere (e.g. figshare?) and have users download it similarly to the geopandas.datasets module?

ImportError with clean install

Hello,

I've been trying to install geopandas into a fresh conda environment (python 3.5 + geopandas) but I keep hitting a strange ImportError when trying to import the package. Can you advise?

This SO question appears to replicate the issue, but the packages appear to be slightly out of date: Trouble importing fiona (OGR wrapper) and geopandas

Input:

import geopandas as gpd

Output:

---------------------------------------------------------------------------
ImportError                               Traceback (most recent call last)
<ipython-input-3-f8b81fe8ca07> in <module>()
----> 1 import geopandas as gpd

/Users/jacksongs/anaconda3/lib/python3.5/site-packages/geopandas/__init__.py in <module>()
      2 from geopandas.geodataframe import GeoDataFrame
      3 
----> 4 from geopandas.io.file import read_file
      5 from geopandas.io.sql import read_postgis
      6 from geopandas.tools import sjoin

/Users/jacksongs/anaconda3/lib/python3.5/site-packages/geopandas/io/file.py in <module>()
      1 import os
      2 
----> 3 import fiona
      4 import numpy as np
      5 from shapely.geometry import mapping

/Users/jacksongs/anaconda3/lib/python3.5/site-packages/fiona/__init__.py in <module>()
     67 from six import string_types
     68 
---> 69 from fiona.collection import Collection, BytesCollection, vsi_path
     70 from fiona._drivers import driver_count, GDALEnv
     71 from fiona.drvsupport import supported_drivers

/Users/jacksongs/anaconda3/lib/python3.5/site-packages/fiona/collection.py in <module>()
      7 
      8 from fiona import compat
----> 9 from fiona.ogrext import Iterator, ItemsIterator, KeysIterator
     10 from fiona.ogrext import Session, WritingSession
     11 from fiona.ogrext import (

ImportError: dlopen(/Users/jacksongs/anaconda3/lib/python3.5/site-packages/fiona/ogrext.cpython-35m-darwin.so, 2): Symbol not found: __ZN2H56H5FileC1ERKNSt3__112basic_stringIcNS1_11char_traitsIcEENS1_9allocatorIcEEEEjRKNS_17FileCreatPropListERKNS_15FileAccPropListE
  Referenced from: /Users/jacksongs/anaconda3/lib//libkea.1.4.6.dylib
  Expected in: /Users/jacksongs/anaconda3/lib//libhdf5_cpp.12.dylib
 in /Users/jacksongs/anaconda3/lib//libkea.1.4.6.dylib

Output of conda list:

# packages in environment at /Users/jacksongs/anaconda3/envs/geo:
#
ca-certificates           2017.1.23                     0    conda-forge
certifi                   2017.1.23                py35_0    conda-forge
click                     6.7                      py35_0    conda-forge
click-plugins             1.0.3                    py35_0    conda-forge
cligj                     0.4.0                    py35_0    conda-forge
curl                      7.52.1                        0    conda-forge
cycler                    0.10.0                   py35_0    conda-forge
descartes                 1.1.0                    py35_0    conda-forge
expat                     2.1.0                         2    conda-forge
fiona                     1.7.3               np112py35_0    conda-forge
freetype                  2.7                           1    conda-forge
freexl                    1.0.2                         1    conda-forge
gdal                      2.1.3               np112py35_1    conda-forge
geopandas                 0.2.1                    py35_3    conda-forge
geos                      3.5.1                         1    conda-forge
giflib                    5.1.4                         0    conda-forge
hdf4                      4.2.12                        0    conda-forge
hdf5                      1.8.17                        9    conda-forge
icu                       58.1                          1    conda-forge
jpeg                      9b                            0    conda-forge
json-c                    0.12                          0    conda-forge
kealib                    1.4.6                         3    conda-forge
libdap4                   3.18.3                        2    conda-forge
libgfortran               3.0.0                         0    conda-forge
libiconv                  1.14                          4    conda-forge
libnetcdf                 4.4.1.1                       2    conda-forge
libpng                    1.6.28                        0    conda-forge
libpq                     9.5.4                         3    conda-forge
libspatialindex           1.8.5                         1    conda-forge
libspatialite             4.3.0a                       14    conda-forge
libtiff                   4.0.6                         7    conda-forge
libxml2                   2.9.4                         4    conda-forge
matplotlib                2.0.0               np112py35_2    conda-forge
mkl                       2017.0.1                      0  
munch                     2.1.0                    py35_0    conda-forge
ncurses                   5.9                          10    conda-forge
numpy                     1.12.0                   py35_0  
openjpeg                  2.1.2                         2    conda-forge
openssl                   1.0.2h                        3    conda-forge
pandas                    0.19.2              np112py35_1    conda-forge
pcre                      8.39                          0    conda-forge
pip                       9.0.1                    py35_0    conda-forge
proj4                     4.9.3                         2    conda-forge
psycopg2                  2.6.2                    py35_1    conda-forge
pyparsing                 2.1.10                   py35_0    conda-forge
pyproj                    1.9.5.1                  py35_0    conda-forge
pysal                     1.13.0                   py35_0    conda-forge
python                    3.5.3                         1    conda-forge
python-dateutil           2.6.0                    py35_0    conda-forge
pytz                      2016.10                  py35_0    conda-forge
readline                  6.2                           0    conda-forge
rtree                     0.8.3                    py35_0    conda-forge
scipy                     0.18.1              np112py35_1  
setuptools                33.1.0                   py35_0    conda-forge
shapely                   1.5.17              np112py35_2    conda-forge
six                       1.10.0                   py35_1    conda-forge
sqlalchemy                1.1.5                    py35_0    conda-forge
sqlite                    3.13.0                        1    conda-forge
tk                        8.5.19                        1    conda-forge
tornado                   4.4.2                    py35_0    conda-forge
wheel                     0.29.0                   py35_0    conda-forge
xerces-c                  3.1.4                         3    conda-forge
xz                        5.2.2                         0    conda-forge
zlib                      1.2.11                        0    conda-forge

Single-pixel edge inversion in the voronoi plot when clipping is used

The new voronoi plot type has random junk lines on the edges of the plot when both a projection is set (e.g. the underlying axis instance is a cartopy object) and a clip is used:

The clipping is done by taking the symmetric difference between a rectangle whose corners are the extent of the plot (e.g. the corners) and the given set of geometries used to actually clip the data. This routine is implemented in _get_clip.

It appears that there are rounding errors in calculating where the "true edge" of the plot lies, resulting in single-pixel "windows" on the edge of the plot where data, if it exists, can peek through.

This is particularly puzzling because kdeplot suffered from the same problem initially, but I solved it by simply scaling the coverage rectangle by a factor of 1.25 (shapely.affinity.scale(rect, xfact=1.25, yfact=1.25)), producing something that ought to white-wash data even past the plot borders. But clearly this is not working in this case!

This example was generated as follows:

import quilt
from quilt.data.ResidentMario import geoplot_data
import geopandas as gpd

boroughs = gpd.read_file(geoplot_data.nyc_boroughs())
fatal_collisions = gpd.read_file(geoplot_data.nyc_fatal_collisions())
injurious_collisions = gpd.read_file(geoplot_data.nyc_injurious_collisions())

import geoplot.crs as gcrs
import geoplot as gplt
# %matplotlib inline

ax = gplt.voronoi(injurious_collisions.head(1000), projection=gcrs.AlbersEqualArea(), 
             hue='NUMBER OF PERSONS INJURED', cmap='Blues', categorical=False,
             edgecolor='white', linewidth=1, clip=boroughs.geometry
)
gplt.polyplot(boroughs, projection=gcrs.AlbersEqualArea(), linewidth=2, ax=ax)

Mapping to state names in geoplot_data.contiguous_usa

I recently used geoplot to create a map of mesothelioma mortality by state in the contiguous United States (notebook).

The geometry information is obtained from the contiguous_usa dataset of the quilt dataset. Each state is identified by its adm1_code. I couldn't find a mapping of adm1_code to state name. Is there a resource that defines these level 1 administrative codes?

Anyways, I took the state names from the Choropleth subplots example, doing the following:

contiguous_usa['State'] = [
    'Minnesota', 'Montana', 'North Dakota', 'Idaho', 'Washington', 'Arizona',
    'California', 'Colorado', 'Nevada', 'New Mexico', 'Oregon', 'Utah', 'Wyoming',
    'Arkansas', 'Iowa', 'Kansas', 'Missouri', 'Nebraska', 'Oklahoma', 'South Dakota',
    'Louisiana', 'Texas', 'Connecticut', 'Massachusetts', 'New Hampshire',
    'Rhode Island', 'Vermont', 'Alabama', 'Florida', 'Georgia', 'Mississippi',
    'South Carolina', 'Illinois', 'Indiana', 'Kentucky', 'North Carolina', 'Ohio',
    'Tennessee', 'Virginia', 'Wisconsin', 'West Virginia', 'Delaware', 'District of Columbia',
    'Maryland', 'New Jersey', 'New York', 'Pennsylvania', 'Maine', 'Michigan',
]

I hate to assign by position like this because it's so error prone. It would be nice to add a state column to the contiguous_usa dataset, so users don't have to perform this fragile manual step. Or at the minimum, use a dictionary to map adm1_code to state in examples, so at least most issues that arise will be more apparent.

More generally, where are good places to receive geometry data? I wasn't sure how limited users are to the quilt datasets? Say for example, I wanted to remake the plot with Alaska and Hawaii? I guess what I'm interested in is these geometry polygons for all administrative areas.

Support Multiple legend, Line Legend

I am using geoplot to plot a network over the map of NYC.
It works good, but I have troubles with drawing the legend:

my_dpi = 96
fig =  plt.figure( figsize=(600/my_dpi, 1500/my_dpi), dpi=my_dpi)
ax1 = plt.subplot(211, projection=gcrs.AlbersEqualArea(central_latitude=40.7128, central_longitude=-74.03))
ax1.margins(0)


gplt.polyplot(hoods['geometry'], ax=ax1, **polyplot_kwargs);
gplt.pointplot(sl, ax=ax1, limits=(1, 15), scale='count', **pointplot_kwargs,
               legend=True, legend_var='scale',
               legend_values=[10000, 50000, 100000],
               legend_labels=['10,000','50,000', '100,000'],
               legend_kwargs=legend_kwargs)

gplt.sankey(lines.query('count > 5000'), limits=(1, 15), 
            start='start_point', end='end_point',
            scale='count', ax=ax1, **lines_kwargs)

ax1.set_ylim((-6000, 12000));
ax1.set_xlim((-6000, 11500));
ax1.text(0, 0.88, 'Citibike Network', color='#004C74', 
         alpha=1, fontsize=16, transform = ax1.transAxes)
ax1.text(0, 0.84, 'May-Sep 2016', color='#004C74', 
         alpha=1, fontsize=10, transform = ax1.transAxes)

And the result is
download_network1

However, what I want is

  1. legend of lines (as lines, if possible)
  2. legend of circles/points in the same style

Is there any way to resolve that?

Checklist for 0.0.5

  • Refresh tutorials content.
  • Find a way to fix painting the Sankey webmap example.
  • Get the documentation into a stable state.
  • Vacuum down repo size.
  • Clean out a feasible chunk of the other various issues in the bug tracker.

Import error in Windows with 32 bit python 2.7

I installed geoplot on top of Anaconda Python 2.7 (32 bit) using conda-forge channel mentioned in the documentation. But I cannot import this package.

import geoplot as gplt
results in following error

ImportError Traceback (most recent call last)
in ()
----> 1 import geoplot as gplt

ImportError: No module named geoplot

Can you please let me if geoplot works on Windows with 32 bit Python 2.7. Did not find this information anywhere in the documentation.

Make dataset example self-contained

I've consolidated the example datasets under a geopandas-like geoplot.datasets domain (here).

This has the beneficial effect that it makes all of the examples in the geoplot documentation, especially the ones in the gallery, immediately reproducible for the user. However, the drawback is that I also have to distribute the example data with the library. After hewing and hawing every which way, I've gotten that down to a ~10 MB examples.zip file.

@choldgraf I would like your feedback on this idea. Is a 10 MB add-on like this an acceptable load for such a library? Or should I maybe provide an nltk-like downloader instead?

Does geoplot share my data with online services?

I'm in need of a plotting library like geoplot, but since I'm not allowed to share the data I'm plotting with any third party, I want to make sure that none of the data is sent to a third party online service, possibly for retrieving maps and similar data?

Assigning projections to plt.subplots()-generated axes generates rotated images

First off, this is a great library, thanks for making it!

I'm running into some non-intuitive behavior when using projections with plt.subplots()-generated axes. Briefly, passing a projection argument to both plt.subplots (via subplot_kw=) and gplt.polyplot generates images which are rotated by ~30 degrees. Minimum working example below:

import geoplot as gplt
import geopandas as gpd
import shapely
import matplotlib.pyplot as plt

square = shapely.geometry.Polygon([(41.5, 88), (41.75, 88), (41.75, 87.5), (41.5, 87.5)])

fig, ax = plt.subplots(1,1, subplot_kw={'projection': gplt.crs.AlbersEqualArea()})

gplt.polyplot(gpd.GeoDataFrame({'geometry':square}, index=[1]), projection=gplt.crs.AlbersEqualArea(), ax=ax)

For me this generates a plot of a rectangle rotated by about 30 degrees.

Some notes:

  1. Passing the projection argument to plt.subplots is mandatory because without it you get back a matplotlib.axes._subplots.AxesSubplot instead of a cartopy.mpl.geoaxes.GeoAxesSubplot
  2. Omitting the projection argument in the gplt.polyplot call generates an image that is way too big and extends past the edge of the plot.

Versions:

geoplot==0.0.3
geopandas==0.2.1
Shapely==1.5.17.post1
matplotlib==2.0.0
Cartopy==0.15.1

Recommend Projects

  • React photo React

    A declarative, efficient, and flexible JavaScript library for building user interfaces.

  • Vue.js photo Vue.js

    🖖 Vue.js is a progressive, incrementally-adoptable JavaScript framework for building UI on the web.

  • Typescript photo Typescript

    TypeScript is a superset of JavaScript that compiles to clean JavaScript output.

  • TensorFlow photo TensorFlow

    An Open Source Machine Learning Framework for Everyone

  • Django photo Django

    The Web framework for perfectionists with deadlines.

  • D3 photo D3

    Bring data to life with SVG, Canvas and HTML. 📊📈🎉

Recommend Topics

  • javascript

    JavaScript (JS) is a lightweight interpreted programming language with first-class functions.

  • web

    Some thing interesting about web. New door for the world.

  • server

    A server is a program made to process requests and deliver data to clients.

  • Machine learning

    Machine learning is a way of modeling and interpreting data that allows a piece of software to respond intelligently.

  • Game

    Some thing interesting about game, make everyone happy.

Recommend Org

  • Facebook photo Facebook

    We are working to build community through open source technology. NB: members must have two-factor auth.

  • Microsoft photo Microsoft

    Open source projects and samples from Microsoft.

  • Google photo Google

    Google ❤️ Open Source for everyone.

  • D3 photo D3

    Data-Driven Documents codes.