


Since 0.2.0, NO LONGER, phantomjs is required! NO LONGER, it supports python 2.7
BUT, the capability to render pyecharts in a script has been merged into pyecharts 1.0.0. And the dependency on phantomjs has been sprawn as: snapshot-phantomjs .
If you love to use 'snapshot' command line, please continue to use this project.
pyecharts-snapshot renders the output of pyecharts/echarts.js as a png, jpeg, gif, eps, svg image, raw base64 encoding or a pdf file at command line.
Get png:
$ snapshot render.htmlAnd you will get:
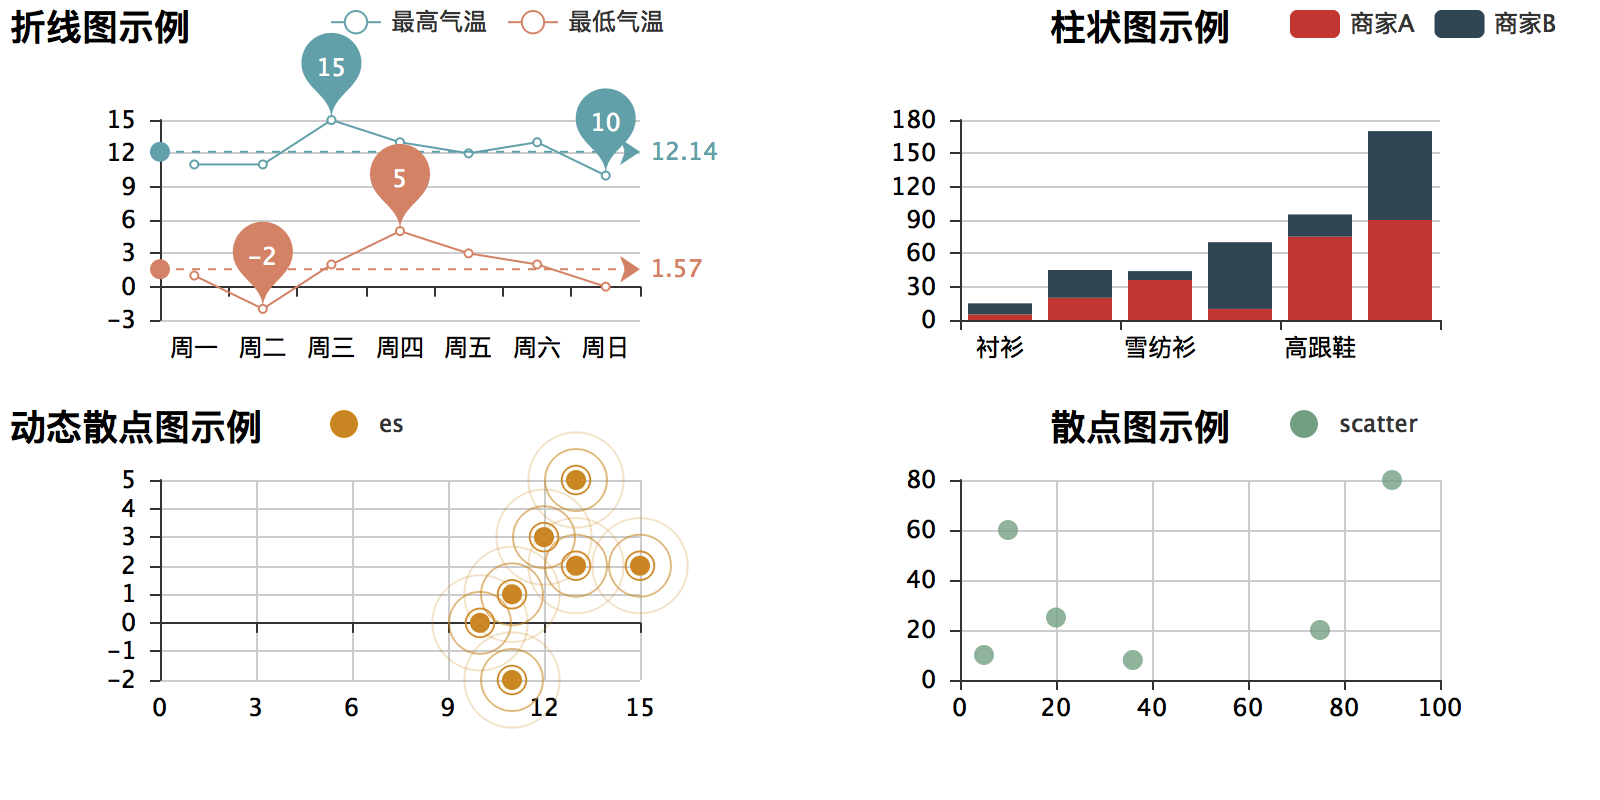
Get pdf:
$ snapshot render.html pdfAnd you will get:
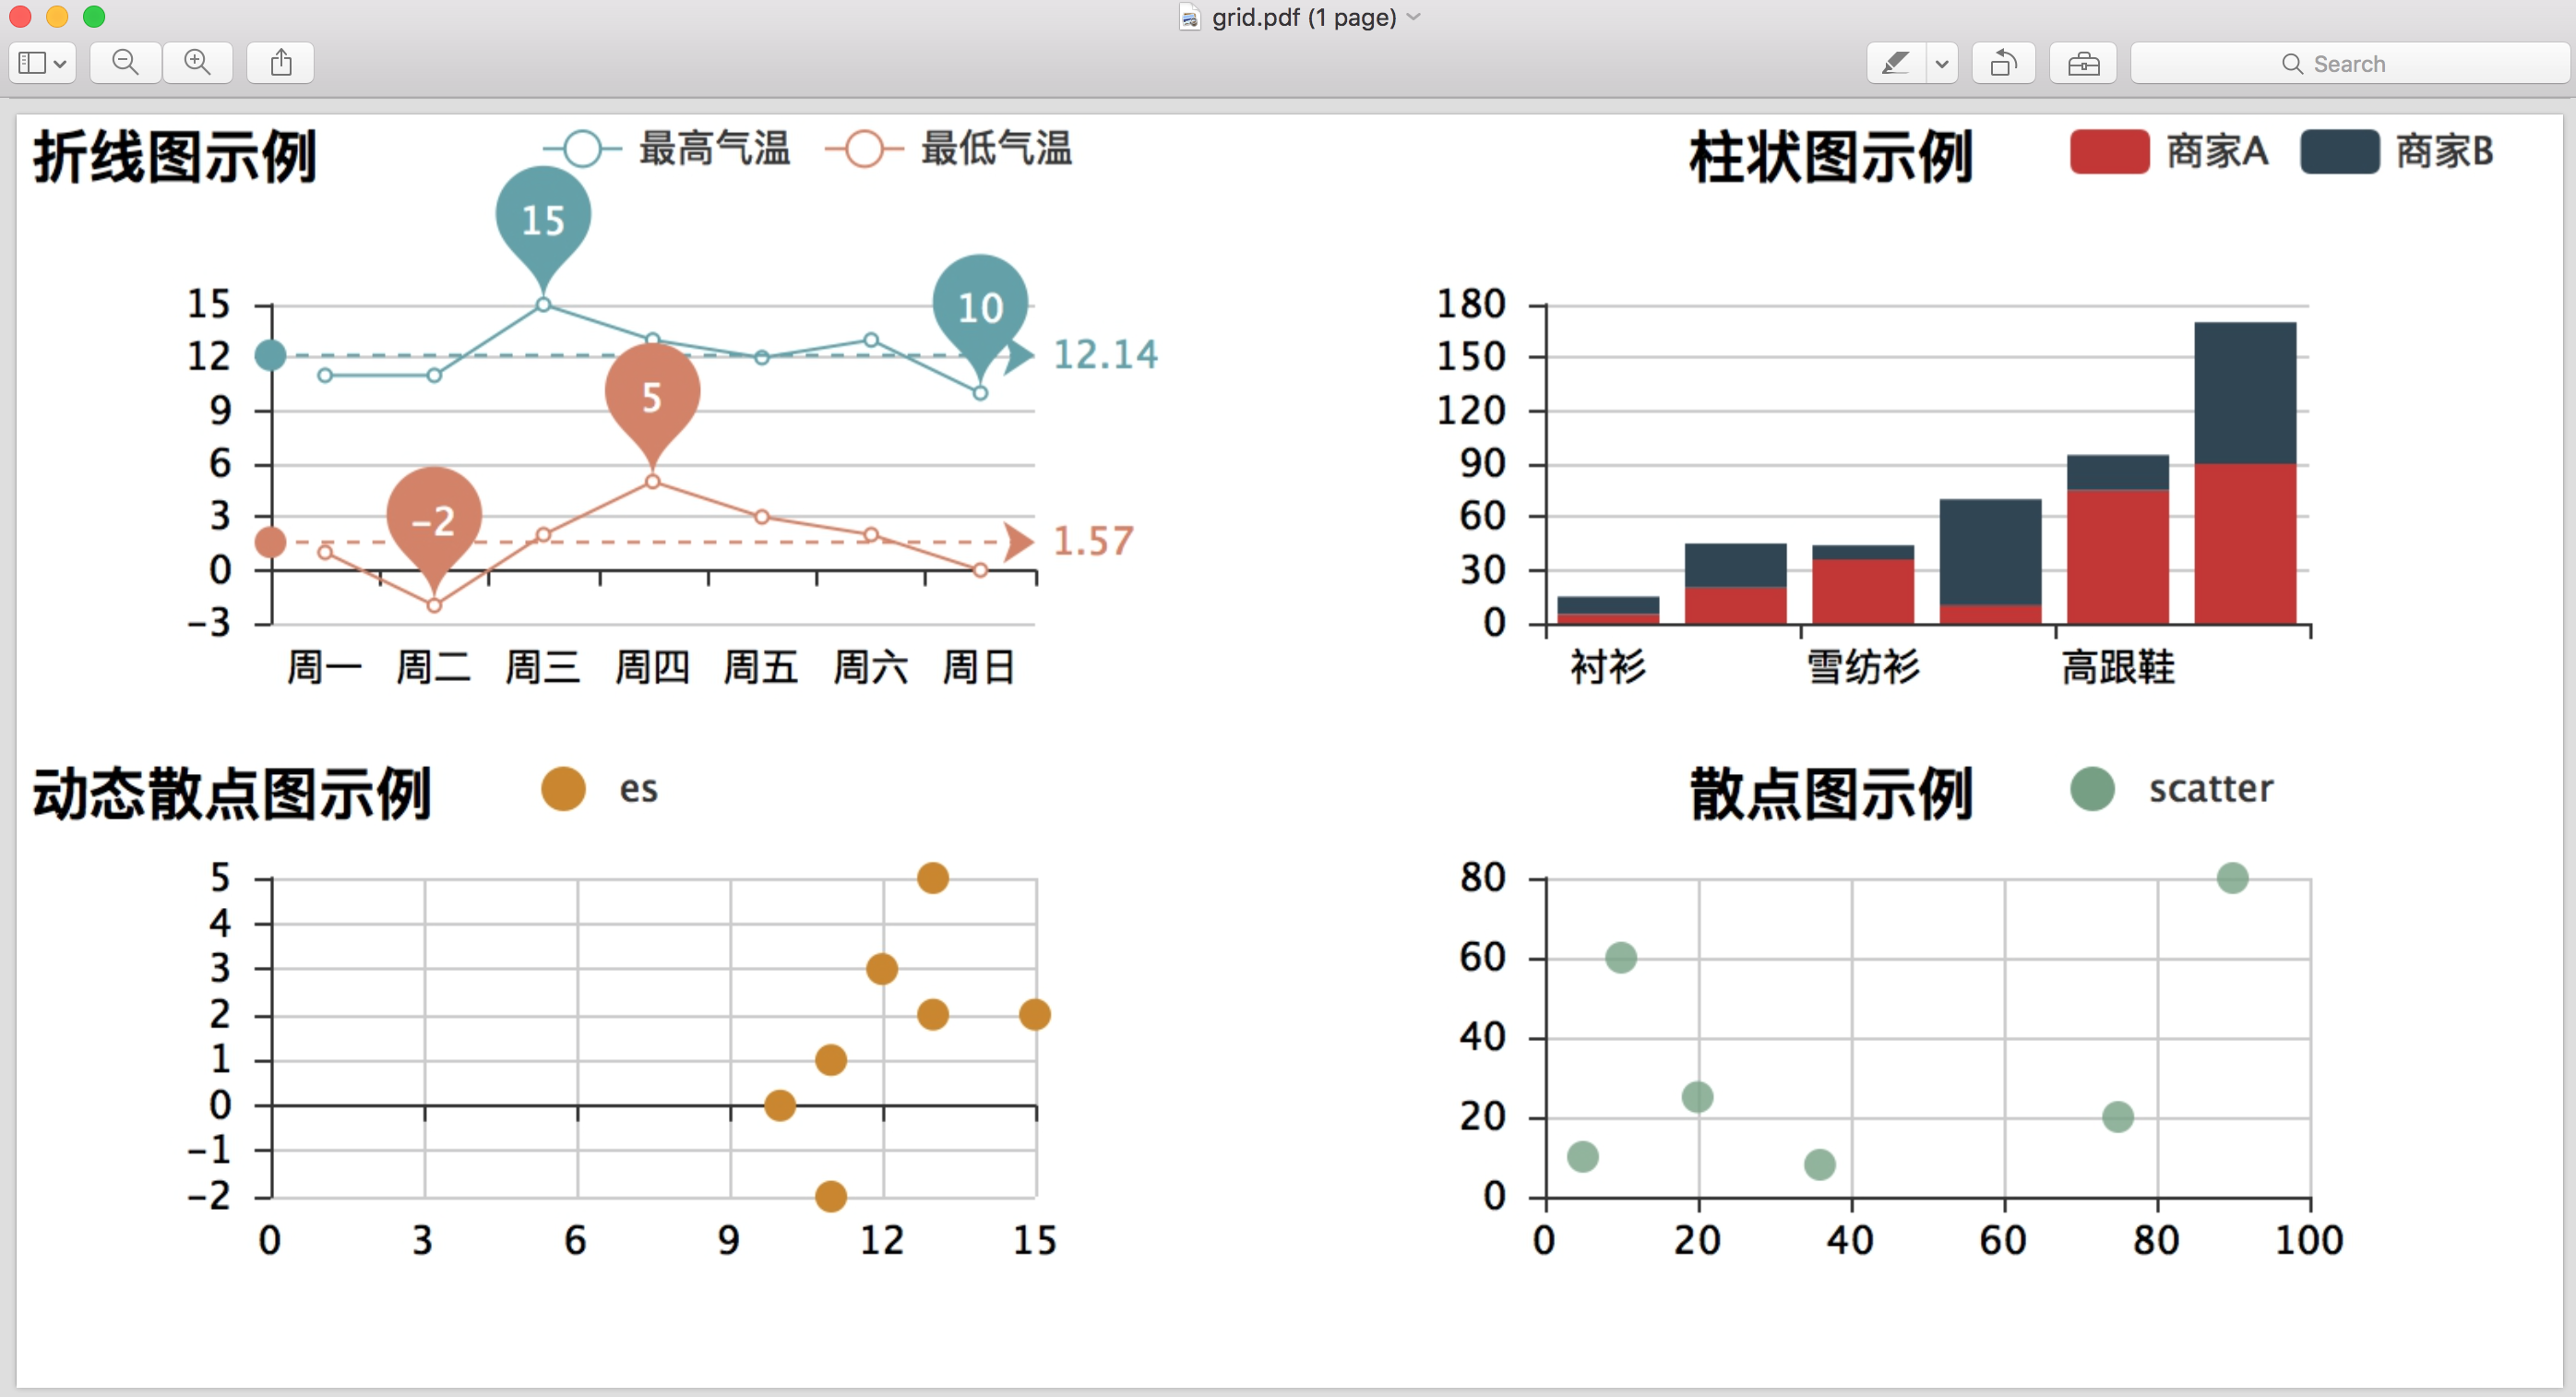
And here the code to generate it
Get svg:
$ snapshot render.html svgPlease be aware that render.html should have configure echarts to do svg rendering. This library, being stupid, does not make canvas rendered image as svg rendered. Here is an example svg file.
Command line options:
$ snapshot output.html [png|jpeg|gif|svg|pdf] [delay] [pixel ratio]where:
delay tells pyecharts-snapshot to take a snapshot after some time measured in seconds. It is needed only when your snapshot is partial because the chart animation takes long than 1.5 second(default). pixel ratio tells pyecharts-snapshot to use a different pixel ratio when generate the image. It defaults to 2.
Programmatical usage is simple:
...
somechart.render(path='cool_snapshot.png')  # delay=1, pixel_ratio=3) 1 second delay, 3 as pixel ratio
where delay as an optional parameter can be given to specify delay_in_seconds.
Please buy me a coffee if you think this library helped.
You can install pyecharts-snapshot via pip:
$ pip install pyecharts-snapshotor clone it and install it:
$ git clone https://github.com/pyecharts/pyecharts-snapshot.git
$ cd pyecharts-snapshot
$ python setup.py install
And you need to do:
$ pyppeteer-installNote
pyppeteer-install is recommended but optional. Your first ever run of snapshot command will invoke pyppeteer-install. This command will download Chrominium, about 100MB
Fully tested on 3.6, 3.7 and 3.8-dev.
Only one image at a time. No 3D image support
- Ghost.Py: very hard to install on my own. Dropped
- install pyecharts-snapshot
- make demo
- take screenshots of grid.pdf and snapshot.pdf in examples folder


