proplot-dev / proplot Goto Github PK
View Code? Open in Web Editor NEW🎨 A succinct matplotlib wrapper for making beautiful, publication-quality graphics
Home Page: https://proplot.readthedocs.io
License: MIT License
🎨 A succinct matplotlib wrapper for making beautiful, publication-quality graphics
Home Page: https://proplot.readthedocs.io
License: MIT License


It seems like some recent commits made native pcolor keywords funky. I'm zoomed in on the California coastline, so I like to usepcolor to keep things high-resolution and display the model grid resolution.
See pcolor doc . I tend to call
ax.pcolor(lon, lat, data, edgecolors='w') to display the grid with white lines.
f, ax = plot.subplots(width='12cm', proj='cyl', basemap=False, tight=False)
ax.set_extent([-140, -110, 20, 50], crs=ccrs.PlateCarree())
ax.pcolor(data.TLONG, data.TLAT, data, edgecolors='w')
The above command used to produce something like this:

It now ignores the call for white edges and displays pcolor as if edgecolors='face':

Now, if I call ax.pcolor(data.TLONG, data.TLAT, data, edgecolors='w', linewidth=0.25) it recognizes due to linewidth the desire for edge lines, although they remain black. (I tried changing plot.rc['patch.edgecolor'] = 'w' with no success.)

Another weird thing to be aware of is that if I don't mention edgecolor, it renders a much sloppier looking edge line (ax.pcolor(data.TLONG, data.TLAT, data, linewidth=0.25))

Perhaps a question, perhaps a feature request. Is there any keyword to add to legend to align the labels by their marker? It seems like it auto-center-aligns by the whole object (marker + label).
E.g.:

I'd much prefer aesthetically if these things were left-aligned by the marker, so that the blue, red, and grey lines all line up.
Currently, ProPlot documentation is generated with my fork of the "automodapi" astropy extension. The fork is published on PyPi under the name sphinxcontrib-automodapi. This is the only way I could get these forks to work with readthedocs, but it's not ideal -- would rather leave the forks unpublished and tailor its needs to ProPlot. I may also need to fork nbsphinx soon.
In the future, ProPlot will use either (1) local sphinx extensions, or (2) unpublished sphinx extension forks under my username. So instead of the line sphinxcontrib-automodapi>=0.5 in docs/requirements.txt, will try tagging my commits and using e.g. git+https://github.com/lukelbd/[email protected].
I'd like to add property cycle support for alternative line-plotting commands, namely stem, step, vlines, and hlines. Since these are just alternatives to simple plot line plots, I think it makes sense for them to use the property cycle.
The implemenation would be similar to how property cycle support is added to Axes.scatter via cycle_wrapper in proplot/wrappers.py.
globe=True doesn't work anymore for me with contourf after this (or maybe before this? I'm not sure). But it fixes the seam on pcolormesh but not contourf right now. I had to manually run the cartopy add_cyclic_point.
I'm not sure how to reproduce this with simple data. It's always a mystery to me which data makes a seam.
Originally posted by @bradyrx in #58 (comment)
@lukelbd, in python3.6 and python3.7 versions, calling e.g. ax.rightpanel.colorbar(m) breaks with the error message:
...

~/anaconda/envs/py37/lib/python3.7/site-packages/matplotlib/colorbar.py in _process_values(self, b)
    818             return
    819         elif isinstance(self.norm, colors.BoundaryNorm):
--> 820             b = list(self.norm.boundaries)
    821             if self._extend_lower():
    822                 b = [b[0] - 1] + b

AttributeError: 'BinNorm' object has no attribute 'boundaries'
This occurs with your showcase code block:
import proplot as plot
import numpy as np
plot.nbsetup()
f, axs = plot.subplots(ncols=3, nrows=2, innercolorbars='r',
                       hspace=0.3, wspace=0.2, aspect=1.2,
                       bspace=0.1)
data = np.random.rand(10,10).cumsum(axis=1)
def show(ax, cmap, gamma):
    m1 = ax.pcolormesh(data, cmap=cmap, cmap_kw={'gamma2':gamma}, levels=10, extend='both')
    ax.rightpanel.colorbar(m1, clocator='none')
    ax.format(title=f'gamma = {gamma}', xlabel='x axis', ylabel='y axis', suptitle='Varying gamma, and demo of new pcolor options')
cmap = 'verdant'
show(axs[0], cmap, 0.8)
show(axs[1], cmap, 1.0)
show(axs[2], cmap, 1.4)
cmap = 'fire'
show(axs[3], cmap, 0.8)
show(axs[4], cmap, 1.0)
show(axs[5], cmap, 1.4)
Note that the error goes away upon using contour or contourf. So it looks like the norm.boundaries attribute doesn't exist (anymore?) in pcolor-related functions.
I think it would be useful to have an export=bool command on plot.Colormap. Currently, save=True just saves it to ~/.proplot/cmaps as a json that seems to be readable to just proplot. It would be great to be able to export it as an xml, hex, etc. to then import into other tools and software.
I think it would be really awesome if users could generate mp4s and gifs by passing arrays with an extra "time" dimension and the keyword arg animate=True to arbitrary plotting functions.
The following approach would allow users to animate stuff in multiple subplots, possibly with multiple plotting commands, simultaneously:
animate=True, anticipate an extra "time" dimension on the input data, and select the first time index for drawing the initial frame. They can pass FuncAnimation keyword args perhaps by using an animation_kw argument.fig.save('animation.gif') (or perhaps something like fig.animate(...)), create an animation by calling the same plotting commands with the same keyword args with successive time slices. This should also make sure the "time dimension" lengths are identical for all arrays passed to plotting commands with animate=True.This is not release critical but seems like such an obvious and useful addition... whenever I have to make animations I have to look up boilerplate code and write code that manually creates and destroys successive artists, which is surely very easy to automate. One difficulty might be allowing users to control how text objects, labels, annotations, legends, etc. are updated with each iteration, but will cross that bridge when we come to it.
Edit: To clarify, the reason I am considering this is ProPlot already standardizes the positional arguments passed to plotting functions with standardize_1d and standardize_2d. So it would be straightforward to have these functions handle a third "animation" dimension.
When either of the width or height dimensions are not passed to the figure, the proplot tight layout algorithm resizes the figure. This means whenever the figure has to be "re-drawn", as with expanding a popup window, the algorithm will try to snap the window back to match the old figure size, resulting in weird/jumpy behavior.
Had two ideas to fix this.
set_size_inches update the underlying geometry_configurator settings (see #50) so that "width" and "height" are both fixed, and also make the axwidth, axheight, and aspect settings modifiable (also rename aspect to axaspect?). Internal calls to set_size_inches can pass a keyword arg like lock=False that prevents updating geometry settings.Leaning towards 2. Also, while I'm at it, I can also do a more rigorous test of how automatic figure resizing interacts with the various backends.
I think after 77f2b71, this issue arose.
Previously, one could do something like:
import numpy as np
import proplot as plot
% import cartopy.crs as ccrs

data = np.random.rand(180, 360)
lats = np.linspace(-89.5, 89.5, 180)
lons = np.linspace(-179.5, 179.5, 360)

f, ax = plot.subplots(proj='robin')

ax.pcolormesh(lons, lats, data)
and you'd get the map. Now it's showing up blank and requires ax.pcolormesh(lons, lats, data, transform=ccrs.PlateCarree()). Maybe minor but a nice thing to not have to worry about with proplot.
Currently, contributors cannot add examples. I generate examples from a big ipython notebook and convert them to RST with a shell script that calls nbconvert and does some regex magic to repair RST-style Sphinx module links embedded in the Markdown notebook cells (e.g. by default, nbconvert turns `~proplot.subplots.Figure` into ``~proplot.subplots.Figure``). This workflow also requires that every cell has already been executed, but committing cells with executed output is bad practice IMO -- ProPlot currently does not track or push cell output, thanks to nbstripout commands I've added to .git/info/attributes (see nbstripout for details).
In the near future, I need to commit the example notebook, use nbsphinx to automatically run each cell instead of running the cells manually myself, and configure nbsphinx with a formal nbconvert template/filter that repairs the links.
Alternatively, I may fork nbsphinx and implement this manually. Then I could add both my fork of sphinx-automodapi and nbsphinx as submodules inside proplot.
Is there any straight forward way to stride through what tick labels are shown in cartopy? Or could this be added as a feature?
This would be the equivalent of having xticks=[0,5,10,15,20] + xticklabels=['0', '', '10', '', '20'] for instance. The idea here is especially in longitude when labels get packed and overlapped at a reasonable font size for folks to see.
import numpy as np
import proplot as plot

plot.rc['geogrid.linestyle'] = ':'
plot.rc['geogrid.linewidth'] = 2
plot.rc['geogrid.color'] = '#d3d3d3'

data = np.random.rand(90, 180)
lon = np.linspace(-179.5, 179.5, 180)
lat = np.linspace(-89.5, 89.5, 90)

f, ax = plot.subplots(width='12cm', aspect=4, proj='cyl', tight=True,)

p = ax.pcolormesh(lon, lat, data, )

ax.format(latlim=(20,50), lonlim=(-135, -105), land=True,
          latlines=plot.arange(20,50,5), lonlines=plot.arange(-135,-105, 5),
          labels=True)

ax.colorbar(p, loc='r')
This case doesn't have any issues, but imagine if you wanted the label size to be 14, 16, or 18 point font for a poster. All the lon labels overlap. Any way to show just 130W, 120W, 110W but maintain the grid structure? I figure there's a means to do it with the formatter/ticker, but I can't figure it out..
For some reason, it seems like the zorder layer of the grid lines added to a map projection is really high. I.e, they are prioritized to be layered on top of most other things. This is being prioritized here I think:
Perhaps there can be an rc config option called proplot.rc['geogrid.zorder'] or something like that. Here's what happens currently with the default:
import proplot as plot
plot.rc['land.color'] = '#d3d3d3'

f, ax = plot.subplots(proj='spstere')

ax.text(0, 0, 'test', color='k')

ax.format(land=True, boundinglat=-40)
And how I have to hack it so my continents are above my grid lines and my text doesn't get contaminated:
import cartopy.feature as cfeature
f, ax = plot.subplots(proj='spstere')

ax.add_feature(cfeature.LAND, color='#d3d3d3', zorder=5)
ax.text(0, 0, 'test', color='k', zorder=6)

ax.format(boundinglat=-40)
The plot.plot() command is currently not interpreting datetimes correctly and is instead plotting in the "days since 0000 ..." units.
import numpy as np
dat = np.random.rand(612,)
time = np.arange('1964-01', '2015-01', dtype='datetime64[M]')
# proplot
f, ax = plot.subplots(axwidth=5, aspect=4)
ax.plot(time, dat)
# matplotlib
f, ax = plt.subplots(figsize=(6,2))
ax.plot(time, dat)
proplot version:

matplotlib version:

With the most recent commit, trying to set a string width in metric (e.g., "10cm") does not work.

These types of plots are very popular -- where bars are one color for positive data, and another color for negative data. Example:

Something similar is already implemented for fill_between and fill_betweenx (a.k.a. area and areax) via fill_between_wrapperin proplot/wrappers.py.
This could be implemented with a simple override of bar_wrapper.
For consistency with the matplotlib API, all of the features implemented in self.format() should be implemented with setters and getters, then the axes can be updated with native Artist.update or Artist.set methods. Also, Axes.format will redirect to update and issue a deprecation warning.
Here is some background:
Artist classes, including the Axes class.Artist.set and Artist.update methods for bulk updating arbitrary artists. Example usage: If an artist has set_linewidth and set_linestyle methods, then update and set will accept linewidth and linestyle as keyword args and pass them to the setter.Artist.update and Artist.set are:Axes artists), (2) they appear seldom in the examples, and (3) there is no artist-specific documentation on keyword arguments accepted by these methods, since they work by searching for arbtirary setters with getattr(self, 'set_' + key), so only advanced users will learn how to use them.I think it is important for users to be able to modify arbitrary properties of python classes in place without a "bulk" function. However, it is also important for the sake of efficiency that users have this "bulk" function, and they should be encouraged to use the "bulk" one in the first place.
Where ProPlot can improve this is by documenting the "bulk" function by scanning the Axes attributes and building a numpydoc-style parameter table from the first line of every setter, and allowing people to pass keyword args to arbitrary setters with {setting}_kw-style arguments. Every ProPlot example will still use the bulk updater to encourage this for new users.
A more bold option could be to monkey patch the matplotlib Artist class, overriding its set and update methods so that every artist is documented like this. But I think the PR will just start with axes.
I just learned about this nice wrapper, but for me it takes too long to plot large xr.dataarray's.
I make the call
control3d.isel(time=1).plot()
and then after one second this appears as should
<matplotlib.collections.QuadMesh at 0x1c203e94a8>
and then it takes around one minute for the plot to appear. It's a (time: 1, x: 256, y: 220) dataarray of 1.35MB.
When I use hydrogen inside the atom editor it works like a charm (fast).
aaron.spring@d147-139:~$ conda list
# packages in environment at /Users/aaron.spring/anaconda3:
#
# Name Version Build Channel
_ipyw_jlab_nb_ext_conf 0.1.0 py36_0
alabaster 0.7.12 py_0 conda-forge
altair 2.3.0 py36_1001 conda-forge
anaconda custom py36ha4fed55_0
anaconda-client 1.7.1 py_0 conda-forge
anaconda-navigator 1.9.6 py36_0
anaconda-project 0.8.2 py_1 conda-forge
appdirs 1.4.3 <pip>
appnope 0.1.0 py36_1000 conda-forge
appscript 1.0.1 py36h470a237_0 conda-forge
asn1crypto 0.24.0 py36_1003 conda-forge
astroid 2.1.0 py36_1000 conda-forge
astropy 3.1 py36h470a237_0 conda-forge
atomicwrites 1.2.1 py_0 conda-forge
attrs 18.2.0 py_0 conda-forge
autopep8 1.4.1 py_0 conda-forge
babel 2.6.0 py_1 conda-forge
backcall 0.1.0 py_0 conda-forge
backports 1.0 py_2 conda-forge
backports.shutil_get_terminal_size 1.0.0 py_3 conda-forge
beautifulsoup4 4.6.3 py36_1000 conda-forge
bitarray 0.8.3 py36h470a237_0 conda-forge
bkcharts 0.2 py36_0 conda-forge
black 18.9b0 <pip>
blas 1.0 mkl
blaze 0.11.3 py36_0 conda-forge
bleach 3.0.1 py_0 conda-forge
blinker 1.4 py_1 conda-forge
blosc 1.14.4 hfc679d8_0 conda-forge
bokeh 1.0.2 py36_1000 conda-forge
boost-cpp 1.67.0 h3a22d5f_0 conda-forge
boto 2.49.0 py36_0
boto3 1.9.20 py_0 conda-forge
botocore 1.12.20 py_0 conda-forge
bottleneck 1.2.1 py36h7eb728f_1 conda-forge
branca 0.3.0 py_0 conda-forge
bz2file 0.98 py_0 conda-forge
bzip2 1.0.6 1 conda-forge
ca-certificates 2018.11.29 ha4d7672_0 conda-forge
cairo 1.14.12 he6fea26_5 conda-forge
cartopy 0.17.0 py36h81b52dc_0 conda-forge
cdo 1.9.5 h249571a_5 conda-forge
certifi 2018.11.29 py36_1000 conda-forge
cffi 1.11.5 py36h5e8e0c9_1 conda-forge
cftime 1.0.3.4 py36h7eb728f_0 conda-forge
chardet 3.0.4 py36_1003 conda-forge
cite2c 0.2.1 <pip>
clangdev 6.0.1 default_1 conda-forge
click 7.0 py_0 conda-forge
click-plugins 1.0.4 py_0 conda-forge
cligj 0.5.0 py_0 conda-forge
cloudpickle 0.6.0 py_0 conda-forge
clyent 1.2.2 py_1 conda-forge
cmocean 1.2 py_0 conda-forge
colorama 0.3.9 py_1 conda-forge
conda 4.5.12 py36_1000 conda-forge
conda-build 3.17.5 py36_0 conda-forge
conda-env 2.6.0 1 conda-forge
conda-verify 3.1.1 py36_1000 conda-forge
contextlib2 0.5.5 py_2 conda-forge
cryptography 2.2.1 py36hdffb7b8_1 conda-forge
cryptography-vectors 2.4.2 py_1000 conda-forge
curl 7.61.1 h74213dd_2 conda-forge
cycler 0.10.0 <pip>
cycler 0.10.0 py_1 conda-forge
cython 0.29.2 py36hfc679d8_0 conda-forge
cytoolz 0.9.0.1 py36h470a237_1 conda-forge
dask 1.0.0 py_0 conda-forge
dask-core 1.0.0 py_0 conda-forge
datashape 0.5.4 py36_0 conda-forge
dbus 1.13.0 h3a4f0e9_0 conda-forge
decorator 4.3.0 py_0 conda-forge
descartes 1.1.0 py_2 conda-forge
distributed 1.25.1 py36_1000 conda-forge
docutils 0.14 py36_1001 conda-forge
eccodes 2.9.2 hc15e6af_1 conda-forge
entrypoints 0.2.3 py36_1002 conda-forge
eofs 1.3.0 py_1 conda-forge
esmf 7.1.0r h35eb876_3 conda-forge
esmpy 7.1.0r py36_1 conda-forge
et_xmlfile 1.0.1 py36_1000 conda-forge
expat 2.2.5 hfc679d8_2 conda-forge
fastcache 1.0.2 py36h470a237_1 conda-forge
fftw 3.3.8 h470a237_1 conda-forge
filelock 3.0.9 py_0 conda-forge
fiona 1.7.13 py36hb00a9d7_4 conda-forge
flake8 3.5.0 py36_1000 conda-forge
flask 1.0.2 py_2 conda-forge
flask-cors 3.0.6 py_0 conda-forge
folium 0.6.0 py_0 conda-forge
fontconfig 2.13.1 hce039c3_0 conda-forge
freetype 2.9.1 h6debe1e_4 conda-forge
freexl 1.0.5 h470a237_2 conda-forge
future 0.17.0 py36_1000 conda-forge
gdal 2.2.4 py36hb00a9d7_10 conda-forge
gensim 3.4.0 py36h1de35cc_0
geographiclib 1.49 py_0 conda-forge
geopandas 0.4.0 py_1 conda-forge
geopy 1.17.0 py_0 conda-forge
geos 3.6.2 hfc679d8_3 conda-forge
geotiff 1.4.2 h700e5ad_4 conda-forge
get_terminal_size 1.0.0 h7520d66_0
gettext 0.19.8.1 h1f1d5ed_1 conda-forge
gevent 1.3.7 py36h470a237_0 conda-forge
giflib 5.1.4 h470a237_1 conda-forge
gitdb2 2.0.5 <pip>
GitPython 2.1.11 <pip>
glib 2.55.0 h464dc38_2 conda-forge
glob2 0.6 py_0 conda-forge
gmp 6.1.2 hfc679d8_0 conda-forge
gmpy2 2.0.8 py36hb705a9b_2 conda-forge
greenlet 0.4.13 py36_0 conda-forge
h5netcdf 0.6.2 py_0 conda-forge
h5py 2.8.0 py36h097b052_4 conda-forge
hdf4 4.2.13 h951d187_2 conda-forge
hdf5 1.10.3 hc401514_2 conda-forge
heapdict 1.0.0 py36_1000 conda-forge
holoviews 1.10.9 py_0 pyviz
html5lib 1.0.1 py_0 conda-forge
hvplot 0.2.1 py_0 pyviz
icu 58.2 hfc679d8_0 conda-forge
idna 2.8 py36_1000 conda-forge
imageio 2.3.0 py_1 conda-forge
imagesize 1.1.0 py_0 conda-forge
intel-openmp 2019.0 118
ipykernel 5.1.0 py36h24bf2e0_1001 conda-forge
ipyleaflet 0.8.1 py36_0 conda-forge
ipython 7.2.0 py36h24bf2e0_1000 conda-forge
ipython_genutils 0.2.0 py_1 conda-forge
ipywidgets 7.4.2 py_0 conda-forge
isort 4.3.4 py36_1000 conda-forge
itsdangerous 0.24 py_2 conda-forge
jasper 1.900.1 hff1ad4c_5 conda-forge
jbig 2.1 h470a237_1001 conda-forge
jdcal 1.4 py_1 conda-forge
jedi 0.13.2 py36_1000 conda-forge
jinja2 2.10 py_1 conda-forge
jmespath 0.9.3 py_1 conda-forge
jpeg 9c h470a237_1 conda-forge
json-c 0.12.1 h470a237_1 conda-forge
jsonschema 3.0.0a3 py36_1000 conda-forge
jupyter 1.0.0 py_1 conda-forge
jupyter-kernel-gateway 2.1.0 <pip>
jupyter_client 5.2.3 py_1 conda-forge
jupyter_console 6.0.0 py_0 conda-forge
jupyter_contrib_core 0.3.3 py_2 conda-forge
jupyter_contrib_nbextensions 0.5.0 py36_1000 conda-forge
jupyter_core 4.4.0 py_0 conda-forge
jupyter_highlight_selected_word 0.2.0 py36_1000 conda-forge
jupyter_latex_envs 1.4.4 py36_1000 conda-forge
jupyter_nbextensions_configurator 0.4.0 py36_1000 conda-forge
jupyterlab 0.34.12 py36_1000 conda-forge
jupyterlab-github 0.6.1 <pip>
jupyterlab_launcher 0.13.1 py_2 conda-forge
jupyterlab_server 0.2.0 py_0 conda-forge
jupyterthemes 0.19.6 <pip>
kealib 1.4.10 hb88cf67_0 conda-forge
keyring 17.0.0 py36_1000 conda-forge
kiwisolver 1.0.1 <pip>
kiwisolver 1.0.1 py36h2d50403_2 conda-forge
krb5 1.16.1 hbb41f41_0 conda-forge
lazy-object-proxy 1.3.1 py36h470a237_0 conda-forge
lesscpy 0.13.0 <pip>
libaec 1.0.2 hfc679d8_1 conda-forge
libarchive 3.3.3 h823be47_0 conda-forge
libcurl 7.61.1 hbdb9355_2 conda-forge
libcxx 6.0.1 0 conda-forge
libcxxabi 4.0.1 hebd6815_0
libdap4 3.19.1 h18059cb_1 conda-forge
libedit 3.1.20170329 haf1bffa_1 conda-forge
libffi 3.2.1 hfc679d8_5 conda-forge
libgdal 2.2.4 hd83b57f_10 conda-forge
libgfortran 3.0.1 h93005f0_2
libiconv 1.15 h470a237_3 conda-forge
libkml 1.3.0 hccc92b1_8 conda-forge
liblief 0.9.0 h2a1bed3_0
libnetcdf 4.6.1 h350cafa_11 conda-forge
libopenblas 0.3.3 hdc02c5d_3
libpng 1.6.35 ha92aebf_2 conda-forge
libpq 10.5 hf16a0db_0 conda-forge
libsodium 1.0.16 h470a237_1 conda-forge
libspatialindex 1.8.5 hfc679d8_3 conda-forge
libspatialite 4.3.0a h3b29d86_23 conda-forge
libssh2 1.8.0 h5b517e9_2 conda-forge
libtiff 4.0.9 he6b73bb_2 conda-forge
libxml2 2.9.8 h422b904_5 conda-forge
libxslt 1.1.32 h88dbc4e_2 conda-forge
llvm-meta 6.0.1 0 conda-forge
llvmdev 6.0.1 h2d50403_2 conda-forge
llvmlite 0.26.0 py36h3fea490_1000 conda-forge
locket 0.2.0 py_2 conda-forge
lxml 4.2.5 py36hc9114bc_0 conda-forge
lzo 2.10 0 conda-forge
markupsafe 1.1.0 py36h470a237_0 conda-forge
matplotlib 3.0.0 <pip>
matplotlib 3.0.2 py36_1 conda-forge
matplotlib-base 3.0.2 py36hb2d221d_1 conda-forge
mccabe 0.6.1 py_1 conda-forge
mistune 0.8.4 py36h470a237_0 conda-forge
mkl 2018.0.3 1
mkl-service 1.1.2 py36h6b9c3cc_5
mkl_fft 1.0.10 py36_0 conda-forge
mkl_random 1.0.2 py36_0 conda-forge
more-itertools 4.3.0 py36_1000 conda-forge
mpc 1.1.0 hb705a9b_6 conda-forge
mpfr 4.0.1 h16a7912_0 conda-forge
mpi 1.0 mpich conda-forge
mpich 3.2.1 h26a2512_7 conda-forge
mpmath 1.0.0 py_1 conda-forge
msgpack-python 0.6.0 py36h2d50403_0 conda-forge
multipledispatch 0.6.0 py_0 conda-forge
munch 2.3.2 py_0 conda-forge
navigator-updater 0.2.1 py36_0
nbconvert 5.3.1 py_1 conda-forge
nbdime 1.0.3 <pip>
nbformat 4.4.0 py_1 conda-forge
ncurses 6.1 hfc679d8_1 conda-forge
netcdf-fortran 4.4.4 h71ea97b_10 conda-forge
netcdf4 1.4.2 py36hac939d9_0 conda-forge
networkx 2.2 py_1 conda-forge
nltk 3.2.5 py_0 conda-forge
nodejs 10.8.0 hfc679d8_1 conda-forge
nose 1.3.7 py36_1002 conda-forge
notebook 5.7.4 py36_1000 conda-forge
notebook 5.6.0 <pip>
numba 0.41.0 py36hf8a1672_0 conda-forge
numexpr 2.6.8 py36hf8a1672_0 conda-forge
numpy 1.15.4 py36h6a91979_0
numpy-base 1.15.4 py36h8a80b8c_0
numpydoc 0.8.0 py_1 conda-forge
oauthlib 2.1.0 py_0 conda-forge
odo 0.5.1 py_1 conda-forge
olefile 0.46 py_0 conda-forge
openblas 0.2.20 8 conda-forge
openjpeg 2.3.0 h316dc23_3 conda-forge
openpyxl 2.5.8 py_0 conda-forge
openssl 1.0.2p h1de35cc_1002 conda-forge
osmnx 0.8.2 py_0 conda-forge
ossuuid 1.6.2 hfc679d8_0 conda-forge
owslib 0.17.0 py_0 conda-forge
packaging 18.0 py_0 conda-forge
pandas 0.23.4 py36hf8a1672_0 conda-forge
pandas-datareader 0.7.0 <pip>
pandoc 2.3.1 0 conda-forge
pandocfilters 1.4.2 py_1 conda-forge
param 1.8.1 py_0 pyviz
parso 0.3.1 py_0 conda-forge
partd 0.3.8 py_1 conda-forge
path.py 11.0.1 py_0 conda-forge
pathlib2 2.3.3 py36_1000 conda-forge
patsy 0.5.0 py_1 conda-forge
pcre 8.41 hfc679d8_3 conda-forge
pep8 1.7.1 py_0 conda-forge
pexpect 4.6.0 py36_1000 conda-forge
pickleshare 0.7.5 py36_1000 conda-forge
pillow 5.3.0 py36hc736899_0 conda-forge
pip 18.1 <pip>
pip 18.1 py36_1000 conda-forge
pixman 0.34.0 h470a237_3 conda-forge
pkginfo 1.4.2 py_1 conda-forge
pluggy 0.7.1 py_0 conda-forge
ply 3.11 py_1 conda-forge
PMMPIESM 0.1 <pip>
poppler 0.67.0 h4d7e492_3 conda-forge
poppler-data 0.4.9 0 conda-forge
postgresql 10.5 ha408888_0 conda-forge
proj4 4.9.3 h470a237_8 conda-forge
prometheus-client 0.3.1 <pip>
prometheus_client 0.4.1 py_0 conda-forge
prompt_toolkit 2.0.5 py_0 conda-forge
proplot 1.0 <pip>
psutil 5.4.8 py36h470a237_0 conda-forge
psycopg2 2.7.6.1 py36hdffb7b8_0 conda-forge
ptyprocess 0.6.0 py36_1000 conda-forge
py 1.6.0 py_0 conda-forge
py-lief 0.9.0 py36hd4eaf27_0
pycodestyle 2.4.0 py_1 conda-forge
pycosat 0.6.3 py36h470a237_1 conda-forge
pycparser 2.19 py_0 conda-forge
pycrypto 2.6.1 py36h470a237_2 conda-forge
pycurl 7.43.0.2 py36hdbc3d79_0
pydocstyle 3.0.0 <pip>
pyepsg 0.3.2 py_1 conda-forge
pyfinance 1.1.1 <pip>
pyflakes 1.6.0 py_1 conda-forge
pygments 2.2.0 py_1 conda-forge
pyjwt 1.6.4 py_0 conda-forge
pykdtree 1.3.1 py36h7eb728f_2 conda-forge
pylint 2.2.2 py36_1000 conda-forge
pyodbc 4.0.25 py36hfc679d8_0 conda-forge
pyopenssl 18.0.0 py36_1000 conda-forge
pyparsing 2.3.0 <pip>
pyparsing 2.2.2 py_0 conda-forge
pyproj 1.9.5.1 py36h508ed2a_6 conda-forge
pyqt 5.6.0 py36h8210e8a_8 conda-forge
pyrsistent 0.14.8 py36h470a237_0 conda-forge
pysal 1.14.4.post2 py36_1001 conda-forge
pyshp 1.2.12 py_0 conda-forge
pysocks 1.6.8 py36_1002 conda-forge
pytables 3.4.4 py36h55d7349_3 conda-forge
pytest 4.0.2 py36_1000 conda-forge
pytest-arraydiff 0.2 py_0 conda-forge
pytest-astropy 0.4.0 py_0 conda-forge
pytest-doctestplus 0.1.3 py_0 conda-forge
pytest-openfiles 0.3.0 py_0 conda-forge
pytest-remotedata 0.3.0 py_0 conda-forge
python 3.6.6 h5001a0f_0 conda-forge
python-cdo 1.4.0 py_1 conda-forge
python-crfsuite 0.9.6 py36h2d50403_0 conda-forge
python-dateutil 2.7.5 <pip>
python-dateutil 2.7.3 py_0 conda-forge
python-jsonrpc-server 0.0.2 <pip>
python-language-server 0.21.2 <pip>
python-libarchive-c 2.8 py36_1004 conda-forge
python.app 1.2 py36h470a237_200 conda-forge
pytz 2018.7 <pip>
pytz 2018.5 py_0 conda-forge
pyviz_comms 0.6.0 py_0 pyviz
pywavelets 1.0.1 py36h7eb728f_0 conda-forge
pyyaml 3.13 py36h470a237_1 conda-forge
pyzmq 17.1.2 py36hae99301_1 conda-forge
pyzmq 17.1.2 <pip>
qt 5.6.2 hd4c90f3_9 conda-forge
qtawesome 0.5.1 pyh8a2030e_1 conda-forge
qtconsole 4.4.3 py_0 conda-forge
qtpy 1.5.1 pyh8a2030e_0 conda-forge
rauth 0.7.3 <pip>
readline 7.0 haf1bffa_1 conda-forge
requests 2.21.0 py36_1000 conda-forge
requests 2.19.1 <pip>
requests-oauthlib 1.0.0 py_1 conda-forge
rope 0.10.7 py_1 conda-forge
rtree 0.8.3 py36_1000 conda-forge
ruamel_yaml 0.15.71 py36h470a237_0 conda-forge
s3transfer 0.1.13 py36_1001 conda-forge
scikit-image 0.14.1 py36hfc679d8_1 conda-forge
scikit-learn 0.20.1 py36h4f467ca_0
scipy 1.1.0 py36h28f7352_1
seaborn 0.9.0 <pip>
seaborn 0.9.0 py_0 conda-forge
send2trash 1.5.0 py_0 conda-forge
setuptools 40.6.3 py36_0 conda-forge
shapely 1.6.4 py36h164cb2d_1 conda-forge
simplegeneric 0.8.1 py_1 conda-forge
singledispatch 3.4.0.3 py36_1000 conda-forge
sip 4.18.1 py36hfc679d8_0 conda-forge
six 1.12.0 py36_1000 conda-forge
smart_open 1.7.1 py_0 conda-forge
smmap2 2.0.5 <pip>
snakeviz 1.0.0 <pip>
snowballstemmer 1.2.1 py_1 conda-forge
sortedcollections 1.0.1 py_1 conda-forge
sortedcontainers 2.0.5 py_0 conda-forge
sphinx 1.8.2 py36_1000 conda-forge
sphinxcontrib 1.0 py36_1
sphinxcontrib-websupport 1.1.0 py_1 conda-forge
spyder 3.3.2 py36_1001 conda-forge
spyder-kernels 0.2.6 py_1 conda-forge
sqlalchemy 1.2.15 py36h470a237_0 conda-forge
sqlite 3.26.0 hb1c47c0_0 conda-forge
statsmodels 0.9.0 py36h7eb728f_0 conda-forge
sympy 1.3 py36_1000 conda-forge
tblib 1.3.2 py_1 conda-forge
terminado 0.8.1 py36_1001 conda-forge
testpath 0.4.2 py36_1000 conda-forge
tk 8.6.8 ha92aebf_0 conda-forge
toml 0.10.0 <pip>
toolz 0.9.0 py_1 conda-forge
tornado 5.1.1 py36h470a237_0 conda-forge
tqdm 4.26.0 py_0 conda-forge
traitlets 4.3.2 py36_1000 conda-forge
traittypes 0.2.1 py_1 conda-forge
twython 3.7.0 py_0 conda-forge
typed-ast 1.1.1 py36h470a237_0 conda-forge
typing 3.6.4 py36_0 conda-forge
udunits2 2.2.27.6 h3a4f0e9_1 conda-forge
unicodecsv 0.14.1 py_1 conda-forge
unixodbc 2.3.7 h09ba92c_0 conda-forge
urllib3 1.23 py36_1001 conda-forge
vincent 0.4.4 py_1 conda-forge
wcwidth 0.1.7 py_1 conda-forge
webencodings 0.5.1 py_1 conda-forge
werkzeug 0.14.1 py_0 conda-forge
wheel 0.32.3 py36_0 conda-forge
widgetsnbextension 3.4.2 py36_1000 conda-forge
wrapt 1.10.11 py36h470a237_1 conda-forge
xarray 0.11.2 py36_1000 conda-forge
xerces-c 3.2.0 h5d6a6da_2 conda-forge
xesmf 0.1.1 py36_0 conda-forge
xlrd 1.1.0 py_2 conda-forge
xlsxwriter 1.1.1 py_0 conda-forge
xlwings 0.15.1 py36_0 conda-forge
xlwt 1.3.0 py_1 conda-forge
xmltodict 0.11.0 <pip>
xz 5.2.4 h470a237_1 conda-forge
yaml 0.1.7 h470a237_1 conda-forge
yapf 0.24.0 <pip>
zeromq 4.2.5 hfc679d8_5 conda-forge
zict 0.1.3 py_0 conda-forge
zlib 1.2.11 h470a237_3 conda-forge
A "Minimal, Complete and Verifiable Example" will make it much easier for maintainers to help you.
import pandas as pd
import xarray as xr
import numpy as np


def drop_nans_and_flatten(dataArray: xr.DataArray) -> np.ndarray:
    """flatten the array and drop nans from that array. Useful for plotting histograms.

    Arguments:
    ---------
    : dataArray (xr.DataArray)
        the DataArray of your value you want to flatten
    """
    # drop NaNs and flatten
    return dataArray.values[~np.isnan(dataArray.values)]


# create dimensions of xarray object
times = pd.date_range(start='1981-01-31', end='2019-04-30', freq='M')
lat = np.linspace(0, 1, 224)
lon = np.linspace(0, 1, 176)

rand_arr = np.random.randn(len(times), len(lat), len(lon))

# create xr.Dataset
coords = {'time': times, 'lat':lat, 'lon':lon}
dims = ['time', 'lat', 'lon']
ds = xr.Dataset({'precip': (dims, rand_arr)}, coords=coords)
ds['month'], ds['year'] = ds['time.month'], ds['time.year']
Making plot using proplot
import proplot as plot
import calendar

f, axs = plot.subplots(nrows=4, ncols=3, axwidth=1.5, figsize=(8,12), share=2) # share=3, span=1,
axs.format(
    xlabel='Precip', ylabel='Density', suptitle='Distribution',
)

month_abbrs = list(calendar.month_abbr)
mean_ds = ds.groupby('time.month').mean(dim='time')
flattened = []
for mth in np.arange(1, 13):
    ax = axs[mth - 1]
    ax.set_title(month_abbrs[mth])
    print(f"Plotting {month_abbrs[mth]}")
    flat = drop_nans_and_flatten(mean_ds.sel(month=mth).precip)
    flattened.append(flat)
sns.distplot(flat, ax=ax, **{'kde': False})This should explain why the current behavior is a problem and why the expected result is a better solution.
The proplot returns a plot like follows:
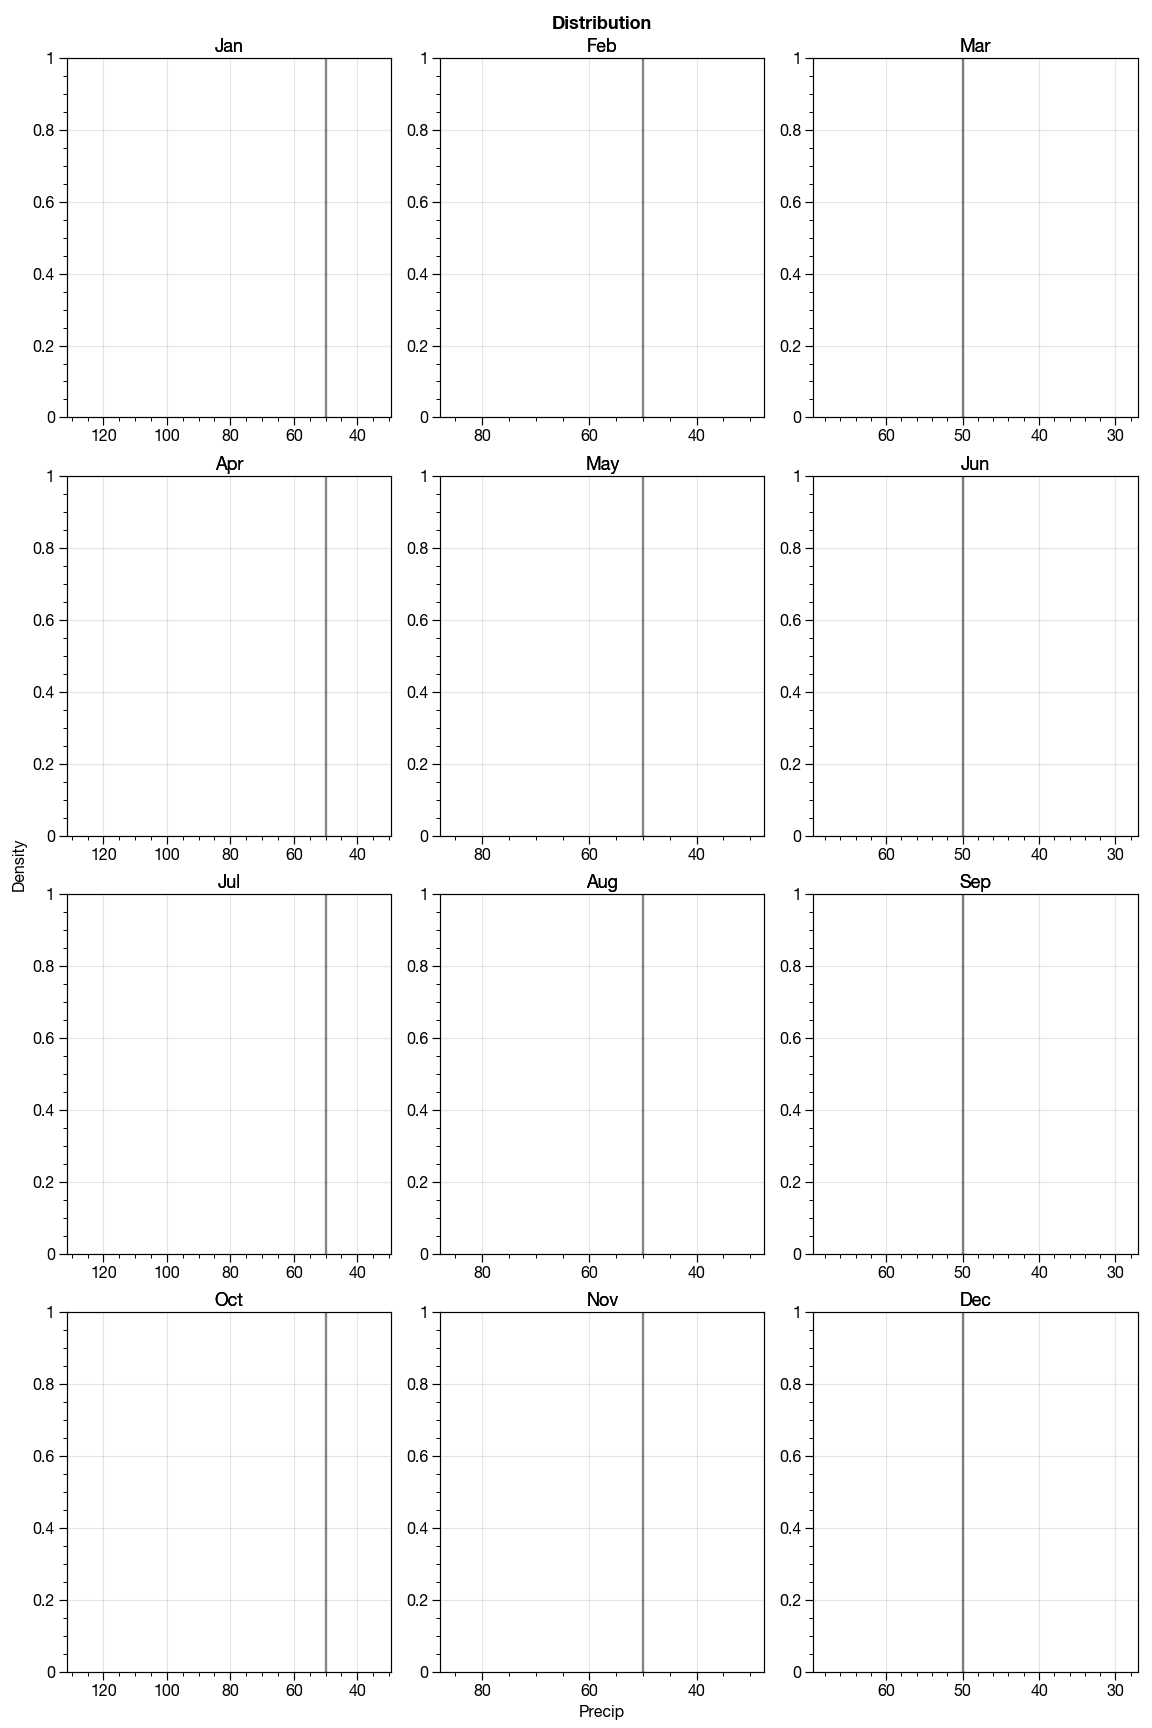
It looks empty plot. Also the axes are only sharing the x-axis for each column but I want it to be shared across all subplots.
The matplotlib version does what I expect.
fig, axs = plt.subplots(4, 3, figsize=(8, 12), sharex=True, sharey=True)

month_abbrs = [m for m in calendar.month_abbr if m != '']

for mth in range(0, 12):
    ax_ix = np.unravel_index(mth, (4, 3))
    ax = axs[ax_ix]
    mth_str = month_abbrs[mth]
    sns.distplot(flattened[mth], ax=ax)
    ax.set_title(mth_str)

fig.suptitle('Distribution of Rainfall each Month');
Calling ax.format(rc_kw={'legend.fontsize': int}) does not affect the font size of labels within the legend, and in fact overrides 'axes.labelsize', affecting the size of tick labels. However, other rcparams for the legend (e.g., legend.handlelength) do work. Because of this, I anticipate this is a proplot issue and not a matplotlib issue.
Sample code:
import numpy as np
import proplot as plot

def _set_aeshetics(ax):
    rc_kw = {'axes.labelsize': 8,
             'legend.fontsize': 20,
             'legend.handlelength': 6,
    }
    ax.format(rc_kw=rc_kw)

f, ax = plot.subplots(axwidth=6, aspect=5, bottomlegend=True)
x = np.random.rand(100,)
p = ax.plot(x, label='signal')
set_aeshetics(ax)
f.bottompanel.legend([p])
Note that 'legend.fontsize' doesn't affect the font size of labels within the legend, but actually blows up the tick labels to huge sizes. However, 'legend.handlelength' will stretch out the handle graphics.
Also, something internal to proplot blocks outside calls from managing this, e.g.:
plt.legend([p], prop={'size': 24})
savefig is currently broken with the most recent version of proplot. Running f.savefig('out.png') returns:
---------------------------------------------------------------------------
NameError                                 Traceback (most recent call last)
<ipython-input-6-c73250c3d7b6> in <module>
      5 ax.format(land=True, landcolor='black',
      6           suptitle='Zooming into Polar Stereographic Projections')
----> 7 f.savefig('test.png')

~/Desktop/proplot/proplot/subplots.py in savefig(self, filename, **kwargs)
    978         # Finally, save
    979         self._lock_twins()
--> 980         self._auto_bboxs(renderer)
    981         self._auto_title_pos() # just applies the spacing
    982         self._auto_smart_tight_layout()

NameError: name 'renderer' is not defined
This is because you added self._auto_bboxs(renderer) to savefig without adding renderer to the arguments. Might need a few tweaks here to fix it fully.
This could be caught in the future with some sort of testing. We've put together a reasonable pytest framework over at climpred (https://github.com/bradyrx/climpred/tree/master/climpred/tests) which is run with Travis CI for every PR. This catches some trivial errors like this for us. But I'm not sure how testing would work for a plotting library. A test could of course be implemented for saving figures.
The default y-axis tick labeling gets messed up when you go below 10^-3 for decimals.
A = np.random.rand(60) / 100
# labeling doesn't work
f, ax = plot.subplots(axwidth=4, aspect=4)
ax.plot(A)
# labeling works
f, ax = plt.subplots(figsize=(6,1.5))
ax.plot(A)
Since default matplotlib handles this, it seems like a bug with your custom y-tick labeling.
proplot:

matplotlib:

The ProPlot "tight layout" algorithm permits variable spacing between successive rows and columns. However, for the sake of symmetry/aesthetics, users may occaionally want constant spacing like in matplotlib.
This will be trivial to implement in proplot. We can add keyword args (e.g. wequal, hequal, and equal) to the Figure class that force the tight layout algorithm to use the largest of the calculated spaces for each row-row/column-column interface.
Just digging into map plotting with proplot. I'm finding that pcolorpoly or pcolormesh is throwing an erroneous error.
POP coordinates file: http://s000.tinyupload.com/index.php?file_id=02400530605186772325
import proplot as plot
import xarray as xr
import numpy as np
coords = xr.open_dataset('POP.x1.coords.nc')
data = np.random.rand(384,320)
data = xr.DataArray(data, dims=['nlat', 'nlon'])
data['TLAT'], data['TLONG'] = coords['TLAT'], coords['TLONG']
f, ax = plot.subplots(proj='hammer', basemap=False)
ax.pcolorpoly(data.TLONG, data.TLAT, data.T)
# ax.pcolormesh(data.TLONG, data.TLAT, data.T)---------------------------------------------------------------------------
ValueError Traceback (most recent call last)
<ipython-input-41-c6509b02180f> in <module>
1 f, ax = plot.subplots(proj='hammer', basemap=False)
----> 2 ax.pcolorpoly(data.TLONG, data.TLAT, data.T, transform=ccrs.PlateCarree())
~/miniconda3/envs/python3/lib/python3.7/site-packages/proplot/subplots.py in iterator(*args, **kwargs)
66 ret = []
67 for ax in self:
---> 68 res = getattr(ax, attr)(*args, **kwargs)
69 if res is not None:
70 ret += [res]
~/miniconda3/envs/python3/lib/python3.7/site-packages/proplot/base.py in decorator(rowmajor, *args, **kwargs)
241 x, y = utils.edges(x), utils.edges(y)
242 elif Z.shape[0]!=xlen-1 or Z.shape[1]!=ylen-1:
--> 243 raise ValueError(f'X ({"x".join(str(i) for i in x.shape)}) '
244 f'and Y ({"x".join(str(i) for i in y.shape)}) must correspond to '
245 f'nrows ({Z.shape[0]}) and ncolumns ({Z.shape[1]}) of Z, or its borders.')
ValueError: X (384x320) and Y (384x320) must correspond to nrows (320) and ncolumns (384) of Z, or its borders.It's throwing an error for not having matching dims, despite having matching dims. Is this because TLAT and TLONG are 2D? This is required for something like POP and very common among many (if not all) ocean models. Note that this plots just fine calling data.plot() through xarray.
Currently, when plotting values from an xarray.DataArray, proplot throws an error. Note that this didn't used to be an issue.
The following works (note A.values has to be called, but A.time.values does not. So this is only an issue with the actual data being plotted and not coordinates)
import numpy as np
import xarray as xr
A = np.random.rand(120,)
A = xr.DataArray(A, dims='time')
A['time'] = np.arange('1990-01', '2000-01', dtype='datetime64[M]')
f, ax = plot.subplots(width='12cm', aspect=4)
ax.plot(A.time, A.values)
This does not work:
import numpy as np
import xarray as xr
A = np.random.rand(120,)
A = xr.DataArray(A, dims='time')
A['time'] = np.arange('1990-01', '2000-01', dtype='datetime64[M]')
f, ax = plot.subplots(width='12cm', aspect=4)
ax.plot(A.time, A)
---------------------------------------------------------------------------
IndexError Traceback (most recent call last)
<ipython-input-37-ae88108929a8> in <module>
5 A['time'] = np.arange('1990-01', '2000-01', dtype='datetime64[M]')
6 f, ax = plot.subplots(width='12cm', aspect=4)
----> 7 ax.plot(A.time, A)
~/miniconda3/envs/python3/lib/python3.7/site-packages/proplot/subplots.py in iterator(*args, **kwargs)
129 ret = []
130 for func in attrs:
--> 131 ret.append(func(*args, **kwargs))
132 if len(ret)==1:
133 return ret[0]
~/miniconda3/envs/python3/lib/python3.7/site-packages/proplot/wrappers.py in wrapper(*args, **kwargs)
2555 @functools.wraps(func)
2556 def wrapper(*args, **kwargs):
-> 2557 return driver(self, func, *args, **kwargs)
2558 return wrapper
2559 return decorator
~/miniconda3/envs/python3/lib/python3.7/site-packages/proplot/wrappers.py in _parse_1d(self, func, *args, **kwargs)
312 if kw:
313 self.format(**kw)
--> 314 return func(x, *yss, *args, **kwargs)
315
316 def _parse_2d(self, func, *args, order='C', **kwargs):
~/miniconda3/envs/python3/lib/python3.7/site-packages/proplot/wrappers.py in wrapper(*args, **kwargs)
2555 @functools.wraps(func)
2556 def wrapper(*args, **kwargs):
-> 2557 return driver(self, func, *args, **kwargs)
2558 return wrapper
2559 return decorator
~/miniconda3/envs/python3/lib/python3.7/site-packages/proplot/wrappers.py in plot_wrapper(self, func, cmap, values, *args, **kwargs)
455 raise ValueError(f'Expected 1-3 plot args, got {len(args)}.')
456 if cmap is None:
--> 457 lines = func(*args, **kwargs)
458 else:
459 lines = self.cmapline(*args, cmap=cmap, values=values, **kwargs)
~/miniconda3/envs/python3/lib/python3.7/site-packages/proplot/wrappers.py in wrapper(*args, **kwargs)
2555 @functools.wraps(func)
2556 def wrapper(*args, **kwargs):
-> 2557 return driver(self, func, *args, **kwargs)
2558 return wrapper
2559 return decorator
~/miniconda3/envs/python3/lib/python3.7/site-packages/proplot/wrappers.py in cycle_wrapper(self, func, cycle, cycle_kw, markers, linestyles, label, labels, values, legend, legend_kw, colorbar, colorbar_kw, *args, **kwargs)
1517 pass
1518 elif isinstance(y, DataArray):
-> 1519 label = y.coords[y.dims[1]].values[i]
1520 label_cl = _auto_label(y.coords[y.dims[1]]) # coordinate label
1521 elif isinstance(y, DataFrame):
IndexError: tuple index out of rangeUsing the LogNorm colormap argument in, e.g., pcolormesh doesn't work correctly in proplot.
Data link: http://s000.tinyupload.com/index.php?file_id=02946064711977690771
With matplotlib:
import matplotlib.pyplot as plt
import cartopy.crs as ccrs
import matplotlib.colors as colors

ds = xr.open_dataset('chl_cal.nc')

f, ax = plt.subplots(subplot_kw=dict(projection=ccrs.PlateCarree()))
p = ax.pcolormesh(ds.lon, ds.lat, ds, norm=colors.LogNorm(vmin=ds.min(), vmax=ds.max()))
plt.colorbar(p)
With proplot:
f, ax = plot.subplots(proj='pcarree', tight=False, axwidth=6, colorbar='r')
p = ax.pcolormesh(ds.lon, ds.lat, ds.values, norm=colors.LogNorm(vmin=ds.min(), vmax=ds.max()))
ax.set_extent([-140, -105, 20, 50])
f.rightpanel.colorbar(p)
Here's a workaround, but I think using LogNorm is preferred so it handles the labeling and all that for you. Now this is of course in actual log10 units.
# Just log-transform before
ds = np.log10(ds)
f, ax = plot.subplots(proj='pcarree', tight=False, axwidth=6, colorbar='r')
p = ax.pcolormesh(ds.lon, ds.lat, ds.values,)
ax.set_extent([-140, -105, 20, 50])
f.rightpanel.colorbar(p)
Classes are getting really large, and I want to add even more methods to the axes classes (the various wrappers). Currently I use a custom fork of sphinx-automodapi to generate docs but it can only generate individual pages for each class and all of its methods.
This commit from my fork (applied to ProPlot with commit de582e3) addresses this issue. Now, class methods and attributes have their own page.
FYI @lukelbd , looks like tick labeling is available for non-mercator projections now. SciTools/cartopy#1117 was just merged. It's not in the conda/pip release yet, though.
This is a follow-up to #37 and #42.
I think my current approach of documenting wrappers separately from the functions to which they apply is very cumbersome and confusing for new users (many of whom don't really know what a "wrapper" is). The old approach stems only from a lack of imagination.
A better approach would be to:
help(ax.plot), they get usage info for the wrappers and the matplotlib method. Would look something like this:Help on function plot in module proplot.axes
plot(self, ...) # concatenated call signature from wrappers and matplotlib
-----------------------
ProPlot documentation
-----------------------
Summary. Wrapper 1 summary. Wrapper 2 summary. ... Wrapper N summary.
Parameters # concatenated parameter table
----------
...params from wrapper1
...params from wrapper2
...
...params from wrapperN
--------------------------
Matplotlib documentation
--------------------------
Original docstring placed here in its entirety.sphinx-automodapi fork that removes the matplotlib parameters when concatenating parameter tables. Matplotlib has some funky local sphinx extensions that will get messed up -- and anyway we don't want to copy their documenation onto our website. Would look something like this:plot(self, ...) # concatenated call signature
Summary. Wrapper 1 summary. Wrapper 2 summary. ... Wrapper N summary.
Parameters
-----------
...params from wrapper1
...params from wrapper2
...
...params from wrapperN
Other parameters
----------------
*args, **kwargs
Passed to <matplotlib native function>.
This will have the following implications:
Axes class methods. There will no longer be a Functions table in the Axes classes and related wrappers section of the online documentation.plot_wrapper will be defined directly on the Axes with def plot.standardize_1d will be hidden and *no longer documented explicitly *-- they will only be documented on the individual methods to which they apply.if name == 'contour' statements inside of cmap_features.This will be tricky but I think it is really necessary to reduce new user confusion. It also has the added benefit of making it easier to merge features with matplotlib if matplotlib developers feel so inclined.
It should involve borrowing from matplotlib's docstring.py file and using the inspect.getdoc and inspect.signature functions (for the latter see this post).
If one generates both a suptitle and a subplot title for the uppermost subplot, the suptitle gets pulled down into the plot and is hard to read (especially with subscripts are used in it).
With subplot title:

Without subplot title:

Code:
import numpy as np
import proplot as plot
def _rand_series(N):
    return np.random.rand(N,) + np.linspace(0, 0.5, N)

d1, d2 = _rand_series(100), _rand_series(100)
f, ax = plot.subplots(nrows=2, axwidth=6, aspect=5)
p1 = ax[0].plot(d1, color='r')
p2 = ax[1].plot(d2, color='sea')
#ax[0].format(title='interior title', titlepos='ri')
ax.format(ylim=[0, 1.5], suptitle='sup title', small=14, large=18)
Note that if you uncomment the line and do ax[1].format(title='foo'), the suptitle is fine. The error only occurs if it's the subplot directly interacting with the suptitle.
I'm finding that the keywords for e.g. LogNorm are not passing through the wrapper to matplotlib appropriately. Using the same data as when we discussed the LogNorm colorbar in #25: http://s000.tinyupload.com/index.php?file_id=02946064711977690771.
Below, see that proplot can't modify the LogNorm boundaries.
With proplot:
f, ax = plot.subplots(proj='pcarree', tight=False, axwidth=6,)

p = ax.contourf(chl.lon, chl.lat, chl.values, norm='log', norm_kw={'vmin': 0.01, 'vmax': 10}, levels=30,
                cmap='Fire', )

ax.format(latlim=(20, 50), lonlim=(-140, -105), land=True)
ax.colorbar(p, loc='r')
With matplotlib:
f, ax = plt.subplots()
p = plt.pcolormesh(chl.lon, chl.lat, chl.values, norm=colors.LogNorm(vmin=0.01, vmax=1), cmap='Fire')
plt.colorbar(p)
Hey!
Thanks for all your hard work on this open project!
I have a problem with importing proplot on my Ubuntu 18. In README you mentioned that cartopy is used for optional geographic mapping features so I am assuming cartopy is an optional dependency. However, I have a problem with import proplot and this is the error ModuleNotFoundError: No module named 'cartopy' also I have matplotlib and numpy installed. Is this behavior a bug or am I missing something?
Here is the results of import:
---------------------------------------------------------------------------
ModuleNotFoundError                       Traceback (most recent call last)
<ipython-input-1-41f69010d0c1> in <module>()
----> 1 import proplot as plot

/home/vezeli/.local/lib/python3.6/site-packages/proplot/__init__.py in <module>()
     10 from .rcmod import *      # custom configuration implementation
     11 from .utils import *      # misc stuffimport cartopy
---> 12 from .axes import *       # everything, axes definitions
     13 from .subplots import *
     14 from .gridspec import *

/home/vezeli/.local/lib/python3.6/site-packages/proplot/axes.py in <module>()
     81 # TODO: Import matplotlib docstring func, use it?
     82 from .rcmod import rc, _rc_names_nodots
---> 83 from . import utils, projs, colortools, fonttools, axistools
     84 from .utils import _default, _timer, _counter, ic, units
     85 from .gridspec import FlexibleGridSpec, FlexibleGridSpecFromSubplotSpec

/home/vezeli/.local/lib/python3.6/site-packages/proplot/projs.py in <module>()
     77 import matplotlib.path as mpath
     78 import warnings
---> 79 import cartopy
     80 from .rcmod import rc
     81 try:

ModuleNotFoundError: No module named 'cartopy'
Since the problem is in line #79 import cartopy in projs.py I tried moving this line inside the try environment in #81 but this didn't solve my problem. Any suggestions on how to import proplot successfully?
It would be great if you could make a tagged version release on pip that's stable. The API changes so frequently right now that I feel like I'm rewriting my notebook cells every week when I pull down updates. Then folks could just install a specific version from pip while you continue development.
Releasing on PyPI takes < 5 minutes: https://github.com/bradyrx/climpred/blob/master/HOWTORELEASE.rst. You could tag a v1.0.0 and then follow semantic versioning (https://semver.org/) as you release more features.
Hi, just dropping by to say this is a fantastic project. Thanks for putting it together!
One thing i'm curious about is whether you'd consider extending support for geopandas plots. I've been toying around and for the most part, proplot works great, though it has some difficulties with legends because of the way geopandas returns fig, ax or soemething (i haven't looked in detail, tbh).
A "Minimal, Complete and Verifiable Example" will make it much easier for maintainers to help you.
# convenience to get data
from geosnap import Community
dc = Community.from_census(msa_fips='47900')

#plot it
f, axs = plot.subplots(ncols=2)

a = dc.gdf[dc.gdf.year==1990].plot(column='median_household_income', ax=axs[0], scheme='quantiles', k=8, legend=True)
dc.gdf[dc.gdf.year==2000].plot(column='median_household_income', ax=axs[1], scheme='quantiles')

axs.format(suptitle='Geopandas Test')

axs[0].format(title='1990')
axs[1].format(title='2000')

axs.legend(a, loc='r', ncols=1, frame=False)
/Users/knaaptime/anaconda3/envs/geosnap/lib/python3.7/site-packages/proplot/wrappers.py:2116: UserWarning: Legend does not support <matplotlib.axes._subplots.CartesianAxesSubplot object at 0x13288e390> instances.
A proxy artist may be used instead.
See: http://matplotlib.org/users/legend_guide.html#creating-artists-specifically-for-adding-to-the-legend-aka-proxy-artists
        leg = mlegend.Legend(self, *zip(*pairs), ncol=ncol, loc=loc, **kwargs)

---------------------------------------------------------------------------
AttributeError                            Traceback (most recent call last)
<ipython-input-33-7897da7bfa49> in <module>
      9 axs[1].format(title='2000')
     10
---> 11 axs.legend(a, loc='r', ncols=1, frame=False)
     12

~/anaconda3/envs/geosnap/lib/python3.7/site-packages/proplot/subplots.py in _iterator(*args, **kwargs)
    276                 ret = []
    277                 for func in objs:
--> 278                     ret.append(func(*args, **kwargs))
    279                 ret = (*ret,)
    280                 if len(self) == 1:

~/anaconda3/envs/geosnap/lib/python3.7/site-packages/proplot/axes.py in legend(self, loc, width, space, *args, **kwargs)
   1153         if loc in ('left','right','top','bottom'):
   1154             ax = self.panel_axes(loc, width=width, space=space, filled=True)
-> 1155             return ax.legend(*args, loc='_fill', **kwargs)
   1156
   1157         # Fill

~/anaconda3/envs/geosnap/lib/python3.7/site-packages/proplot/axes.py in legend(self, loc, width, space, *args, **kwargs)
   1183
   1184         # Draw legend
-> 1185         return legend_wrapper(self, *args, loc=loc, **kwargs)
   1186
   1187     def draw(self, renderer=None, *args, **kwargs):

~/anaconda3/envs/geosnap/lib/python3.7/site-packages/proplot/wrappers.py in legend_wrapper(self, handles, labels, ncol, ncols, center, order, loc, label, title, fontsize, fontweight, fontcolor, color, marker, lw, linewidth, dashes, linestyle, markersize, frameon, frame, **kwargs)
   2199         leg.legendPatch.update(outline) # or get_frame()
   2200         for obj in leg.legendHandles:
-> 2201             obj.update(kw_handle)
   2202         for obj in leg.get_texts():
   2203             obj.update(kw_text)

AttributeError: 'NoneType' object has no attribute 'update'
maybe just a syntax error on my part, but I think this is because of what geopandas is returning...
anyway, thanks again. Looking forward to seeing this package released officially :)
@lukelbd, proplot suppresses error bar modification for some reason. I tried looking through the repo to see if capsize, errorbar, etc. was modified but it's rarely referenced. So must be something more internal you might have an idea of.
With proplot:
import proplot as plot
import numpy as np
x = ['A', 'B', 'C']
y = np.random.rand(3) * 10
err = np.random.rand(3)
f, ax = plot.subplots()
ax.bar(x, y, yerr=err, capsize=15)
Without proplot:
import matplotlib.pyplot as plt
import numpy as np
x = ['A', 'B', 'C']
y = np.random.rand(3) * 10
err = np.random.rand(3)
f, ax = plt.subplots()
ax.bar(x, y, yerr=err, capsize=15)
Right now a 2D plot of ocean temperatures is making weird streaks with proplot, but works with matplotlib. Also, the right and bottom of the subplot get cut off.
You can download the sample data with:
import climpred as cp
data = cp.tutorial.load_dataset('MPI-control-3D')
data = data.isel(time=0).tos
Also a note to try out some of the climpred sample maps with proplot to see if these issues persist.
I'm having issues with setting up colorbars for pcolormesh,pcolorpoly,contourf, etc. See the following (note the meshgrid call is so that it will work with cartopy):
f, ax = plot.subplots(bottomcolorbar=True)

offset = 20
x = plot.arange(-180+offset,180+offset-1,30)
y = plot.arange(-60,60+1,10)
X, Y = np.meshgrid(x, y)
data = np.random.rand(len(y), len(x))
m = ax.pcolormesh(X, Y, data)
f.bottompanel.colorbar(m)
The error message:
---------------------------------------------------------------------------
TypeError                                 Traceback (most recent call last)
<ipython-input-106-ff323e608faf> in <module>
      8 m = ax.pcolormesh(x, y, data)
      9
---> 10 f.bottompanel.colorbar(m)

~/miniconda3/envs/python3/lib/python3.6/site-packages/proplot/subplots.py in iterator(*args, **kwargs)
    586                 ret = []
    587                 for ax in self:
--> 588                     res = getattr(ax, attr)(*args, **kwargs)
    589                     if res is not None:
    590                         ret += [res]

~/miniconda3/envs/python3/lib/python3.6/site-packages/proplot/axes.py in colorbar(self, i, n, length, space, hspace, wspace, *args, **kwargs)
   2198             orientation  = 'vertical'
   2199         kwargs.update({'orientation':orientation, 'ticklocation':ticklocation})
-> 2200         return colorbar_factory(ax, *args, **kwargs)
   2201
   2202 class MapAxes(BaseAxes):

~/miniconda3/envs/python3/lib/python3.6/site-packages/proplot/axes.py in colorbar_factory(ax, mappable, values, orientation, extend, extendlength, clabel, label, ctickminor, tickminor, cgrid, grid, ticklocation, cticklocation, ctickdir, tickdir, clocator, locator, cminorlocator, minorlocator, clocator_kw, locator_kw, cminorlocator_kw, minorlocator_kw, cformatter, formatter, cticklabels, ticklabels, norm, norm_kw, **kwargs)
   3241             ticks=locators[0],
   3242             format=cformatter,
-> 3243             **csettings)
   3244
   3245     # Make edges/dividers consistent with axis edges

~/miniconda3/envs/python3/lib/python3.6/site-packages/matplotlib/figure.py in colorbar(self, mappable, cax, ax, use_gridspec, **kw)
   2127                              'panchor']
   2128         cb_kw = {k: v for k, v in kw.items() if k not in NON_COLORBAR_KEYS}
-> 2129         cb = cbar.colorbar_factory(cax, mappable, **cb_kw)
   2130
   2131         self.sca(current_ax)

~/miniconda3/envs/python3/lib/python3.6/site-packages/matplotlib/colorbar.py in colorbar_factory(cax, mappable, **kwargs)
   1565         cb = ColorbarPatch(cax, mappable, **kwargs)
   1566     else:
-> 1567         cb = Colorbar(cax, mappable, **kwargs)
   1568
   1569     cid = mappable.callbacksSM.connect('changed', cb.on_mappable_changed)

~/miniconda3/envs/python3/lib/python3.6/site-packages/matplotlib/colorbar.py in __init__(self, ax, mappable, **kw)
   1096                 kw['alpha'] = mappable.get_alpha()
   1097
-> 1098             ColorbarBase.__init__(self, ax, **kw)
   1099
   1100     def on_mappable_changed(self, mappable):

~/miniconda3/envs/python3/lib/python3.6/site-packages/matplotlib/colorbar.py in __init__(self, ax, cmap, norm, alpha, values, boundaries, orientation, ticklocation, extend, spacing, ticks, format, drawedges, filled, extendfrac, extendrect, label)
    412             self.formatter = format  # Assume it is a Formatter
    413         # The rest is in a method so we can recalculate when clim changes.
--> 414         self.draw_all()
    415
    416     def _extend_lower(self):

~/miniconda3/envs/python3/lib/python3.6/site-packages/matplotlib/colorbar.py in draw_all(self)
    446         C = self._values[:, np.newaxis]
    447         self.config_axis()
--> 448         self._config_axes(X, Y)
    449         if self.filled:
    450             self._add_solids(X, Y, C)

~/miniconda3/envs/python3/lib/python3.6/site-packages/matplotlib/colorbar.py in _config_axes(self, X, Y)
    634         ax.add_artist(self.patch)
    635
--> 636         self.update_ticks()
    637
    638     def _set_label(self):

~/miniconda3/envs/python3/lib/python3.6/site-packages/matplotlib/colorbar.py in update_ticks(self)
    546         else:
    547             _log.debug('Using fixed locator on colorbar')
--> 548             ticks, ticklabels, offset_string = self._ticker(locator, formatter)
    549             long_axis.set_ticks(ticks)
    550             long_axis.set_ticklabels(ticklabels)

~/miniconda3/envs/python3/lib/python3.6/site-packages/matplotlib/colorbar.py in _ticker(self, locator, formatter)
    771         ticks = self._locate(b)
    772         formatter.set_locs(b)
--> 773         ticklabels = [formatter(t, i) for i, t in enumerate(b)]
    774         offset_string = formatter.get_offset()
    775         return ticks, ticklabels, offset_string

~/miniconda3/envs/python3/lib/python3.6/site-packages/matplotlib/colorbar.py in <listcomp>(.0)
    771         ticks = self._locate(b)
    772         formatter.set_locs(b)
--> 773         ticklabels = [formatter(t, i) for i, t in enumerate(b)]
    774         offset_string = formatter.get_offset()
    775         return ticks, ticklabels, offset_string

~/miniconda3/envs/python3/lib/python3.6/site-packages/proplot/axistools.py in __call__(self, x, pos)
    888         prefix = ''
    889         tickrange = self._tickrange
--> 890         if (x + eps) < tickrange[0] or (x - eps) > tickrange[1]:
    891             return '' # avoid some ticks
    892         string = super().__call__(x, pos)

TypeError: 'NoneType' object is not subscriptable
Quick plots with xarray (e.g., ds.plot()) use 'viridis' as the default sequential colormap and 'RdBu' as the default diverging colormap.
Thus, if one is to use ds.plot() with negative and positive values, an error is thrown because 'RdBu' doesn't exist once proplot is imported. For whatever reason, it seems like the 'RdBu' convention from matplotlib (https://matplotlib.org/examples/color/colormaps_reference.html) was switched to 'BuRd' in proplot.
Some other cases here are 'RdYlBu' from matplotlib becomes 'BuYlRd'. I imagine reordering of these strings should be avoided so that errors like this aren't thrown from outside packages. Perhaps simple aliases can be made to take either BuRd or RdBu.
Not really sure how to debug this, but something in your figure saving creates vector objects that extend to seemingly infinity off the screen.
You can see here in my illustrator screenshot. The bar object can't be modified by illustrator really because it says transforming it will make it too large. The blue outline seen extends downward infinitely. If I save an eps from matplotlib the object is only the size of the bar.

I want to add a few new color usage features at some point:
LinearSegmentedColormap.from_file and ListedColormap.from_file methods that load lists of hex strings, etc. I can let these methods read JPG and PNG files too. For colormaps, we try to read colors along the long-axis of the image (possibly with smoothing?), and for color cycles, we try to get distinct colors in the image. The latter would let us easily load cycles from tools like Color Hunt.delta_min <= square_root(delta_chroma^2 + delta_luminance^2 + min(delta_hue, 360 - delta_hue)^2) <= delta_max. The random_cycle function should accept an initial color and the delta_min and delta_max bounds as optional arguments, and the value of delta can be randomly selected between those bounds, then randomly divided into hue, chroma, and luminance steps.These are not a release priority but would be cool.
I'm getting an error with proplot when trying to zoom in to a specific subregion of my cartopy projection. I just want to map the California coastline, but it seems to break due to changes in the axis width. However, this works just fine with matplotlib.
Any tips here? Should I be using something other than set_extent that I can call in plot.subplots()? Any thoughts on maintaining the right width/aspect for a zoomed in cartopy subplot? I've had trouble in the past with matplotlib to get differing coastal regions to have the same width/height aspect ratio due to being in different latitudes.
proplot
f, ax = plot.subplots(width='12cm', proj='cyl')
ax.set_extent([-140, -107, 20, 50], crs=ccrs.PlateCarree())
Huge error chain ending in:
ValueError: Not enough room for axes (would have width -33.5696). Increase width, or reduce spacings 'left', 'right', or 'wspace'.
matplotlib
f, ax = plt.subplots(subplot_kw=dict(projection=ccrs.PlateCarree()))
ax.set_extent([-140, -107, 20, 50])
ax.coastlines()
ProPlot should integrate with existing complex basemap features. For power users, this can be done by calling methods on ax.projection (which is the Basemap instance associated with the axes). But if we wanted to make things easier for users (in the spirit of ProPlot) we could add options to ProjectionAxes._format_apply as follows:
def _format_apply(
         ...
         etopo=None, bluemarble=None,
         mapscale=None, mapscale_kw=None,
         wmsimage=None, wmsimage_kw=None,
         warpimage=None, warpimage_kw=None,
         tissot=None, tissot_kw=None,
         patch_kw=None, **kwargs,
         ):
         """
         ...
         bluemarble : optional
             For basemap axes only. Draws the blue marble image.
         etopo : optional
             For basemap axes only. Draws topography data.
         mapscale, mapscale_kw : optional
             For basemap axes only. Draws a map scale.
         tissot, tissot_kw : optional
             For basemap axes only. Draws Tissot indicatrixes.
         warpimage, warpimage_kw : optional
             For basemap axes only. Adds arbitrary images to the background.
             See `~mpl_toolkits.basemap.Basemap.warpimage`.
         wmsimage, wmsimage_kw : optional
             For basemap axes only. Downloads and plots images using the WMS protocol.
             See `~mpl_toolkits.basemap.Basemap.warpimage`.
         ...
   """
Cartopy is missing several of these features, but distance scales could be implemented manually as discussed in this stackoverflow thread and this cartopy Github issue. This could be added to ProPlot ProjectionAxes, or to the cartopy project directly.
It would also be really interesting if we could add compasses to plots that show the Northward direction. This is not available in basemap or cartopy.
I'm not really motivated to address these proposals anytime soon but if someone else is, I think this is very doable for new contributors.
I'd like to add KDE (kernel density estimation) functionality for the 1D and 2D histogram plotting functions, hist, hist2d, and maybe hexbin. Users can then optionally add marginal distribution panels with panel_axes.
Currently, the only matplotlib plotting function supporting KDE estimation is violinplot, but the result is often gross -- the "violins" do not smoothly taper to zero-width tails like in seaborn. Instead they abruptly cut off at the distribution minimum/maximum. So, we shouldn't try to use the existing KDE engine -- we should implement a new KDE estimation engine, similar to seaborn, and use it to power hist, hist2d, and violinplot. This may involve writing a new violinplot from scratch.
This file with 2D longitude/latitude arrays causes a weird streaking issue when you do a pcolormesh plot.
import os
import xarray as xr
file = os.path.expanduser('~/Downloads/data.for.luke.nc')
data = xr.open_dataset(file)

# proplot
levels = plot.arange(0, 0.012, 0.001)
import proplot as plot
f, ax = plot.subplots(proj='cyl', width=5)
ax.pcolormesh(data.ULONG, co2.ULAT, data.PH_ALT_CO2, levels=levels, cmap='Fire', colorbar='b')
ax.format(facecolor='gray')

# pyplot
import matplotlib.pyplot as plt
import cartopy.crs as ccrs
f, ax = plt.subplots(figsize=(5,3.5), subplot_kw={'projection':ccrs.PlateCarree()})
c = ax.pcolormesh(data.ULONG, co2.ULAT, data.PH_ALT_CO2, # levels=levels,
                vmin=min(levels), vmax=max(levels),
                cmap='Fire', transform=ccrs.PlateCarree())
f.colorbar(c, ax=ax, orientation='horizontal')
ax.patch.set_facecolor('gray')
f.subplots_adjust(0.02, 0.02, 0.98, 0.98)

Hi,
I don't think there is any need to flip the array when coordinates are decreasing here:
https://github.com/lukelbd/proplot/blob/5ed5e8d02c8ca14a58789e414a0aa2ea5a600e8f/proplot/utils.py#L159
The linear interpolations and extrapolations are always valid.
Currently, the text wrapper for proplot cannot handle projecting to geoaxes, making it impossible to accurately place text on a map projection. For matplotlib one just passes a transform=ccrs.PlateCarree() for example to the ax.text() to interpret the values as coordinates on the map:
import matplotlib.pyplot as plt
import cartopy.crs as ccrs
import cartopy.feature as cfeature

f, ax = plt.subplots(subplot_kw=dict(projection=ccrs.SouthPolarStereo(central_longitude=-70)))
ax.set_extent([-180, 180, -90, -40], ccrs.PlateCarree())
ax.add_feature(cfeature.LAND, color='#d3d3d3')

ax.text(120, -83, 'test', transform=ccrs.PlateCarree())
proplot breaks when one tries to place ccrs.PlateCarree() into the transform keyword for the text wrapper. And the options of data, axes, figure don't fix this problem. Perhaps an extra keyword such as geoaxes could handle this?
import proplot as plot

f, ax = plot.subplots(proj='spstere', proj_kw={'central_longitude': -70})

ax.text(120, -83, 'test', color='w', fontname='Helvetica')

ax.format(land=True, boundinglat=-40)
@lukelbd, some more perceptually uniform colormaps for you to add if you'd like: http://www.fabiocrameri.ch/colourmaps.php
These were suggested to me (and designed by) Fabio Crameri in this thread: https://twitter.com/rileyxbrady/status/1046841027565215749
So far, I have been implementing all plot method wrappers by applying them in __getattribute__ on the axes classes. This is pretty "hacky" and unexpected for new contributors. On the "Axes and related wrappers" page of the documentation, I defend this choice as reducing the source code size. Originally, I also avoided this because the automodapi sphinx extension used to generate ProPlot documentation inherits docstrings from identically-named methods on parent classes. In my fork of automodapi, this is no longer the case -- if the docstring is empty (i.e. func.__doc__ is empty), automodapi skips that method. I prefer to document ProPlot enhancements of matplotlib axes methods separately, so users calling e.g. help(ax.contourf) get the native matplotlib docstring.
In the future, I'd like to implement all wrappers using decorators, which is more verbose but probably falls under the Simple is better than complex category. There are also several places in the wrapper functions where I apply function-specific behavior -- e.g. in cmap_wrapper, various if func.__name__ == 'contour' statements. With decorators, it will be easier to implement method-specific behavior and easier to debug issues.
I'm trying to use globe=True on a 2D map, and it doesn't seem to wrap the data correctly.
Here's a sample netCDF being used: http://s000.tinyupload.com/index.php?file_id=09194045931802153007 (I know this is bad practice, but this is the easiest way to reproduce it right now).
import xarray as xr
import proplot as plot
ds = xr.open_dataset('global_corr.nc')
f, ax = plot.subplots(proj='pcarree', axwidth=8, colorbar='r')
p = ax.contourf(global_corr.lon, global_corr.lat, global_corr,
               levels=plot.arange(-0.7, 0.7, 0.1), cmap='RdBu_r',
                globe=False)
f.rightpanel.colorbar(p)
Okay, so we have the seam as expected:

Issue 1: globe=True does not work with raw xarray objects. Perhaps this could be mitigated by passing .values whenever you see a pandas/xarray object. We use an is_xarray decorator in climpred to detect xarray objects. Maybe something similar could be done here. Or maybe I should just live with passing .values with my xarray objects.
ValueError: dimensions () must have the same length as the number of data dimensions, ndim=1Issue 2: globe=True seems to change the colorbar/data/land (?) creating the wrong map:
ds = xr.open_dataset('/Users/ribr5703/Desktop/global_corr.nc')
f, ax = plot.subplots(proj='pcarree', axwidth=8, colorbar='r')
p = ax.contourf(global_corr.lon.values, global_corr.lat.values, global_corr.values,
               levels=plot.arange(-0.7, 0.7, 0.1), cmap='RdBu_r',
                globe=True)
f.rightpanel.colorbar(p)
If I just use the cartopy utility, I get the right map.
from cartopy.util import add_cyclic_point
cyclic_data, cyclic_lons = add_cyclic_point(global_corr.values, coord=global_corr.lon.values)

ds = xr.open_dataset('/Users/ribr5703/Desktop/global_corr.nc')
f, ax = plot.subplots(proj='pcarree', axwidth=8, colorbar='r')
p = ax.contourf(cyclic_lons, global_corr.lat.values, cyclic_data,
               levels=plot.arange(-0.7, 0.7, 0.1), cmap='RdBu_r',
                globe=False)
f.rightpanel.colorbar(p)
A declarative, efficient, and flexible JavaScript library for building user interfaces.
🖖 Vue.js is a progressive, incrementally-adoptable JavaScript framework for building UI on the web.
TypeScript is a superset of JavaScript that compiles to clean JavaScript output.
An Open Source Machine Learning Framework for Everyone
The Web framework for perfectionists with deadlines.
A PHP framework for web artisans
Bring data to life with SVG, Canvas and HTML. 📊📈🎉
JavaScript (JS) is a lightweight interpreted programming language with first-class functions.
Some thing interesting about web. New door for the world.
A server is a program made to process requests and deliver data to clients.
Machine learning is a way of modeling and interpreting data that allows a piece of software to respond intelligently.
Some thing interesting about visualization, use data art
Some thing interesting about game, make everyone happy.
We are working to build community through open source technology. NB: members must have two-factor auth.
Open source projects and samples from Microsoft.
Google ❤️ Open Source for everyone.
Alibaba Open Source for everyone
Data-Driven Documents codes.
China tencent open source team.