microsoft / powerbi-visuals-samplebarchart Goto Github PK
View Code? Open in Web Editor NEWBar Chart Custom Visual for tutorial.
Bar Chart Custom Visual for tutorial.
I have tried building this, then importing it into Power BI Desktop and the service, using both of Explorer and Edge.
In all cases, when trying to change the color of one of the categories, all that happens is a short flash into of the control into the new color before it reverts back to the default.
This repository is currently missing a LICENSE file.
A license helps users understand how to use your project in a compliant manner. You can find the standard MIT license Microsoft uses at: https://github.com/microsoft/repo-templates/blob/main/shared/LICENSE.
If you would like to learn more about open source licenses, please visit the document at https://aka.ms/license (Microsoft-internal guidance).
came here from microsoft doc but node_modules folder is missing in this repo
steps:
Blank screen.
here is a screenshot

but the page just white like do nothing
At multiple places in this Git a setup guide is referenced, but the link is broken (HTTP error 404):
https://github.com/Microsoft/PowerBI-visuals/blob/master/Readme.md#setting-up-environment
If I understand correctly, then this.host.allowInteractions moved to options.host.hostCapabilities.allowInteractions in the Power BI API. You need to update the code to make it compatible with newest version of API. There might be other changes needed as well.
options.host.locale is not defined when debugging through PowerBI service - is there a step to enable localization?
I have created the custom visual using this code, It will run successfully but It is not displaying any data. I have notice that svg is not getting from the D3. I have check that using console.log. I found that it will undefined and It will not execute further.
I download the zip from github. when packaging the visual, I got the following error.
C:\Users\reyang\PBI\barchart>pbiviz package
info Building visual...
error TYPESCRIPT /src/barChart.ts : (129,22) Cannot find namespace 'd3'.
error TYPESCRIPT /src/barChart.ts : (132,36) Cannot find namespace 'd3'.
error TYPESCRIPT /src/barChart.ts : (133,31) Cannot find namespace 'd3'.
error TYPESCRIPT /src/barChart.ts : (134,24) Cannot find namespace 'd3'.
error TYPESCRIPT /src/barChart.ts : (166,34) Cannot find name 'd3'.
error TYPESCRIPT /src/barChart.ts : (215,30) Cannot find name 'd3'.
error TYPESCRIPT /src/barChart.ts : (218,26) Cannot find name 'd3'.
error TYPESCRIPT /src/barChart.ts : (222,26) Cannot find name 'd3'.
error TYPESCRIPT /src/barChart.ts : (226,25) Cannot find name 'd3'.
error TYPESCRIPT /src/barChart.ts : (264,25) Cannot find name 'd3'.
error TYPESCRIPT /src/barChart.ts : (269,29) Cannot find name 'd3'.
error TYPESCRIPT /src/tooltipServiceWrapper.ts : (13,24) Cannot find namespace 'd3'.
error TYPESCRIPT /src/tooltipServiceWrapper.ts : (13,24) Parameter 'selection' of method from exported interface has or is using private name 'd3'.
error TYPESCRIPT /src/tooltipServiceWrapper.ts : (39,24) Cannot find namespace 'd3'.
error TYPESCRIPT /src/tooltipServiceWrapper.ts : (53,45) Cannot find name 'd3'.
error TYPESCRIPT /src/tooltipServiceWrapper.ts : (83,45) Cannot find name 'd3'.
error TYPESCRIPT /src/tooltipServiceWrapper.ts : (156,47) Cannot find name 'd3'.
error TYPESCRIPT /src/tooltipServiceWrapper.ts : (157,27) Cannot find name 'd3'.
error TYPESCRIPT /src/tooltipServiceWrapper.ts : (192,30) Cannot find name 'd3'.
error TYPESCRIPT /src/tooltipServiceWrapper.ts : (198,40) Cannot find name 'd3'.
D3 is not available. How to fix it? thx.
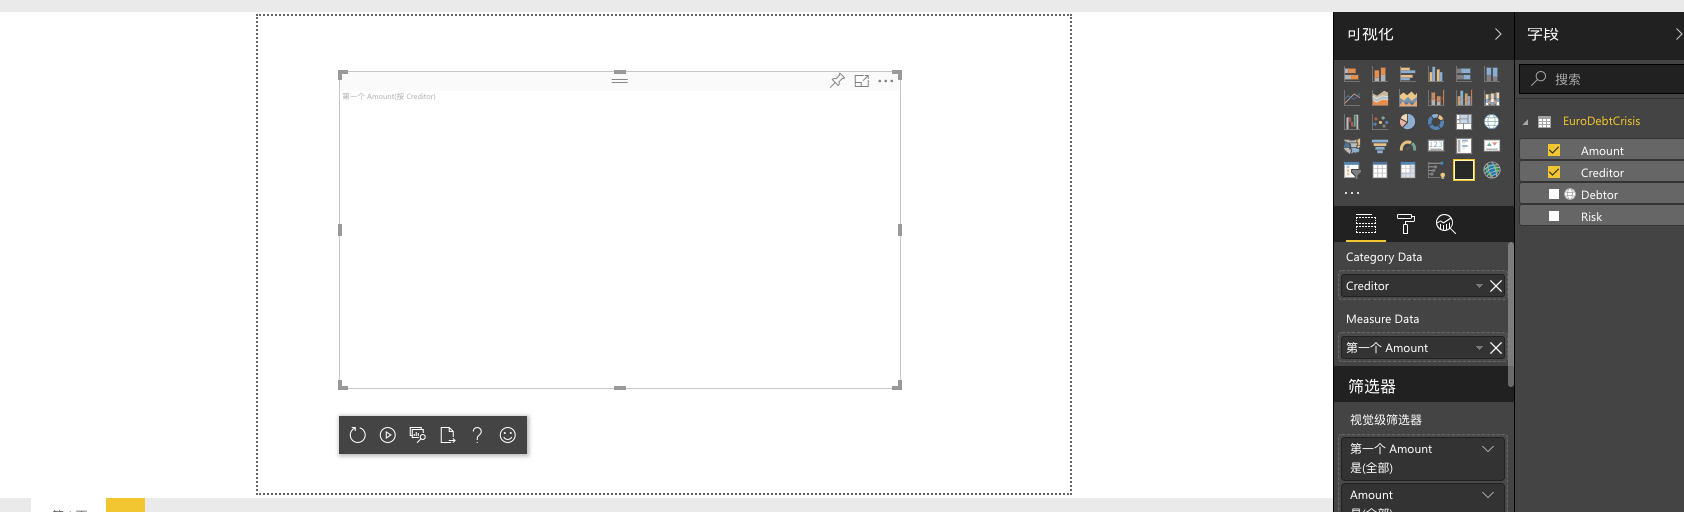
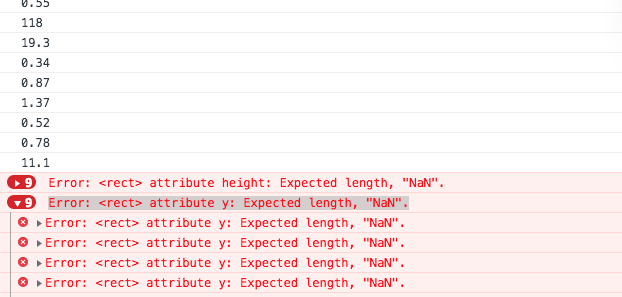
Please help - I'm building a custom visual based on the tutorial here - I've followed it very closely then made tweeks. When I interact with the filters pane though, the visual updates but it doesn't clear - it only clears when I reload the visual. I am using the d3.js methods .exit().remove() but they don't make any difference - any idea what I've missed?? Everything else on the visual seems to be working pretty well. I've appended two screen shots to illustrate what is happening - the first screen shot is it working (I've scribbled out some scores) then the second shot is what happens when I make changes to the filters.


Hello developers,
I really appreciate your works for creating such a great example. But during the time I try to write visual by myself, I met some problems about passing data by using dataview. I find no convenient way to pass a Json type data to dataview. Is there any suggestion on doing that? I tried to use Measure in dataRoles to pass a single string value to the TypeScript project. However, I can't use JSON.parse(s: string) to parse this string to an object. Can you give me some references, documents or coding sample? Really appreciate your time. Thank you.
Sincerely,
Jiacheng
It appears that there needs to be updates on the codes. for instnace I have to change you code on declaration of svg to
let svg = this.svg = d3.select<SVGElement, any>(options.element as any)
and add as any to all the attrs. Can you guys kindly clarify and update us on that?
where is the maxLocal in barChart.ts in line 66 come from?
I have noticed that every time when I reload the visual code, the memory usage seems to increase. It does decrease a bit after a few seconds, but not back to where the memory usage was before. Removing the visual doesn't help with this as well.
I am currently building my own visual based on this sample and are experiencing the same problem. I wonder whether the visual has cleaned up properly on reload or remove.
Consider running 'typings install' npm install, also add the typings as an npm dev dependency so you don't need to require they have it globally installed.
I expected the visual to be ready out of the box. Do I have to manually install D3??
Building visual...
error TYPESCRIPT File 'c:/.../typings.d.ts' not found
error TYPESCRIPT /src/barchart.ts' (114,22) cannot find namespace 'd3'
.
.
.
error TYPESCRIPT /src/barchart.ts' (114,22) cannot find name 'd3'
<7 like this>
The tool tip is not rendering at pointer location when the mouse pointer moved over the bar.
tried building package as well.

When the visual is pinned to a dashboard tooltips are not displayed on mouse over, while native visuals can display their tooltips correctly.
In all other contexts (included dashboard in focus mode) tooltips work as expected.
Debugging the code I noticed that the method visualhosttooltipservice.show() is called as usual in tooltipServiceWrapper.ts, but nothing is shown.
On Page: https://github.com/microsoft/PowerBI-visuals-sampleBarChart/blob/master/Tutorial/DataBinding.md
Under section: https://github.com/microsoft/PowerBI-visuals-sampleBarChart/blob/master/Tutorial/DataBinding.md#adding-data-roles
The hyperlink referring to: For more information, see the section about Data Roles.
is broken.
current link assigned is: https://github.com/Microsoft/PowerBI-visuals/blob/master/Capabilities/Capabilities.md#define-the-data-fields-your-visual-expects---dataroles
Needs updating.
I have been trying to update the API to 1.3 - I managed to do this but had to change my values value from number to PrimitiveValue - It however is now not compatible with the d3 I had written (I had a working custom visual) using API version 1.2. I looked back over the barchart tutorial to see how this issue was dealt with, and found that there was an unexplained change not highlighted in the code from commit to commit.
In the building Bar Chart section;
Step 6. Adding Databound Objects to Property Pane - at this commit -
src/barchart.ts - line 26
value: number;
Step 7. Adding Tooltips to the Bar Chart - There is an undocumented change at this commit
src/barchart.ts - line 26
value: PrimitiveValue;
If you're using commits to highlight the changes made at each stage in a tutorial, it is unfair to boobytrap the tutorial by not highlighting or explaining all changes. I've had to revert back to API 1.2 until I figure out how to proceed.
I checked out the branch https://github.com/Microsoft/PowerBI-visuals-sampleBarChart/tree/f5ef02a5851c98671b46fedc1e7f7e7133001d7c which is a bar graph with static data. When I run it, I don't see anything at graph at all.

I really just want to get an example of the static bar graph running. I've gotten the default new template working where it displays the word 0 count...But when I try to load this example nothing shows. I would expect to see a bar graph based on the static data points.
Thanks,
Derek
Hello - I want to make the tooltip changes etc and have been trying to update to API Version 1.3 with no success, I've tried...
pbiviz update
pbiviz update 1.3.0
It won't update though and runs an error, what am I doing wrong?
I cannot compile and run the sample as I plainly cloned the repo.
Almost the same things happens when I use d3.js in other projects.
Help is urgently needed!
C:\dev\MR\pbiviz\PowerBI-visuals-sampleBarChart>pbiviz start
 info   Building visual...
 error  UNKNOWN RangeError: Maximum call stack size exceeded
    at isMatchingReference (C:\Users\Jörg\AppData\Roaming\npm\node_modules\powerbi-visuals-tools\node_modules\typescript\lib\typescript.js:32599:37)
    at narrowTypeByTypeof (C:\Users\Jörg\AppData\Roaming\npm\node_modules\powerbi-visuals-tools\node_modules\typescript\lib\typescript.js:33453:22)
    at narrowTypeByBinaryExpression (C:\Users\Jörg\AppData\Roaming\npm\node_modules\powerbi-visuals-tools\node_modules\typescript\lib\typescript.js:33389:36)
    at narrowType (C:\Users\Jörg\AppData\Roaming\npm\node_modules\powerbi-visuals-tools\node_modules\typescript\lib\typescript.js:33616:32)
    at getTypeAtFlowCondition (C:\Users\Jörg\AppData\Roaming\npm\node_modules\powerbi-visuals-tools\node_modules\typescript\lib\typescript.js:33232:36)
    at getTypeAtFlowNode (C:\Users\Jörg\AppData\Roaming\npm\node_modules\powerbi-visuals-tools\node_modules\typescript\lib\typescript.js:33113:32)
    at getTypeAtFlowBranchLabel (C:\Users\Jörg\AppData\Roaming\npm\node_modules\powerbi-visuals-tools\node_modules\typescript\lib\typescript.js:33258:36)
    at getTypeAtFlowNode (C:\Users\Jörg\AppData\Roaming\npm\node_modules\powerbi-visuals-tools\node_modules\typescript\lib\typescript.js:33124:29)
    at getTypeAtFlowCondition (C:\Users\Jörg\AppData\Roaming\npm\node_modules\powerbi-visuals-tools\node_modules\typescript\lib\typescript.js:33218:32)
    at getTypeAtFlowNode (C:\Users\Jörg\AppData\Roaming\npm\node_modules\powerbi-visuals-tools\node_modules\typescript\lib\typescript.js:33113:32)
There are important files that Microsoft projects should all have that are not present in this repository. A pull request has been opened to add the missing file(s). When the pr is merged this issue will be closed automatically.
Microsoft teams can learn more about this effort and share feedback within the open source guidance available internally.
After NPM install, the original error changes to following:
C:\Users\reyang\PBI\barchart>pbiviz package
info Building visual...
error UNKNOWN { Error: ENOENT: no such file or directory, open 'C:\Users\reyang\PBI\barchart\node_modules\d3\d3.min.js'
at Object.fs.openSync (fs.js:646:18)
at Object.fs.readFileSync (fs.js:551:33)
at files.map.file (C:\Users\reyang\AppData\Roaming\npm\node_modules\powerbi-visuals-tools\lib\TypescriptCompiler.js:207:26)
at Array.map ()
at Promise (C:\Users\reyang\AppData\Roaming\npm\node_modules\powerbi-visuals-tools\lib\TypescriptCompiler.js:204:33)
at new Promise ()
at concatExternalJS (C:\Users\reyang\AppData\Roaming\npm\node_modules\powerbi-visuals-tools\lib\TypescriptCompiler.js:196:12)
at compileTypescript.then (C:\Users\reyang\AppData\Roaming\npm\node_modules\powerbi-visuals-tools\lib\TypescriptCompiler.js:261:29)
at
at process._tickCallback (internal/process/next_tick.js:188:7)
errno: -4058,
code: 'ENOENT',
syscall: 'open',
path: 'C:\Users\reyang\PBI\barchart\node_modules\d3\d3.min.js' }
How to fix this?
This documentation is rubbish.
Probably the biggest pile of garbage ever tentatively communicated for DIY by a worldwide company. This is so bad, it's worse than useless or unhelpful: it actually makes you want to uninstall PowerBi altogether and go back to play with Tableau and QlikView.
Were you guys tired? Go check some documentations on the web and see how they generally come with organized concepts and tutorials. The level of what you delivered is preposterous.
Yipi.
I copy the "module powerbi.extensibility.visual ..." code and the capabilities.json code and run it. The barchart works. No static object appears. objectEnumerationUtility.ts is located correctly. All that appears in the Objects well is Title/Background/Lock Aspect/General/Border.
I am using PowerBI Service (not desktop).
There should, based on the sample code, be a static 'show' object for 'enableAxis'.
[Edit] If I do a package build then the object ('enableAxis') appears in the well in the packaged vizualisation

A declarative, efficient, and flexible JavaScript library for building user interfaces.
🖖 Vue.js is a progressive, incrementally-adoptable JavaScript framework for building UI on the web.
TypeScript is a superset of JavaScript that compiles to clean JavaScript output.
An Open Source Machine Learning Framework for Everyone
The Web framework for perfectionists with deadlines.
A PHP framework for web artisans
Bring data to life with SVG, Canvas and HTML. 📊📈🎉
JavaScript (JS) is a lightweight interpreted programming language with first-class functions.
Some thing interesting about web. New door for the world.
A server is a program made to process requests and deliver data to clients.
Machine learning is a way of modeling and interpreting data that allows a piece of software to respond intelligently.
Some thing interesting about visualization, use data art
Some thing interesting about game, make everyone happy.
We are working to build community through open source technology. NB: members must have two-factor auth.
Open source projects and samples from Microsoft.
Google ❤️ Open Source for everyone.
Alibaba Open Source for everyone
Data-Driven Documents codes.
China tencent open source team.