Giter Club home page Giter Club logo

algebraofgraphics.jl's Introduction

AlgebraOfGraphics

CI codecov.io

Define an algebra of graphics based on a few simple building blocks that can be combined using + and *. Still somewhat experimental, may break often.

Acknowledgements

Analyses rely on StatsBase.jl, Loess.jl, KernelDensity.jl, and GLM.jl. Some of their documentation is transcribed here.

Visualizations are powered by Makie and its layouting capabilities.

Automatic legend creation re-implements the machinery in TabularMakie.

Logo and favicon made with ๐Ÿงก by @dyogurt.

algebraofgraphics.jl's People

Contributors

alecloudenback avatar asinghvi17 avatar cecileane avatar cossio avatar daschw avatar dmbates avatar ew-git avatar fabern avatar flyaflya avatar github-actions[bot] avatar greimel avatar haberdashpi avatar jeremiahpslewis avatar jfb-h avatar jkrumbiegel avatar jotas6 avatar knuesel avatar kronosthelate avatar michaelhatherly avatar musoke avatar nathanrboyer avatar onetonfoot avatar oxinabox avatar palday avatar piever avatar pitmonticone avatar rikhuijzer avatar simondanisch avatar timholy avatar

Stargazers

 avatar  avatar  avatar  avatar  avatar  avatar  avatar  avatar  avatar  avatar  avatar  avatar  avatar  avatar  avatar  avatar  avatar  avatar  avatar  avatar  avatar  avatar  avatar  avatar  avatar  avatar  avatar  avatar  avatar  avatar  avatar  avatar  avatar  avatar  avatar  avatar  avatar  avatar  avatar  avatar  avatar  avatar  avatar  avatar  avatar  avatar  avatar  avatar  avatar  avatar  avatar  avatar  avatar  avatar  avatar  avatar  avatar  avatar  avatar  avatar  avatar  avatar  avatar  avatar  avatar  avatar  avatar  avatar  avatar  avatar  avatar  avatar  avatar  avatar  avatar  avatar  avatar  avatar  avatar  avatar  avatar  avatar  avatar  avatar  avatar  avatar  avatar  avatar  avatar  avatar  avatar  avatar  avatar  avatar  avatar  avatar  avatar  avatar  avatar  avatar

Watchers

 avatar  avatar  avatar  avatar  avatar  avatar  avatar

algebraofgraphics.jl's Issues

Uninformative error for column typos

Currently, if one writes the name of a data column incorrectly and it's not found, the code errors when a findfirst call returning nothing is supposed to be coerced to an Int index. So the error thrown is:

ERROR: LoadError: MethodError: Cannot `convert` an object of type Nothing to an object of type Int64
Closest candidates are:
  convert(::Type{T}, ::AbstractPlotting.Unit) where T<:Number at C:\Users\krumbiegel\.julia\packages\AbstractPlotting\lGPof\src\units.jl:31 
  convert(::Type{T}, ::T) where T<:Number at number.jl:6
  convert(::Type{T}, ::Number) where T<:Number at number.jl:7
  ...
Stacktrace:
 [1] getcolumn(::AlgebraOfGraphics.ColumnDict, ::Symbol) at C:\Users\krumbiegel\.julia\packages\AlgebraOfGraphics\chGdQ\src\utils.jl:11     
 [2] extract_column(::AlgebraOfGraphics.ColumnDict, ::Pair{Symbol,typeof(identity)}) at C:\Users\krumbiegel\.julia\packages\AlgebraOfGraphics\chGdQ\src\context.jl:164

I would suggest that rather than writing a more informative message right at that point, this problem should be handled further up the chain so that we can say "invalid column name $xyz for keyword color / positional argument 2 / etc."

Legend attributes: `strokewidth` is not forwarded

using RDatasets: dataset
using AlgebraOfGraphics, AbstractPlotting, CairoMakie
mpg = dataset("ggplot2", "mpg")
cols = style(:Displ, :Hwy)
grp = style(color = :Cyl => categorical)
# grp1 = style(color = :col)
# mpg[!,:col] = mpg.Displ .+ rand(size(mpg, 1)) ./ 10

scat1 = spec(Scatter, marker='x')
scat2 = spec(Scatter, strokewidth = 0, marker='x')

data(mpg) * grp * scat1 * cols |> draw |> s -> save("/tmp/grp1.png", s)
data(mpg) * grp * scat2 * cols |> draw |> s -> save("/tmp/grp2.png", s)

grp1

thus, the colours in the legend are not distinguishable

grp2

Rename style and spec

I still get confused by the meaning of these. To me that suggests a better naming might be needed.

Style sounds to me like what spec is doing and spec sounds more like what style is doing. Both are not very clear about their use.

Style is explained as "the mapping from data to plot" so I'd suggest renaming it to mapping.

spec controls any other settings a grouping might have, so maybe settings would be good

Multiple legends cleanup

Two issues at the moment:

  • It often tries to superimpose things when it shouldn't (should be solved with #56)
  • Things like marker legend should be black, rather than taking the color from the first series (may need to use manually LegendElement).

How to pass multiple pre-grouped vectors?

I have a data transformation pipeline that returns a vector of vectors with floats, and a vector of strings, which name the groups. This doesn't work:

vecs = [randn(100) for _ in 1:10]
names = string.(1:10)

data((vecs = vecs, names = names)) * ...

But concatenating all the vectors into one works. This seems an unnecessary step as it forces me to create a long-format table. Is there a better way?

recipe for Complex not working when using AlgebraOfGraphics

Env:
os -> macOS 10.15.7
julia version -> 1.5.2
Makie version -> 0.11.1
AlgebraOfGraphics version -> 0.2.0

I extended Makie to plot Complex:

  using Makie, AbstractPlotting

  function Makie.convert_arguments(P::AbstractPlotting.PointBased, c::Complex)
    ([Point2f0(real(c), imag(c))],)
  end
  AbstractPlotting.plottype(::Complex) = Scatter

  function Makie.convert_arguments(::AbstractPlotting.PointBased, cs::AbstractVector{Complex{T}} where T)
    (Point2f0.(real(cs), imag(cs)),)
  end
  AbstractPlotting.plottype(::Vector{Complex{T}} where T) = Lines

works ok when invoke with Makie api: plot([1 + 2im, 2 + 3im]), but when using AlgebraOfGraphics api: mapping([1 + 2im, 2 + 3im]) |> draw I get below error:

ERROR: MethodError: no method matching isless(::Complex{Float64}, ::Complex{Float64})
Closest candidates are:
  isless(::Missing, ::Any) at missing.jl:87
  isless(::CategoricalArrays.CategoricalValue, ::Any) at /Users/fuchengxu/.julia/packages/CategoricalArrays/0ZAbp/src/value.jl:142
  isless(::Any, ::Missing) at missing.jl:88
  ...
Stacktrace:
 [1] max(::Complex{Float64}, ::Complex{Float64}) at ./operators.jl:417
 [2] _extrema_itr at ./operators.jl:489 [inlined]
 [3] _extrema_dims at ./multidimensional.jl:1585 [inlined]
 [4] #extrema#452 at ./multidimensional.jl:1572 [inlined]
 [5] extrema(::Array{Complex{Float64},1}) at ./multidimensional.jl:1572
 [6] get_extrema(::Array{AlgebraOfGraphics.Spec{Any},1}) at /Users/fuchengxu/.julia/packages/AlgebraOfGraphics/dDwlr/src/scales.jl:48
 [7] computescales(::Array{AlgebraOfGraphics.Spec{Any},1}) at /Users/fuchengxu/.julia/packages/AlgebraOfGraphics/dDwlr/src/scales.jl:70
 [8] run_pipeline(::AlgebraOfGraphics.Mapping) at /Users/fuchengxu/.julia/packages/AlgebraOfGraphics/dDwlr/src/specs.jl:70
 [9] layoutplot!(::Scene, ::GridLayoutBase.GridLayout, ::AlgebraOfGraphics.Mapping) at /Users/fuchengxu/.julia/packages/AlgebraOfGraphics/dDwlr/src/draw.jl:98
 [10] layoutplot(::AlgebraOfGraphics.Mapping; kwargs::Base.Iterators.Pairs{Union{},Union{},Tuple{},NamedTuple{,Tuple{}}}) at /Users/fuchengxu/.julia/packages/AlgebraOfGraphics/dDwlr/src/draw.jl:190
 [11] layoutplot at /Users/fuchengxu/.julia/packages/AlgebraOfGraphics/dDwlr/src/draw.jl:189 [inlined]
 [12] #draw#117 at /Users/fuchengxu/.julia/packages/AlgebraOfGraphics/dDwlr/src/draw.jl:194 [inlined]
 [13] draw at /Users/fuchengxu/.julia/packages/AlgebraOfGraphics/dDwlr/src/draw.jl:194 [inlined]
 [14] |>(::AlgebraOfGraphics.Mapping, ::typeof(draw)) at ./operators.jl:834
 [15] top-level scope at REPL[21]:1

Label plot error

Is this a bug?

(
data(DataFrame(x=[1,2,3], y=[10,20,30], msg=["hello", "world", "!"])) 
* mapping(:x, :y, label=:msg) 
* visual(Label)
) |> draw

# ERROR: Plotting for the arguments (::DataType, ::Attributes, ::SubArray{Int64,1,Array{Int64,1},Tuple{Array{Int64,1}},false}, ::SubArray{Int64,1,Array{Int64,1},Tuple{Array{Int64,1}},false}) not defined. If you want to support those arguments, overload plot!(plot::Plot(DataType, Attributes, SubArray{Int64,1,Array{Int64,1},Tuple{Array{Int64,1}},false}, SubArray{Int64,1,Array{Int64,1},Tuple{Array{Int64,1}},false}))

Styling specs hidden in analyses

You can style specs by passing keywords to them:

spec(Scatter, markersize = 5)

What if we have an analysis that plots scatter plots and error bars?

mean_and_error = Analysis(function(x, y)
    # compute means and errors...

    # return AoG objects
    style(x, mean) * spec(Scatter) + style(x, error) * spec(LineSegments)
end)
data(x, y) * mean_and_error

How should users then be able to style those two specs?

A few legend + color questions

  1. Is there a way to suppress the legend resulting from style(color = ...)?
  2. Also, I've got something like (plot1 + plot2) |> draw and each has a style(color = ...), and the colors are repeated in the legend. Anyway to get plot1 and plot2 to draw from the same pool of colors to avoid conflicts?
  3. Or to specify the colors manually (so I can ensure they don't conflict)?

Markersize bugs

Using marker size doesn't show a legend and errors if a categorical variable is used.

using RDatasets: dataset
using AlgebraOfGraphics, AbstractPlotting, CairoMakie
mpg = dataset("ggplot2", "mpg")
cols = style(:Displ, :Hwy)

mpg[!,:col] = mpg.Displ .+ rand(size(mpg, 1)) ./ 10

grp1 = style(markersize = :Cyl)
grp2 = style(markersize = :Cyl => categorical)
scat = spec(Scatter)

data(mpg) * grp1 * scat * cols |> draw # no legend
data(mpg) * grp2 * scat * cols |> draw  #error 

mksz1

Multiple groupings are incorrect

MWE:

using DataFrames, AlgebraOfGraphics, CairoMakie, AbstractPlotting

df = DataFrame(grp1 = [0.0, 1.0, 0.0, 1.0],
               grp2 = [0.0, 0.1, 0.1, 0.0])

df = [df; df]

transform!(df, [:grp1, :grp2] => (+) => :y)
df[!,:x] = [0,0,0,0, 1,1,1,1]

data(df) * style(:x, :y, color= :grp1 => categorical, linestyle = :grp2 => categorical) * spec(Lines) |> draw #|> x -> save("/tmp/aog-bug.png", x)

aog-bug

The horizontal line at y = 1.0 should be solid.

Disentangle rendering and specification

They had started quite distinct and got a bit entangled. It's probably worth it to create a (documented!) structure that holds all the necessary information and define a rendering method on top of it.

This may also help with #136 (as now the simpler code to render it is orthogonal to the "algebraic syntax"), and it should allow to support grouping and styling with a more "Makie-like" syntax.

First predicted value of `smooth` is NaN

I noticed this because it shows a bug in CairoMakie, which causes the second point of the line to be connected to the graphic's origin, while the first point is missing. You can see it in your docs, too. The first smooth has a straight line jutting off on the left.

While I'm going to fix this in CairoMakie, so that a NaN in first position doesn't trip it up, I guess you still want to fix it here as well.

grafik

How to deal with plotting functions where positional args are not necessarily x and y

For example, all the flipped versions of plotting functions, like a vertical density, or a horizontal boxplot. I guess AlgebraOfGraphics would not necessarily complain about such a function, but the axis labels would be wrong if the assumption is that the first argument is always x and the second always y. How can this be made generic?

Faceting with empty panels is broken

After your comment in #46 I tried this on master and this currently broken.

Pkg.pkg"add https://github.com/JuliaPlots/CairoMakie.jl#pv/update"
using RDatasets, CairoMakie, AbstractPlotting, AlgebraOfGraphics
using Underscores, DataFrames

mpg = dataset("ggplot2", "mpg")
mpg[!,:grpx] .= rand.(Ref(["a", "b", "c"]))
mpg[!,:grpy] .= rand.(Ref(["aa", "bb"]))

# remove data to get empty panels
dta = @_ mpg |> 
    filter(!((_.grpx == levels(__.grpx)[1]) & (_.grpy == levels(__.grpy)[1])), __) |>
    filter(!((_.grpx == levels(__.grpx)[2]) & (_.grpy == levels(__.grpy)[2])), __) |>
    data
    

cols = style(:Displ, :Hwy)
grp = style(color = :Cyl => categorical, layout_x = :grpx, layout_y = :grpy)
scat = spec(Scatter)
pipeline = cols * scat
aog = dta * grp * pipeline
scn = aog |> draw

empty-panels

I would expect there to be x and y labels everywhere.

Axis labels don't show up

I've been trying to follow the first example in the 0.1.2 tutorial, but the axis labels don't show up for me:

scatter

(with SVG or PNG, but Github doesn't let me upload the SVG). This was produced by cloning the repo, checking out the 0.1.2 tag, starting Julia 1.4.2 with julia --project=docs, doing ] dev . to dev AlgebraOfGraphics, then running the tutorial code.

I think it must be due to different versions of dependencies and transitive dependencies, but I've been having a lot of trouble tracking it down. There is some weird stuff, like the 0.1.2 tag of AlgebraOfGraphics has AbstractPlotting compat'd to 0.12 but the checked-in docs manifest has Abstractplotting at 0.9.27. I think what happens is that in the Pkg.develop step of the Travis docs build the package resolver chooses new versions of all the dependencies and updates its local copy of the Manifest, then generates the docs, and that Manifest is never checked in (which also happens with my local ] dev . step). So I'm not actually sure how to repro the docs environment to try to get axis labels. However, if you want to repro my environment that does not have axis labels, here's the Manifest and Project I get after ] dev . in the docs project:

no-axis-label-env.zip

By the way, I think the reproducibility problem for the docs build can be solved by checking in a Manifest with AlgebraOfGraphics already dev'd by a relative path, and then not deving it during the docs build step, to not let the resolver alter the Manifest.

Customizing aspects other than plot attributes

There are settings that don't relate to specific plot objects (which can be passed in spec calls). Examples are column and row gaps in facet layouts, the color and style of the facet labels. The facets appear because style(layout_x = :some_variable) is used, so where would be a good place to customize this behavior and pass additional kwargs?

Another example that comes to mind is renaming legend titles, entries, x/ylabels etc. GGplot uses some extra functions for that which you add to the whole command chain, I think.

I was wondering if you thought about this already, as so far some things seem to be hard-coded for simplicity.

Tweaking a plot

I am posting examples of how to tweak a plot for future reference. When I find time I will set up a docs PR including what I posted in #40 and #42 (unless a more convenient way to achieve theses things is implemented).

Simple baseline plot

using AbstractPlotting, CairoMakie, MakieLayout, AlgebraOfGraphics

N = 500
x = rand(N)
df = DataFrame(x = x, y = x .+ randn(N))

cols = style(:x, :y)
scat = spec(Scatter)
pipeline = cols * scat
aog_simple = data(df) * pipeline

aog_simple |> draw

scene, layout = MakieLayout.layoutscene()

AlgebraOfGraphics.layoutplot!(scene, layout, aog_simple)

simple-aog

Adjusting color and transparency

grd_lay = layout.content[1].content # get the `GridLayout`
lax = grd_lay.content[1].content # get the `LAxis`
lax.scene.plots[1].color[] = (:red, 0.5)

simple-aog-color-alpha

Adjusting the legend position

Is there a way to adjust the legend position?

Is there a way to access the legend of a plot?

In MakieLayout it seems to be easy to move stuff around (and also adjusting things like orientation). But I guess, the output of a AoG plot is a plain scene, and not a (scene, layout), right?

Error when using `spec(Band)`

Here is a MWE.

using AlgebraOfGraphics, CairoMakie
using AbstractPlotting: Scatter, Band, Lines

using Statistics, DataFrames

N = 3

df = mapreduce(vcat, 1:N) do i
  n, m = 100, 101
  t = range(0, 1, length=m)
  X = cumsum(randn(n, m), dims = 2)
  X = X .- X[:, 1]
  ฮผ = vec(mean(X, dims=1)) # mean

  sd = vec(std(X, dims=1))  # stddev
  
  lo = ฮผ - sd
  hi = ฮผ + sd

  df = DataFrame(:ฮผ => ฮผ, :t => t, :sd => sd, :grp => fill("grp $i", m), :lo => lo, :hi => hi)
end

dta = df |> data
cols = style(:t, :ฮผ)
grp = style(color = :grp)
geom = spec(Lines)

dta * cols * grp * geom |> draw

cols = style(:t, :lo, :hi)
grp = style(color = :grp)
geom = spec(Band)

dta * cols * grp * geom |> draw
Stack trace
KeyError: key :zlabel not found
getindex at dict.jl:467 [inlined]
getindex(::AbstractPlotting.Attributes, ::Symbol) at dictlike.jl:99
getproperty(::AbstractPlotting.MakieLayout.LAxis, ::Symbol) at lobject.jl:17
set_axis_labels!(::AbstractPlotting.MakieLayout.LAxis, ::Tuple{Symbol,Symbol,Symbol}) at draw.jl:12
layoutplot!(::AbstractPlotting.Scene, ::GridLayoutBase.GridLayout, ::AlgebraOfGraphics.Spec{Band{...}}) at draw.jl:49
#layoutplot#90 at draw.jl:178 [inlined]
layoutplot at draw.jl:177 [inlined]
#draw#94 at draw.jl:182 [inlined]
draw at draw.jl:182 [inlined]
|>(::AlgebraOfGraphics.Spec{Band{...}}, ::typeof(draw)) at operators.jl:834
top-level scope at aog-dev.jl:35
include_string(::Function, ::Module, ::String, ::String) at loading.jl:1088

Categorical-axis heatmap

df = DataFrame(a=[1,2, 1,2], b=[3,3,4,4], value=[10, 20, 30, 40])
data(df) * mapping(:a => categorical, :b => categorical, color=:value) * visual(Heatmap) |> draw

There was no `AbstractPlotting.convert_arguments` overload found for
the plot type Combined{AbstractPlotting.heatmap,Tuple{Array{Int64,1},Array{Int64,1}}}, or its conversion trait AbstractPlotting.SurfaceLike().
The arguments were:
(Array{Int64,1}, Array{Int64,1})

To fix this, define `AbstractPlotting.convert_arguments(::Combined{AbstractPlotting.heatmap,Tuple{Array{Int64,1},Array{Int64,1}}}, ::Array{Int64,1}, ::Array{Int64,1})`.

I think this should work but I might be missing something.

Roadmap

Laundry list of things to improve, or questions to discuss.

TODOs

  • Avoid recomputing things. The default grouping strategy is suboptimal: if there are many traces with the same grouping, it will redo the sorting each time. Though, to be honest, I wonder whether there are cases where the sorting is the bottleneck (compared to say actually plotting things). Also column selection can be made more efficient by using Tables.select and Tables.columnindex, instead of calling Tables.columns on the whole table. (mostly fixed by the Tree strategy in #14)

  • Keep column names for labeling axes or legend groups (maybe extract_column could return a NamedDimsArray). (#24)

  • Legend support. (#23)

  • Layout support (behind a Require block, 477a2b8)

  • Fix odd bugs with categorical variables. If different groups have different unique entries, the categorical conversion screws up (may be fixed from the AbstractPlotting side, see MakieOrg/Makie.jl#453).

  • Add slicing context, i.e. columns are series and similar. (#17)

  • Decide on Series data layout (tree: #14)

  • Add devdocs (#21)

Probably not happening (in favor of deprecating StasMakie)

  • Get it to work with Analysis from StatsMakie whenever they rely on all the data for some preprocessing (may need to happen on StatsMakie side, but can start here using Require).

  • Get it to work with Position.stack, Position.dodge & co (same as above).

Scale things so text doesn't overlap other objects

Sometimes a facet label text overlaps its bounding box or two scales have text that touch. These fonts could be scaled down to fit inside the container or the box could be scaled up to fit the text or both.

image

image

Is this issue a better fit for here or for AbstractPlotting?

issue multiplying two categorical mappings

MWE:

julia> using AlgebraOfGraphics, DataFrames

julia> df = DataFrame(i=[1,2,1,2], c=[1,1,1,1], variable=[:a,:a,:b,:b], value=[10,20,30,40])
4ร—4 DataFrame
 Row โ”‚ i      c      variable  value 
     โ”‚ Int64  Int64  Symbol    Int64 
โ”€โ”€โ”€โ”€โ”€โ”ผโ”€โ”€โ”€โ”€โ”€โ”€โ”€โ”€โ”€โ”€โ”€โ”€โ”€โ”€โ”€โ”€โ”€โ”€โ”€โ”€โ”€โ”€โ”€โ”€โ”€โ”€โ”€โ”€โ”€โ”€โ”€
   1 โ”‚     1      1  a            10
   2 โ”‚     2      1  a            20
   3 โ”‚     1      1  b            30
   4 โ”‚     2      1  b            40

julia> p = data(df) * mapping(:value, color = :c => categorical) * mapping(layout_x = :variable)
ERROR: MethodError: no method matching AlgebraOfGraphics.DataContext(::AlgebraOfGraphics.ColumnDict, ::NamedTuple{(:color, :layout_x), Tuple{NamedDims.NamedDimsArray{(:c,), CategoricalArrays.CategoricalValue{Int64, UInt32}, 1, CategoricalArrays.CategoricalVector{Int64, UInt32, Int64, CategoricalArrays.CategoricalValue{Int64, UInt32}, Union{}}}, NamedDims.NamedDimsArray{(:variable,), CategoricalArrays.CategoricalValue{Symbol, UInt32}, 1, CategoricalArrays.CategoricalVector{Symbol, UInt32, Symbol, CategoricalArrays.CategoricalValue{Symbol, UInt32}, Union{}}}}}, ::Nothing)
Closest candidates are:
  AlgebraOfGraphics.DataContext(::AlgebraOfGraphics.ColumnDict, ::NT, ::I) where {NT, I<:AbstractVector{Int64}} at /home/pietro/.julia/packages/AlgebraOfGraphics/X3avF/src/context.jl:93
  AlgebraOfGraphics.DataContext(::Any) at /home/pietro/.julia/packages/AlgebraOfGraphics/X3avF/src/context.jl:98
Stacktrace:
 [1] _merge(c::AlgebraOfGraphics.DataContext{NamedTuple{(:color,), Tuple{NamedDims.NamedDimsArray{(:c,), CategoricalArrays.CategoricalValue{Int64, UInt32}, 1, CategoricalArrays.CategoricalVector{Int64, UInt32, Int64, CategoricalArrays.CategoricalValue{Int64, UInt32}, Union{}}}}}, Vector{Int64}}, s1::AlgebraOfGraphics.Mapping, s2::AlgebraOfGraphics.Mapping)
   @ AlgebraOfGraphics ~/.julia/packages/AlgebraOfGraphics/X3avF/src/context.jl:138
 [2] merge(s1::AlgebraOfGraphics.Mapping, s2::AlgebraOfGraphics.Mapping)
   @ AlgebraOfGraphics ~/.julia/packages/AlgebraOfGraphics/X3avF/src/context.jl:30
 [3] *
   @ ~/.julia/packages/AlgebraOfGraphics/X3avF/src/context.jl:21 [inlined]
 [4] *(::AlgebraOfGraphics.DataContext{NamedTuple{, Tuple{}}, Base.OneTo{Int64}}, ::AlgebraOfGraphics.Mapping, ::AlgebraOfGraphics.Mapping)
   @ Base ./operators.jl:540
 [5] top-level scope
   @ REPL[47]:1
``

Unique naming to columns

In the pair syntax (e.g. :a => categorical), give names that take the function into account (as does DataFrames).

Add legends for analyses

I have some Analyses on a plot, such as a linear fit and a smoother, in different colors. I would like it to create a legend that shows what the lines mean.

let N = 1000
(
    data(DataFrame(a=rand(N), b=rand(N)))
    * mapping(:a, :b)
    * (
        visual(Scatter, markersize=2)
        + AlgebraOfGraphics.linear() * visual(color=:teal)
        + AlgebraOfGraphics.smooth(span=0.1) * visual(color=:pink)
    )
)|> draw(resolution=(800,600))
end

image

Facet vs layout

Probably faceting and layouting could be two different options in this package. Faceting is for grouping data, layouting for plotting different variables (as in your example in the docs)

First, layouting.

N = 500
x = rand(N)
gx = rand(["x grp 1","x grp 2", "x grp 3"], N)
gy = rand(["y grp 1","y grp 2"], N)

df = DataFrame(g = g, x = x, y = (g .== "very") .+ x .+ randn(N), gx=gx, gy=gy)

cols = style(:x, :y);
grp = style(layout_x=:gx, layout_y=:gy)
scat = spec(Scatter)
pipeline = cols * scat
aog = data(df) * grp * pipeline

layout

Now faceting, in the ggplot sense.
facet

scene, layout = MakieLayout.layoutscene(fontsize=35, font="CMU Serif roman", resolution=round.(Int, (2 * 600, 2 * 540)))
layout.alignmode = Outside(0, 25, 0, 5)

AlgebraOfGraphics.layoutplot!(scene, layout, aog)
AbstractPlotting.save(joinpath("figures/layout.pdf"), scene)

x_facet_titles = sort!(unique(gx))
y_facet_titles = sort!(unique(gy))

grd_lay = layout.content[1].content

# remove xlabel and ylabel
for i in 1:length(grd_lay.content)
  ax = grd_lay.content[i].content
  ax.xlabelvisible[] = length(x_facet_titles) == 0
  ax.ylabelvisible[] = length(y_facet_titles) == 0
end

# add categories of x_facet variable and linked x_label
if length(x_facet_titles) > 0
  lax11 = grd_lay.content[1].content
  n = size(grd_lay)[1]
  for (i,t) in enumerate(x_facet_titles)
    text = LText(scene, t)
    text.tellheight = true
    text.tellwidth = false
    grd_lay[1,i,Top()] = LRect(scene, color = RGBAf0(0,0,0,0.2), strokevisible=false) 
    grd_lay[1,i,Top()] = text
  end
  
  xlabel_facet = LText(scene, string(lax11.xlabel[]))
  xlabel_facet.tellheight = true
  xlabel_facet.tellwidth = false
  grd_lay[end+1,:] = xlabel_facet
end

# add categories of y_facet variable and linked y_label
if length(y_facet_titles) > 0
  lax11 = grd_lay.content[1].content
  n = size(grd_lay)[2]
  for (i,t) in enumerate(y_facet_titles)
    text = LText(scene, t, rotation=ฯ€/2)
    text.tellheight = false
    text.tellwidth = true
    grd_lay[i,n, Right()] = LRect(scene, color = RGBAf0(0,0,0,0.2), strokevisible=false) 
    grd_lay[i,n, Right()] = text
  end
  
  ylabel_facet = LText(scene, string(lax11.ylabel[]), rotation = ฯ€/2)
  ylabel_facet.tellheight = false
  ylabel_facet.tellwidth = true
  grd_lay[1:end-1,0] = ylabel_facet
end

Avoid giving marker attributes to lines

MWE:

using AlgebraOfGraphics, GLMakie
using RDatasets: dataset
iris = dataset("datasets", "iris")
cols = style(:SepalLength, :PetalLength, marker=:Species)
geom = spec(:Scatter) + AlgebraOfGraphics.linear
data(iris) * cols * geom |> draw |> display
ERROR: MethodError: no method matching gl_convert(::Symbol)
Closest candidates are:
  gl_convert(!Matched::GLMakie.GLAbstraction.GLProgram, !Matched::Any) at /home/pietro/.julia/packages/GLMakie/Y3YHT/src/GLAbstraction/GLShader.jl:114
  gl_convert(!Matched::Nothing) at /home/pietro/.julia/packages/GLMakie/Y3YHT/src/GLAbstraction/GLUniforms.jl:200
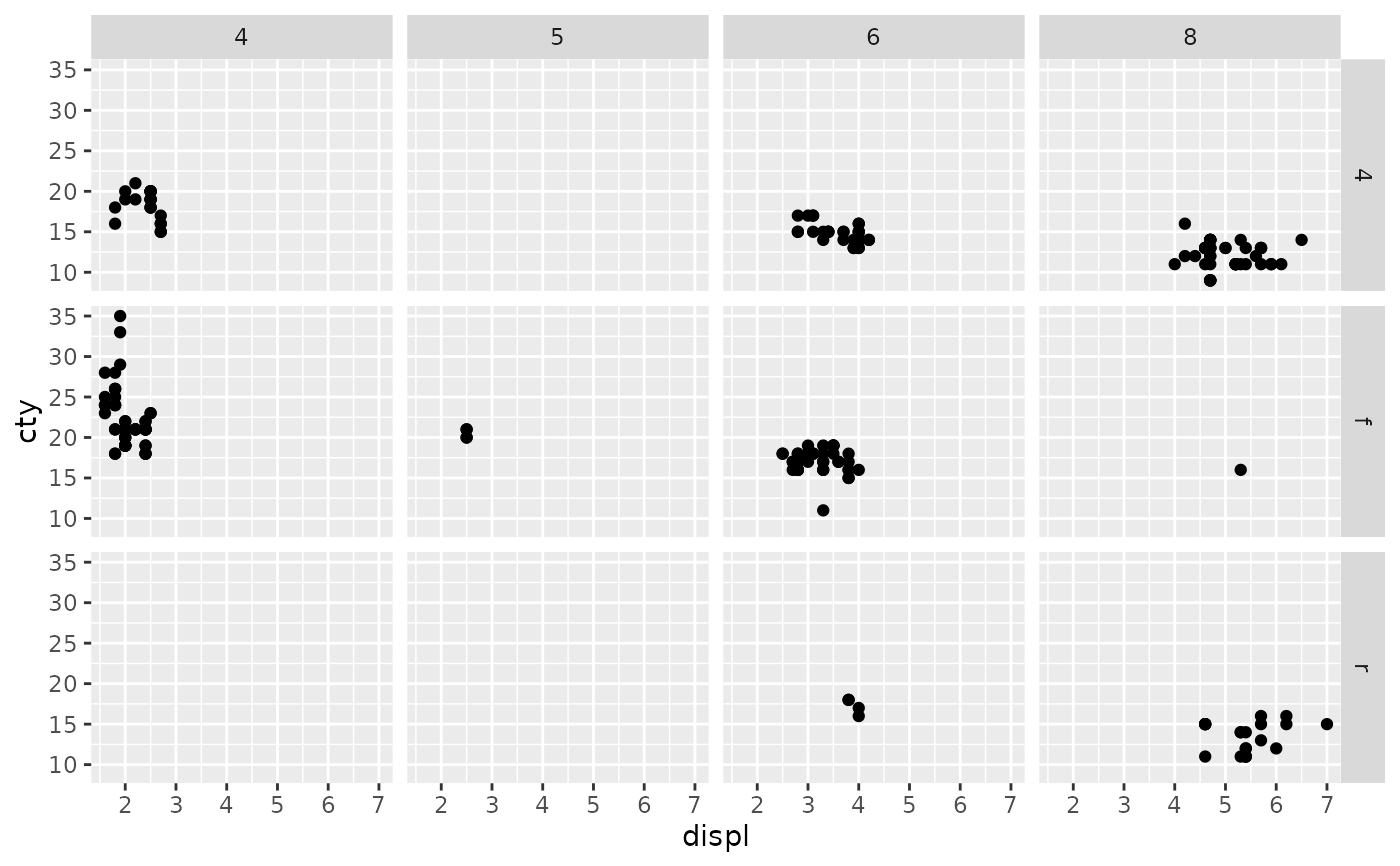
  gl_convert(!Matched::GLMakie.GLAbstraction.AbstractLazyShader, !Matched::Any) at /home/pietro/.julia/packages/GLMakie/Y3YHT/src/GLAbstraction/GLShader.jl:218

Show facet axis label

image

It would be nice to show "Cylinders" for the horizontal and "Drive" for the vertical. That could be above and on the right respectively, but to support nested facets it would be in the corners instead.

image

Allow customization of atomic elements

So far, one can add any atomic AbstractSimple element to the pipeline, however by default, when the AbstractElement of the algebra of graphics (a combination of Group, Data, etc...) is converted to traces, they are simply kept as metadata (see source). It would be interesting to understand what other types of "atomic types" would be interesting here, and how it would be possible to overload the pipeline externally.

cc: @sethaxen, you were mentioning Condition for probabilistic grammar of graphics, what behavior do you expect from it?

Titles for facets

I think it would be good to put titles above facets as well, because in many use cases it's not super clear from the facet labels which grouping variable they came from. For example if you have two groups with members 1, 2 and 3, you wouldn't know which one's which.

StatsMakie redesign

This is an attempt to condensate the"grammar of graphics" like part of StatsMakie in a stand-alone, low-dependency package.

The current design is as follows. The basic building blocks are similar to the current building blocks of StatsMakie: Analysis, Group, Select (name to be decided), and Data. On top of them, they can be combined algebraically using โŠ— and โŠ• (if I'm sure this does not lead to piracy, * and + would also be an option).

This is the envisioned syntax.

spec = Data(mpg) โŠ— Select(:Displ, :Hwy)
scatter(spec)

scatter

scatter(spec โŠ— Group(Marker = :Cyl, color = :Year))
# maybe also
scatter(spec, Group(Marker = :Cyl, color = :Year))

scatter_group1

plot((Scatter โŠ• linear) โŠ— spec โŠ— Group(color = :Cyl))
# maybe also
plot(Scatter โŠ• linear, spec, Group(color = :Cyl))

scatter_analysis

The main technical decisions IMO are the following.

In this proof of concept, Select encompasses both positional and keyword arguments (i.e. Select(col1, col2, markersize = col3)), and Analysis takes a Select and returns a Select. This simplifies things a bit but now scatter(Data(mpg), :Hwy, :Displ) needs to be scatter(Data(mpg), Select(:Hwy, :Displ)). Maybe one can assume that all the non-group arguments after the data are part of Select. At the other end of the spectrum, one could avoid Select altogether with NamedTuples as we do here for example.

There is a function traces that computes the traces. So far, in the most general case, it returns a list of metadata => Vector{Trace} objects. Each metadata => Vector{Trace} corresponds to a product in the expansion of the plot specification. For example traces((Scatter โŠ• linear) โŠ— spec โŠ— Group(color = :Cyl)) would return ((Scatter,) => some_traces, (linear,) => some_other_traces), where the some_traces are one per value of :Cyl. Choosing exactly what this looks like is important because this is what the plotting package needs to be able to plot. Each Trace has some attributes (which come from the grouping), as well as a Select that gives the values of positional and keyword arguments that come from the overall Select (potentially transformed by an Analysis).

Final point is whether the โŠ— and โŠ• syntax (or + and *) is actually better than maybe just multiple arguments and commas. The comparison would be between:

plot((Scatter โŠ• linear) โŠ— spec โŠ— Group(color = :Cyl)) # option 1
plot((Scatter + linear) * spec * Group(color = :Cyl)) # option 2
plot(Scatter โŠ• linear, spec, Group(color = :Cyl)) # option 3
plot(Scatter + linear, spec, Group(color = :Cyl)) # option 4
plot((Scatter, linear), spec, Group(color = :Cyl)) # option 5

I kind of like that one can use the "distributive law" in option 1 and 2 to understand what will happen.

I suspect this is not orthogonal to the previous discussion on Select, as using a "custom type" will probably allow to use a Base operator.

Histogram of integers

Currently integers aren't supported. That might actually be a good thing because it's ambiguous whether they should be treated as discrete or continuous, and it's easy for the user to convert. But it's worth thinking about.

data(DataFrame(x=sample(1:100, 10000))) * mapping(:x) * AlgebraOfGraphics.histogram(bins=200) |> draw

MethodError: no method matching floatrange(::Float64, ::Int64, ::Float64, ::Float64)

Legend for barplot

This doesn't generate a legend but it could.

(
        data(DataFrame(value=randn(2000), group=rand(["a", "b"], 2000))) 
        * mapping(:value, color=:group => categorical)
        * AlgebraOfGraphics.histogram
) |> draw


Warning: Automated legend was not possible due to ErrorException("    There is no `legendelements` method defined for plot type Combined{AbstractPlotting.barplot,Tuple{Array{Point{2,Float32},1}}}. This means\n    that you can't automatically generate a legend entry for this plot type.\n    You can overload this method for your plot type that returns a `LegendElement`\n    vector, or manually construct a legend entry from those elements.\n")

TagBot trigger issue

This issue is used to trigger TagBot; feel free to unsubscribe.

If you haven't already, you should update your TagBot.yml to include issue comment triggers.
Please see this post on Discourse for instructions and more details.

Categorical cleanup

Decide if:

  1. we need CategoricalArrays at all? Should PooledArrays and discrete scales be enough?
  2. how to handle categorical variables in x, y axes (the default grouping behavior may not make a lot of sense).

Changing 2) might make the dependency on GeometryBasics to plot geometries unnecessary.

Nested facets

It would be nice to have nested facets like mapping(:bill, :tip, layout_x=[:smoking, :day], layout_y=[:gender, :meal])

image

Enhancement proposal: reduce code complexity, improve legends, allow non-incremental plots (for grouped bar)

Hi @piever,

When working on #91, #84 I found that the pipeline currently is too complex for me to fully grasp and also too complex to make progress on these two PRs. Since I want to use the Makie ecosystem for all my plots, I wrote a lighter version of this package (it's probably closer to StatsMakie) that fits in one Pluto notebook.

It improves on this package in the following ways

  • code becomes clearer: generation of plot and legend are completely disentangled
  • legends are created manually (solves #57, #88)
  • legends are created for continuous styles like markersize (solves #83)
  • automatically add colorbars (solves #82)
  • there are two modes for plot generation: AllAtOnce and Incremental. Each plot type can specify it's own mode (but I guess Incremental will be the default). With this and JuliaPlots/AbstractPlotting.jl#580 we can cover grouped bar plots.
  • we return the main plot, legend and colorbar separately, so that the user can adjust their attributes (including position) after the fact (solves #40)
  • add layout_wrap (solves #130)

What it doesn't handle

  1. only supports data frames (no slicing context)
  2. doesn't deal with analyses
  3. it doesn't handle labelling of x and y axes and categorical ticks

(While 1. and 2. need some thought, 3. will be really easy to address)

EDIT: the updated code is here: https://github.com/greimel/TabularMakie.jl

Here is the notebook https://gist.github.com/greimel/7bef42c2b41dec22650f8c0262bd8b5f
here is a static preview http://htmlpreview.github.io/?https://gist.githubusercontent.com/greimel/7bef42c2b41dec22650f8c0262bd8b5f/raw/15fa97618e34a991379a47e810f3a9b39366f9b4/illustration.jl.html

and at the bottom there are some plots from the notebook.

Let me know if you like this approach then we can discuss how it can be possible to integrate this either in StatsMakie or AlgebraOfGraphics.

Please also let me know if you immediately see why this approach cannot work with the slicing approach or the composability of your AlgebraicDict.

lplot(Lines, ts_df, :t, :v; color = :g_co, layout_x = :g_la, linestyle = :g_ls, linewidth = 2)

image

lplot(BarPlot, bar_df, :grp_x, :y; dodge = :grp_dodge, stack = 
		:grp_stack, color = :grp_stack, layout_x = :g_la)

image

lplot(Scatter, cs_df, :xxx, :yyy; color = :s_c, marker = :g_m,  markersize = :s_m, layout_y = :g_lx)

image

Recommend Projects

  • React photo React

    A declarative, efficient, and flexible JavaScript library for building user interfaces.

  • Vue.js photo Vue.js

    ๐Ÿ–– Vue.js is a progressive, incrementally-adoptable JavaScript framework for building UI on the web.

  • Typescript photo Typescript

    TypeScript is a superset of JavaScript that compiles to clean JavaScript output.

  • TensorFlow photo TensorFlow

    An Open Source Machine Learning Framework for Everyone

  • Django photo Django

    The Web framework for perfectionists with deadlines.

  • D3 photo D3

    Bring data to life with SVG, Canvas and HTML. ๐Ÿ“Š๐Ÿ“ˆ๐ŸŽ‰

Recommend Topics

  • javascript

    JavaScript (JS) is a lightweight interpreted programming language with first-class functions.

  • web

    Some thing interesting about web. New door for the world.

  • server

    A server is a program made to process requests and deliver data to clients.

  • Machine learning

    Machine learning is a way of modeling and interpreting data that allows a piece of software to respond intelligently.

  • Game

    Some thing interesting about game, make everyone happy.

Recommend Org

  • Facebook photo Facebook

    We are working to build community through open source technology. NB: members must have two-factor auth.

  • Microsoft photo Microsoft

    Open source projects and samples from Microsoft.

  • Google photo Google

    Google โค๏ธ Open Source for everyone.

  • D3 photo D3

    Data-Driven Documents codes.