
pyecharts-snapshot renders the output of pyecharts as a png, jpeg, gif image or a pdf file at command line or in your code.
Get png:
$ snapshot render.htmlAnd you will get:
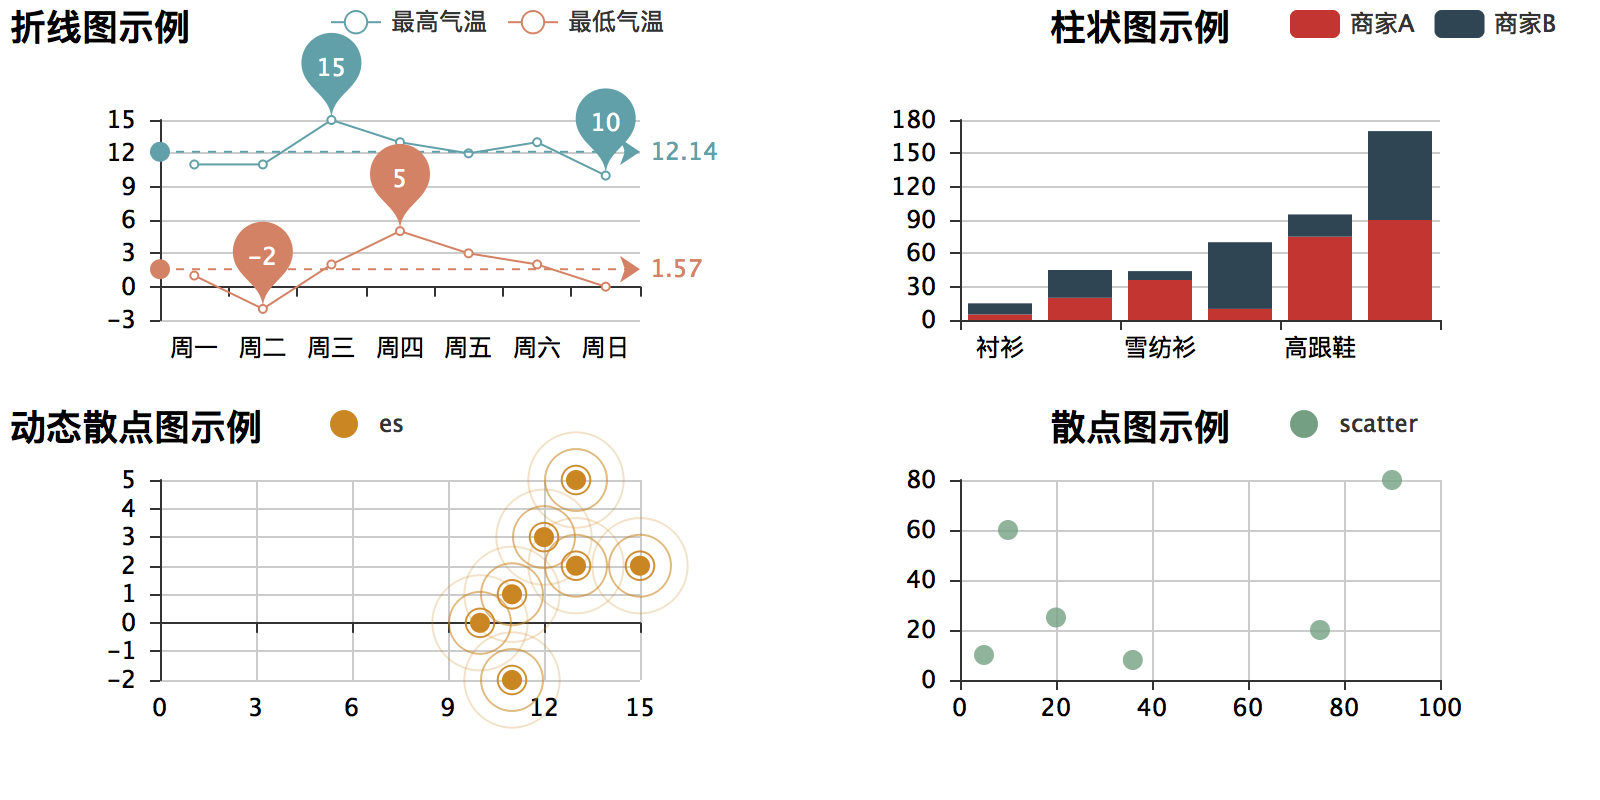
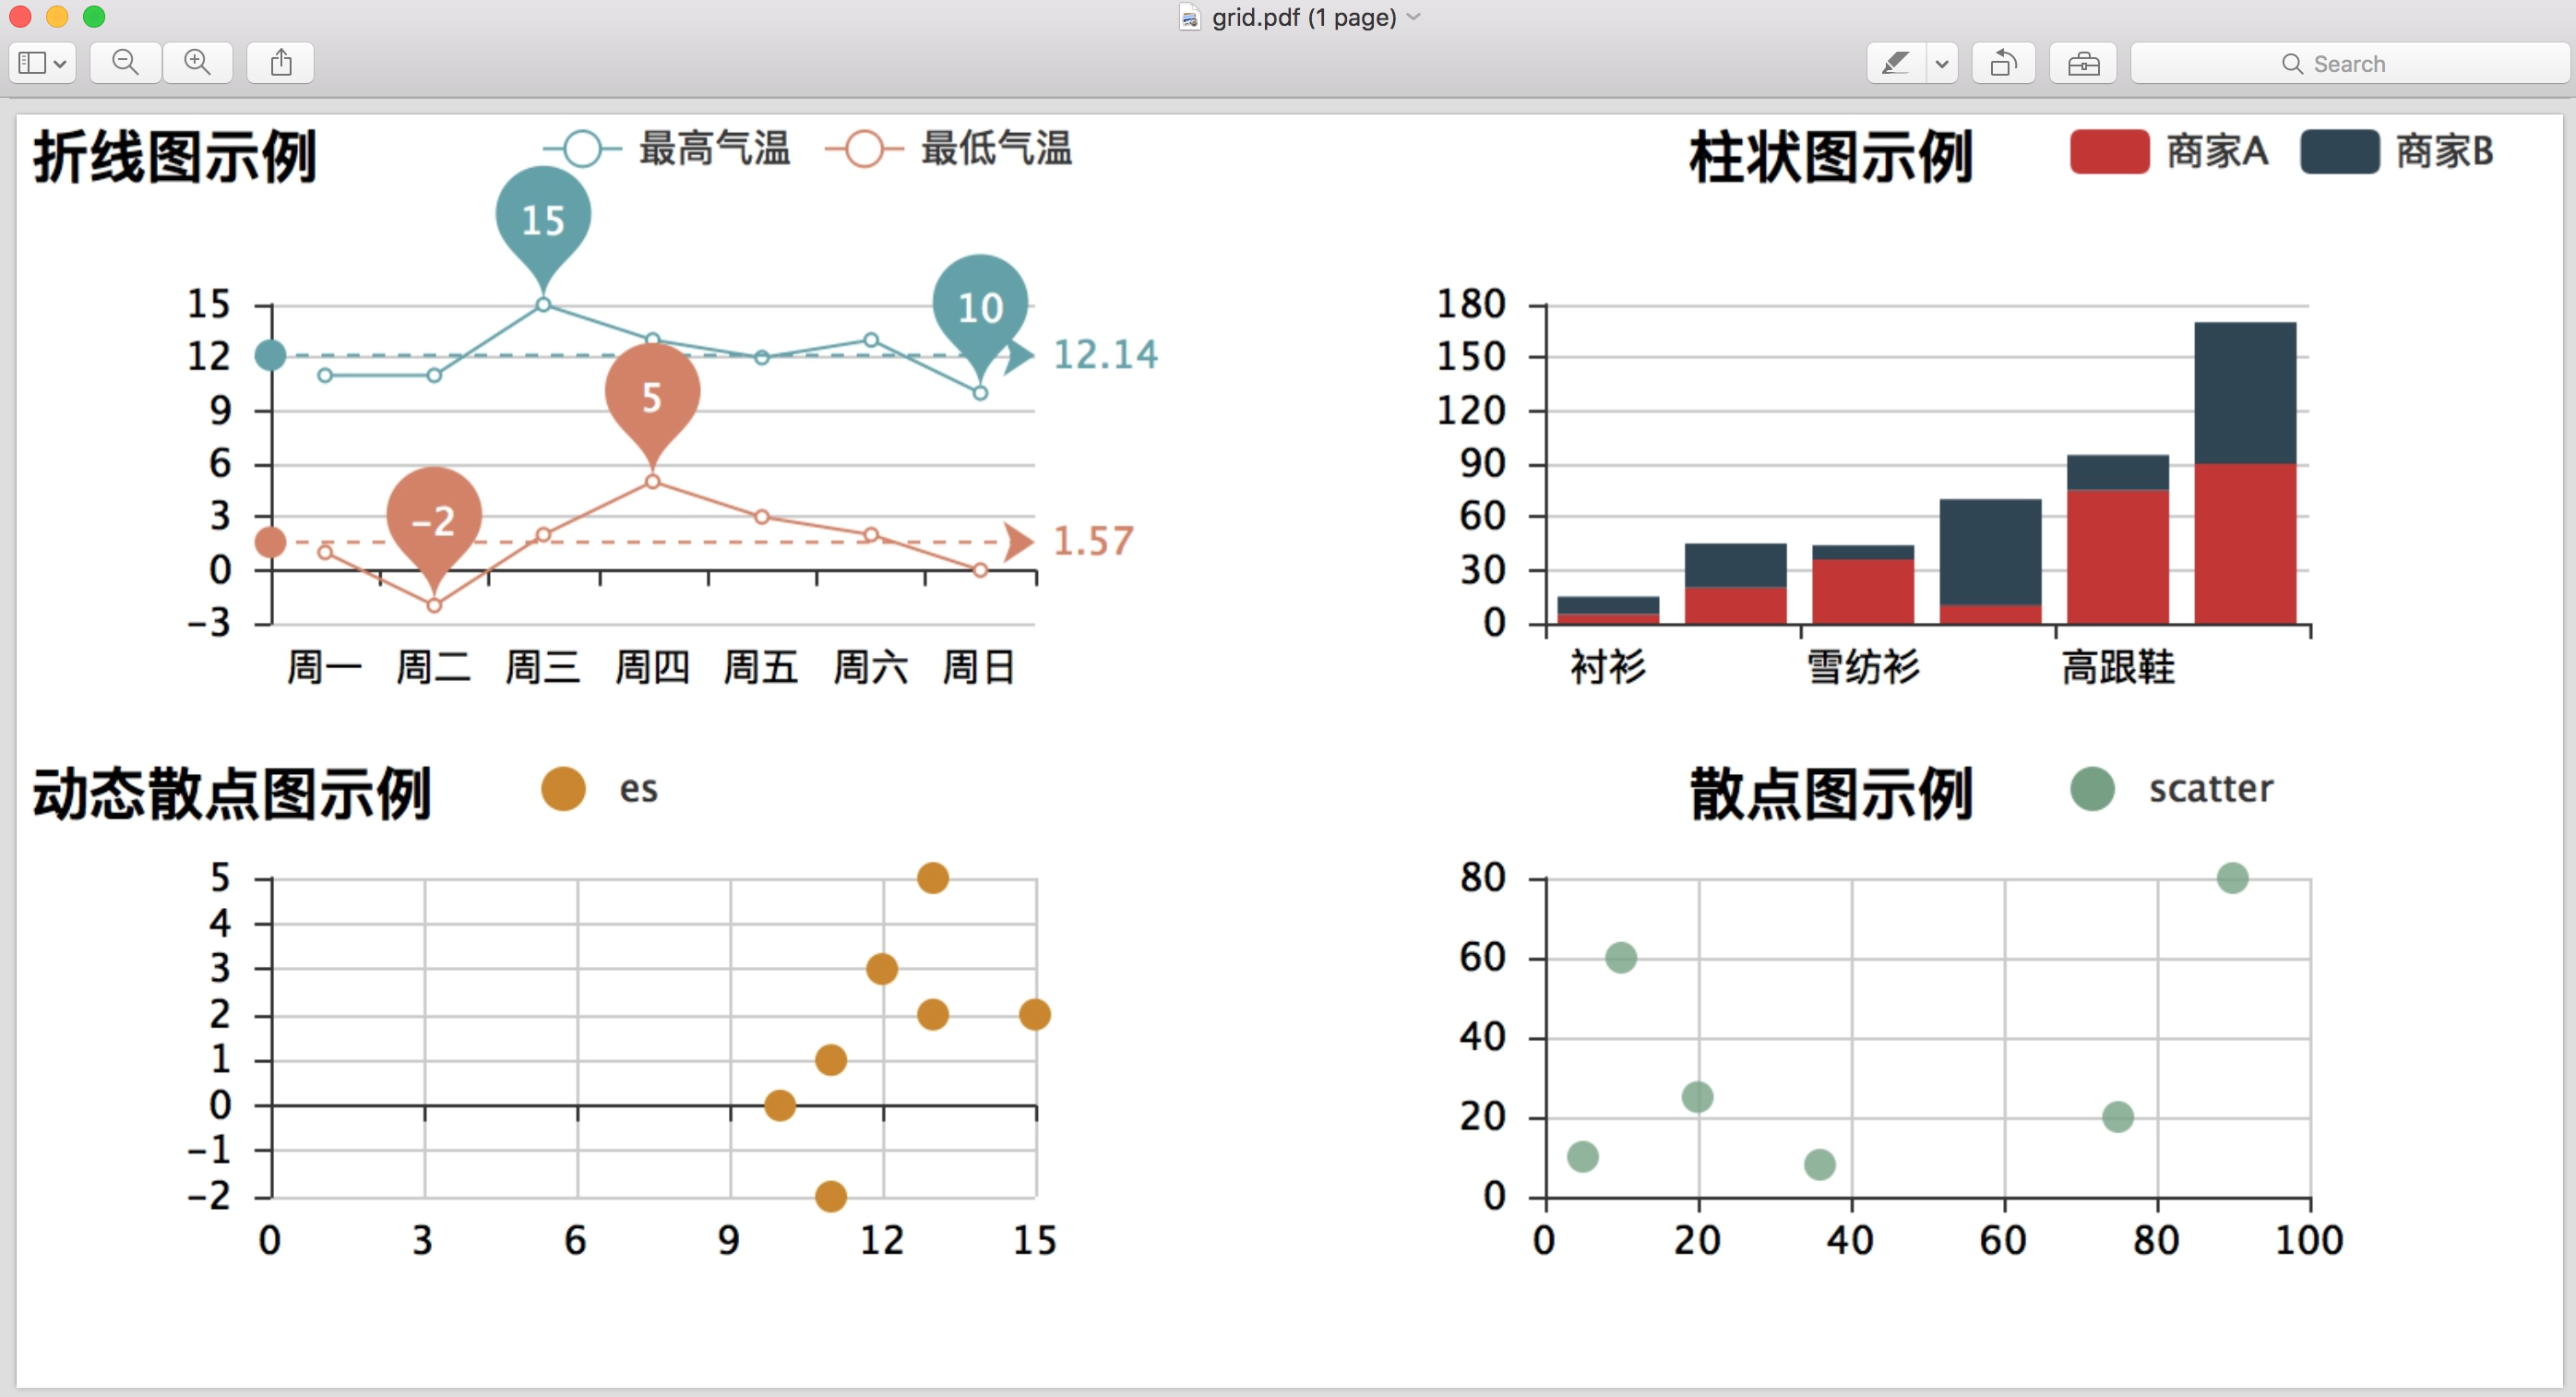
Get pdf:
$ snapshot render.html pdfAnd you will get:
And here the code to generate it
Command line options:
$ snapshot output.html [png|jpeg|gif|pdf] delay_in_seconds
where delay_in_seconds tells pyexcel-snapshot to take a snapshot after delay_in_seconds. It is needed only when your snapshot is partial because the chart animation takes long than 0.5 second(default).
Programmatical usage is simple:
...
from pyecharts_snapshot.main import make_a_snapshot

...
somechart.render()
make_a_snapshot('render.html', 'cool_snapshot.png')  # delay=1) for 1 second delay
where delay as an optional parameter can be given to specify delay_in_seconds.
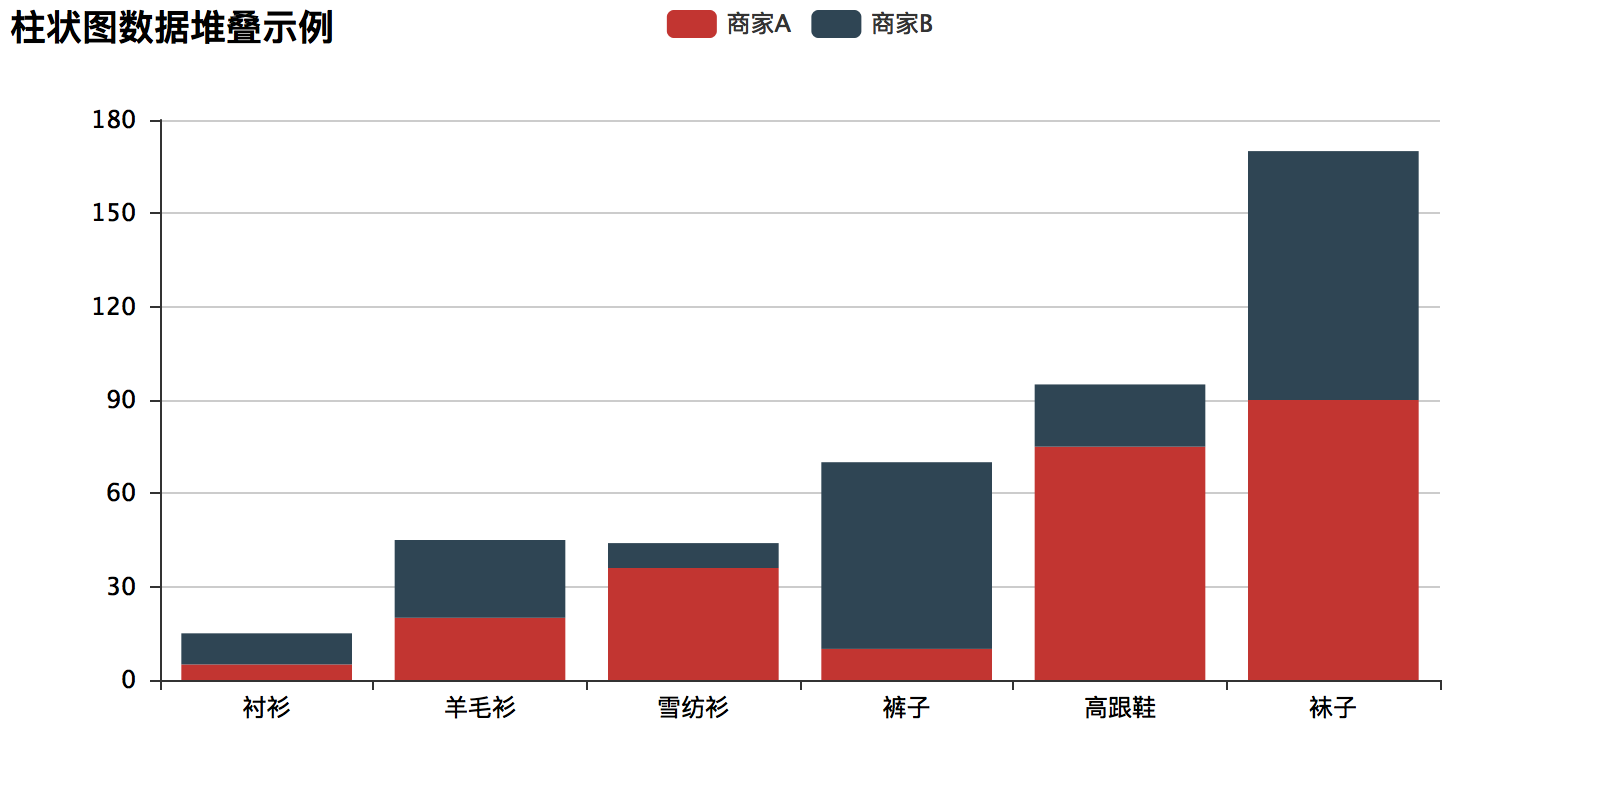
Here's a fully working example code to get a png image:
# coding=utf-8
from __future__ import unicode_literals
from pyecharts import Bar
from pyecharts_snapshot.main import make_a_snapshot

attr = ["衬衫", "羊毛衫", "雪纺衫", "裤子", "高跟鞋", "袜子"]
v1 = [5, 20, 36, 10, 75, 90]
v2 = [10, 25, 8, 60, 20, 80]
bar = Bar("柱状图数据堆叠示例")
bar.add("商家A", attr, v1, is_stack=True)
bar.add("商家B", attr, v2, is_stack=True)
bar.render()
make_a_snapshot('render.html', 'snapshot.png')
Here is the snapshot:
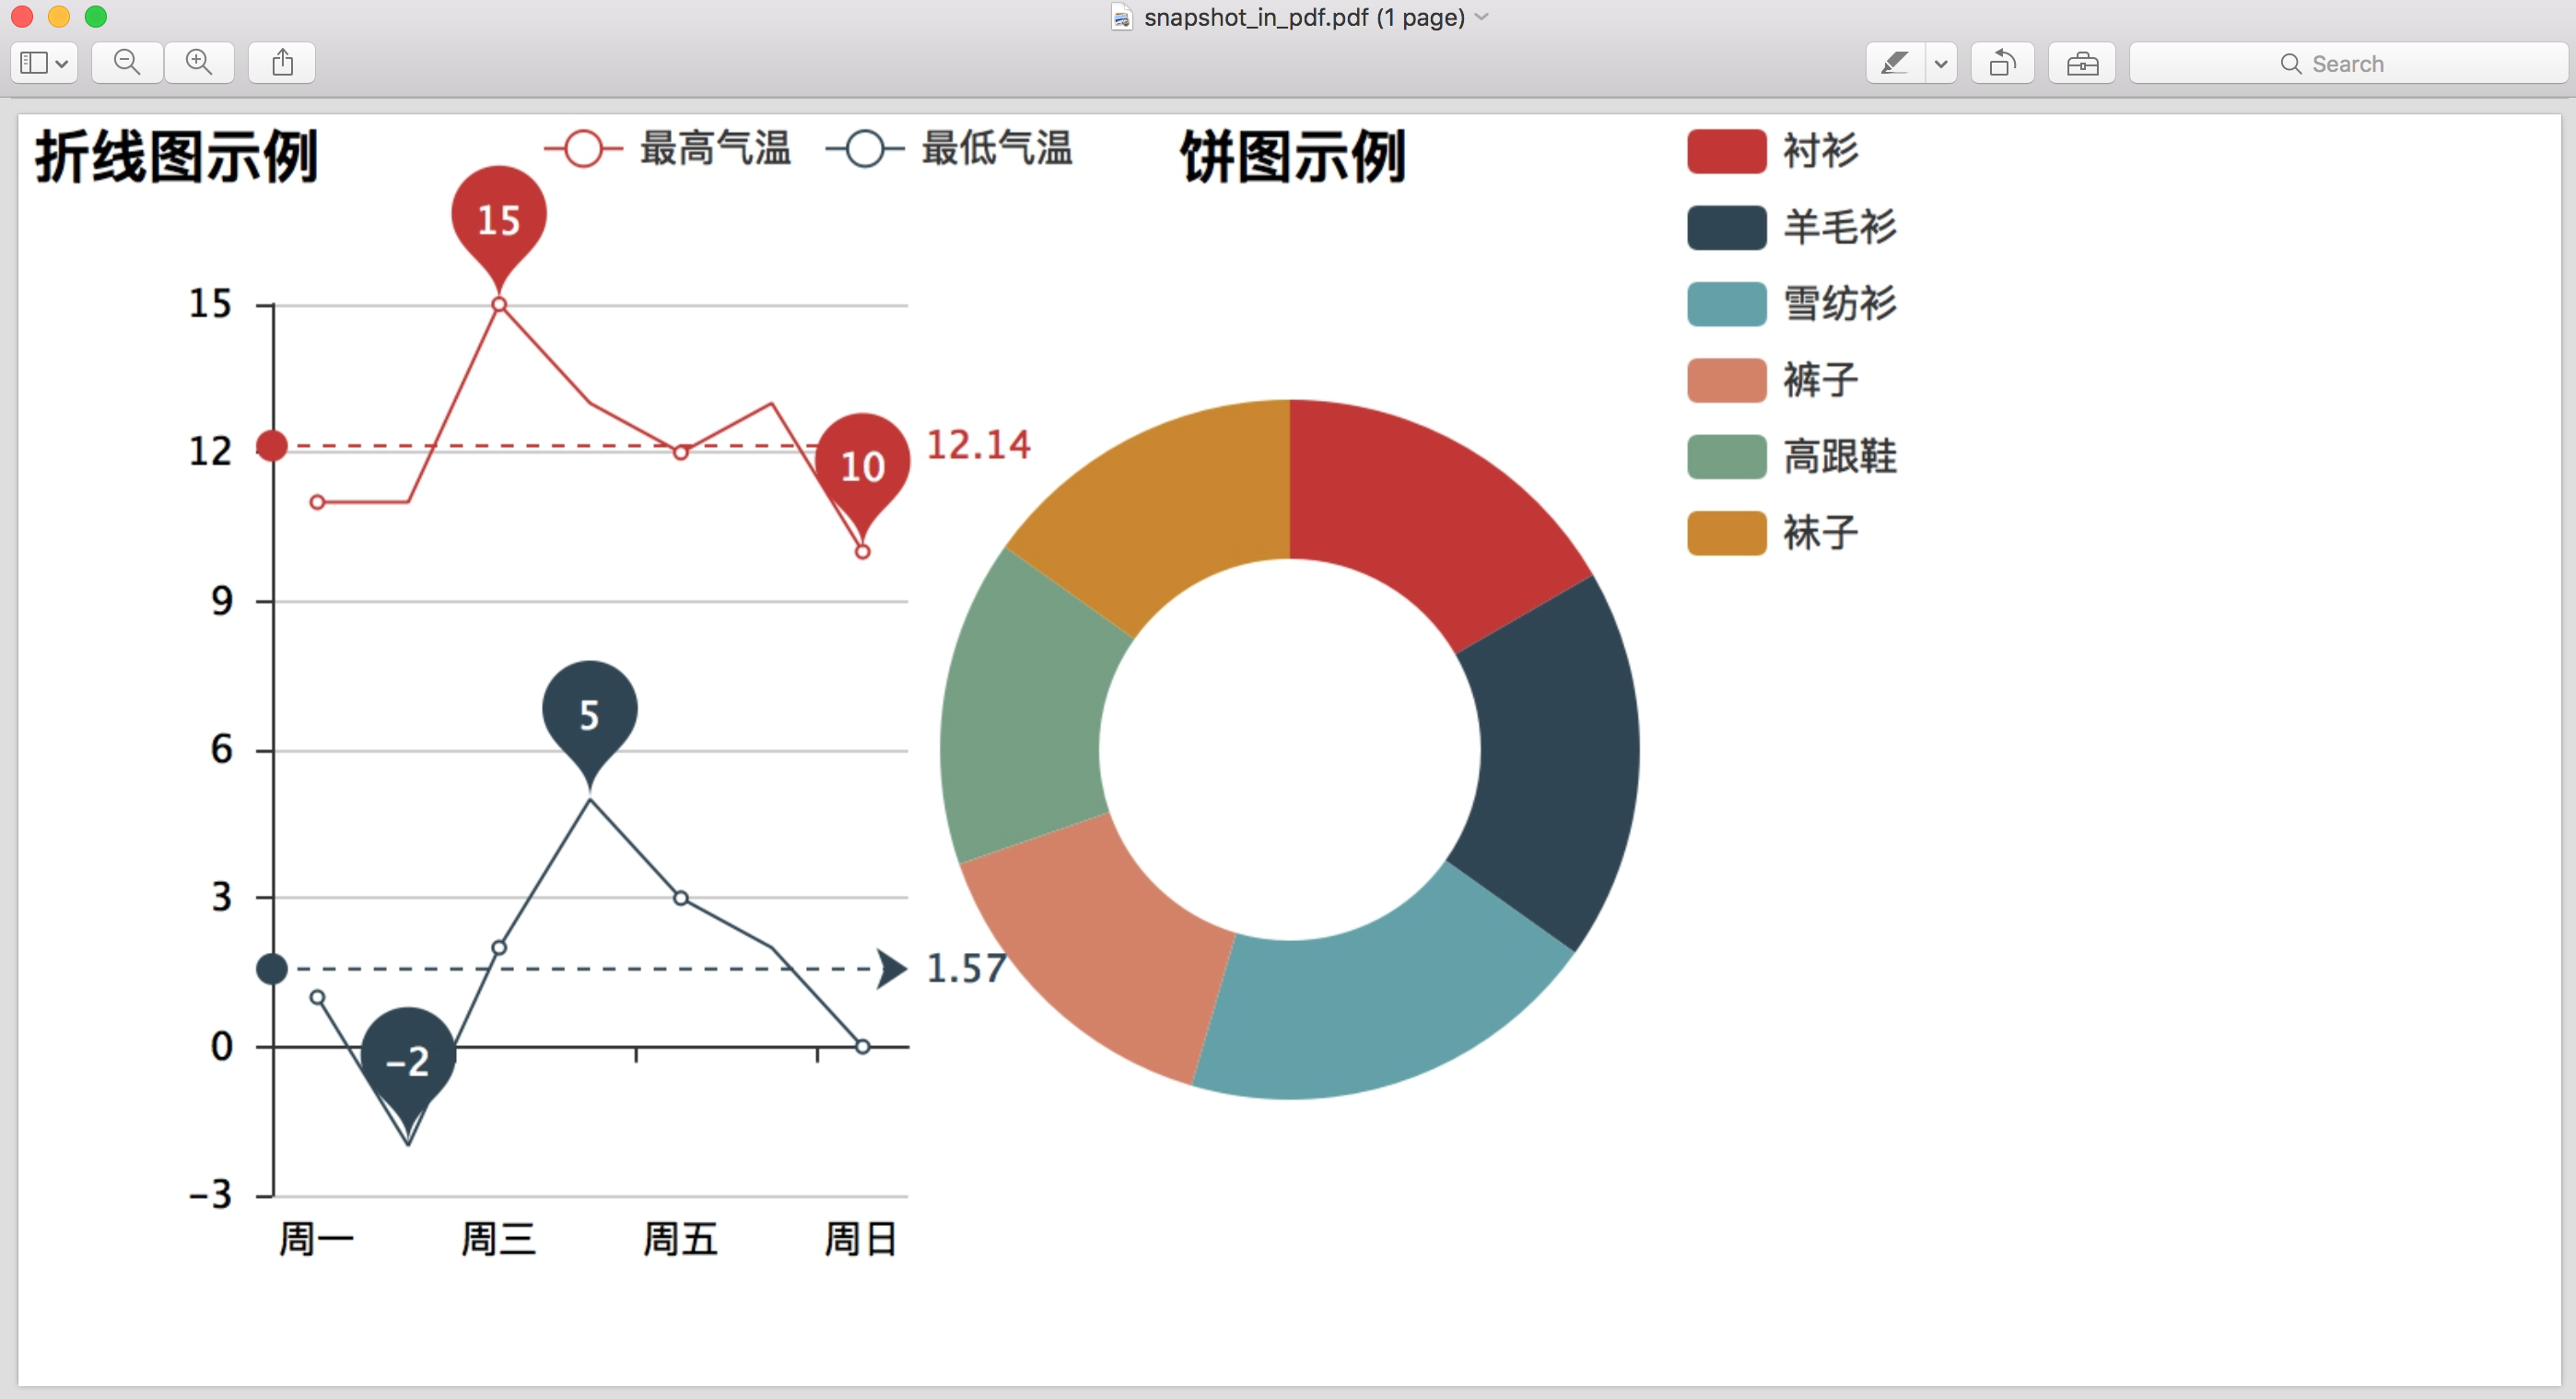
In order to get a pdf file, you can do the following instead:
# coding=utf-8
from __future__ import unicode_literals

from pyecharts import Line, Pie, Grid
from pyecharts_snapshot.main import make_a_snapshot

line = Line("折线图示例", width=1200)
attr = ['周一', '周二', '周三', '周四', '周五', '周六', '周日']
line.add("最高气温", attr, [11, 11, 15, 13, 12, 13, 10],
         mark_point=["max", "min"], mark_line=["average"])
line.add("最低气温", attr, [1, -2, 2, 5, 3, 2, 0], mark_point=["max", "min"],
         mark_line=["average"], legend_pos="20%")
attr = ["衬衫", "羊毛衫", "雪纺衫", "裤子", "高跟鞋", "袜子"]
v1 = [11, 12, 13, 10, 10, 10]
pie = Pie("饼图示例", title_pos="45%")
pie.add("", attr, v1, radius=[30, 55],
        legend_pos="65%", legend_orient='vertical')

grid = Grid()
grid.add(line, grid_right="65%")
grid.add(pie, grid_left="60%")
grid.render()
make_a_snapshot("render.html", 'snapshot.pdf')
Here is the snapshot in pdf:
Please install a node.js binary to your operating system. Simply download the tar ball, extract it and place its bin folder in your PATH.
Next, you will need to issue a magic command:
$ npm install -g phantomjs-prebuiltAt the end, please verify if it is there:
$ which phantomjsOn windows, please try:
C: > phantomjs
If you see it there, continue. Otherwise, start from the beginning, ask for help or thank you for your attention.
You can install it via pip:
$ pip install pyecharts-snapshotor clone it and install it:
$ git clone http://github.com/chfw/pyecharts-snapshot.git
$ cd pyecharts-snapshot
$ python setup.py installFully tested on pypy, python 2.6, 2.7, 3.3, 3.4, 3.5 and 3.6.
Only one image at a time. No 3D image support
- Ghost.Py: very hard to install on my own. Dropped
- Puppeteer: too big to download. Dropped
- install pyecharts-snapshot
- make demo
- take screenshots of grid.pdf and snapshot.pdf in examples folder

