Giter Club home page Giter Club logo

gsat's Introduction

Graph Stochastic Attention (GSAT)

arXiv Github License Colab

Blogs (English - 中文) | Slides | Poster

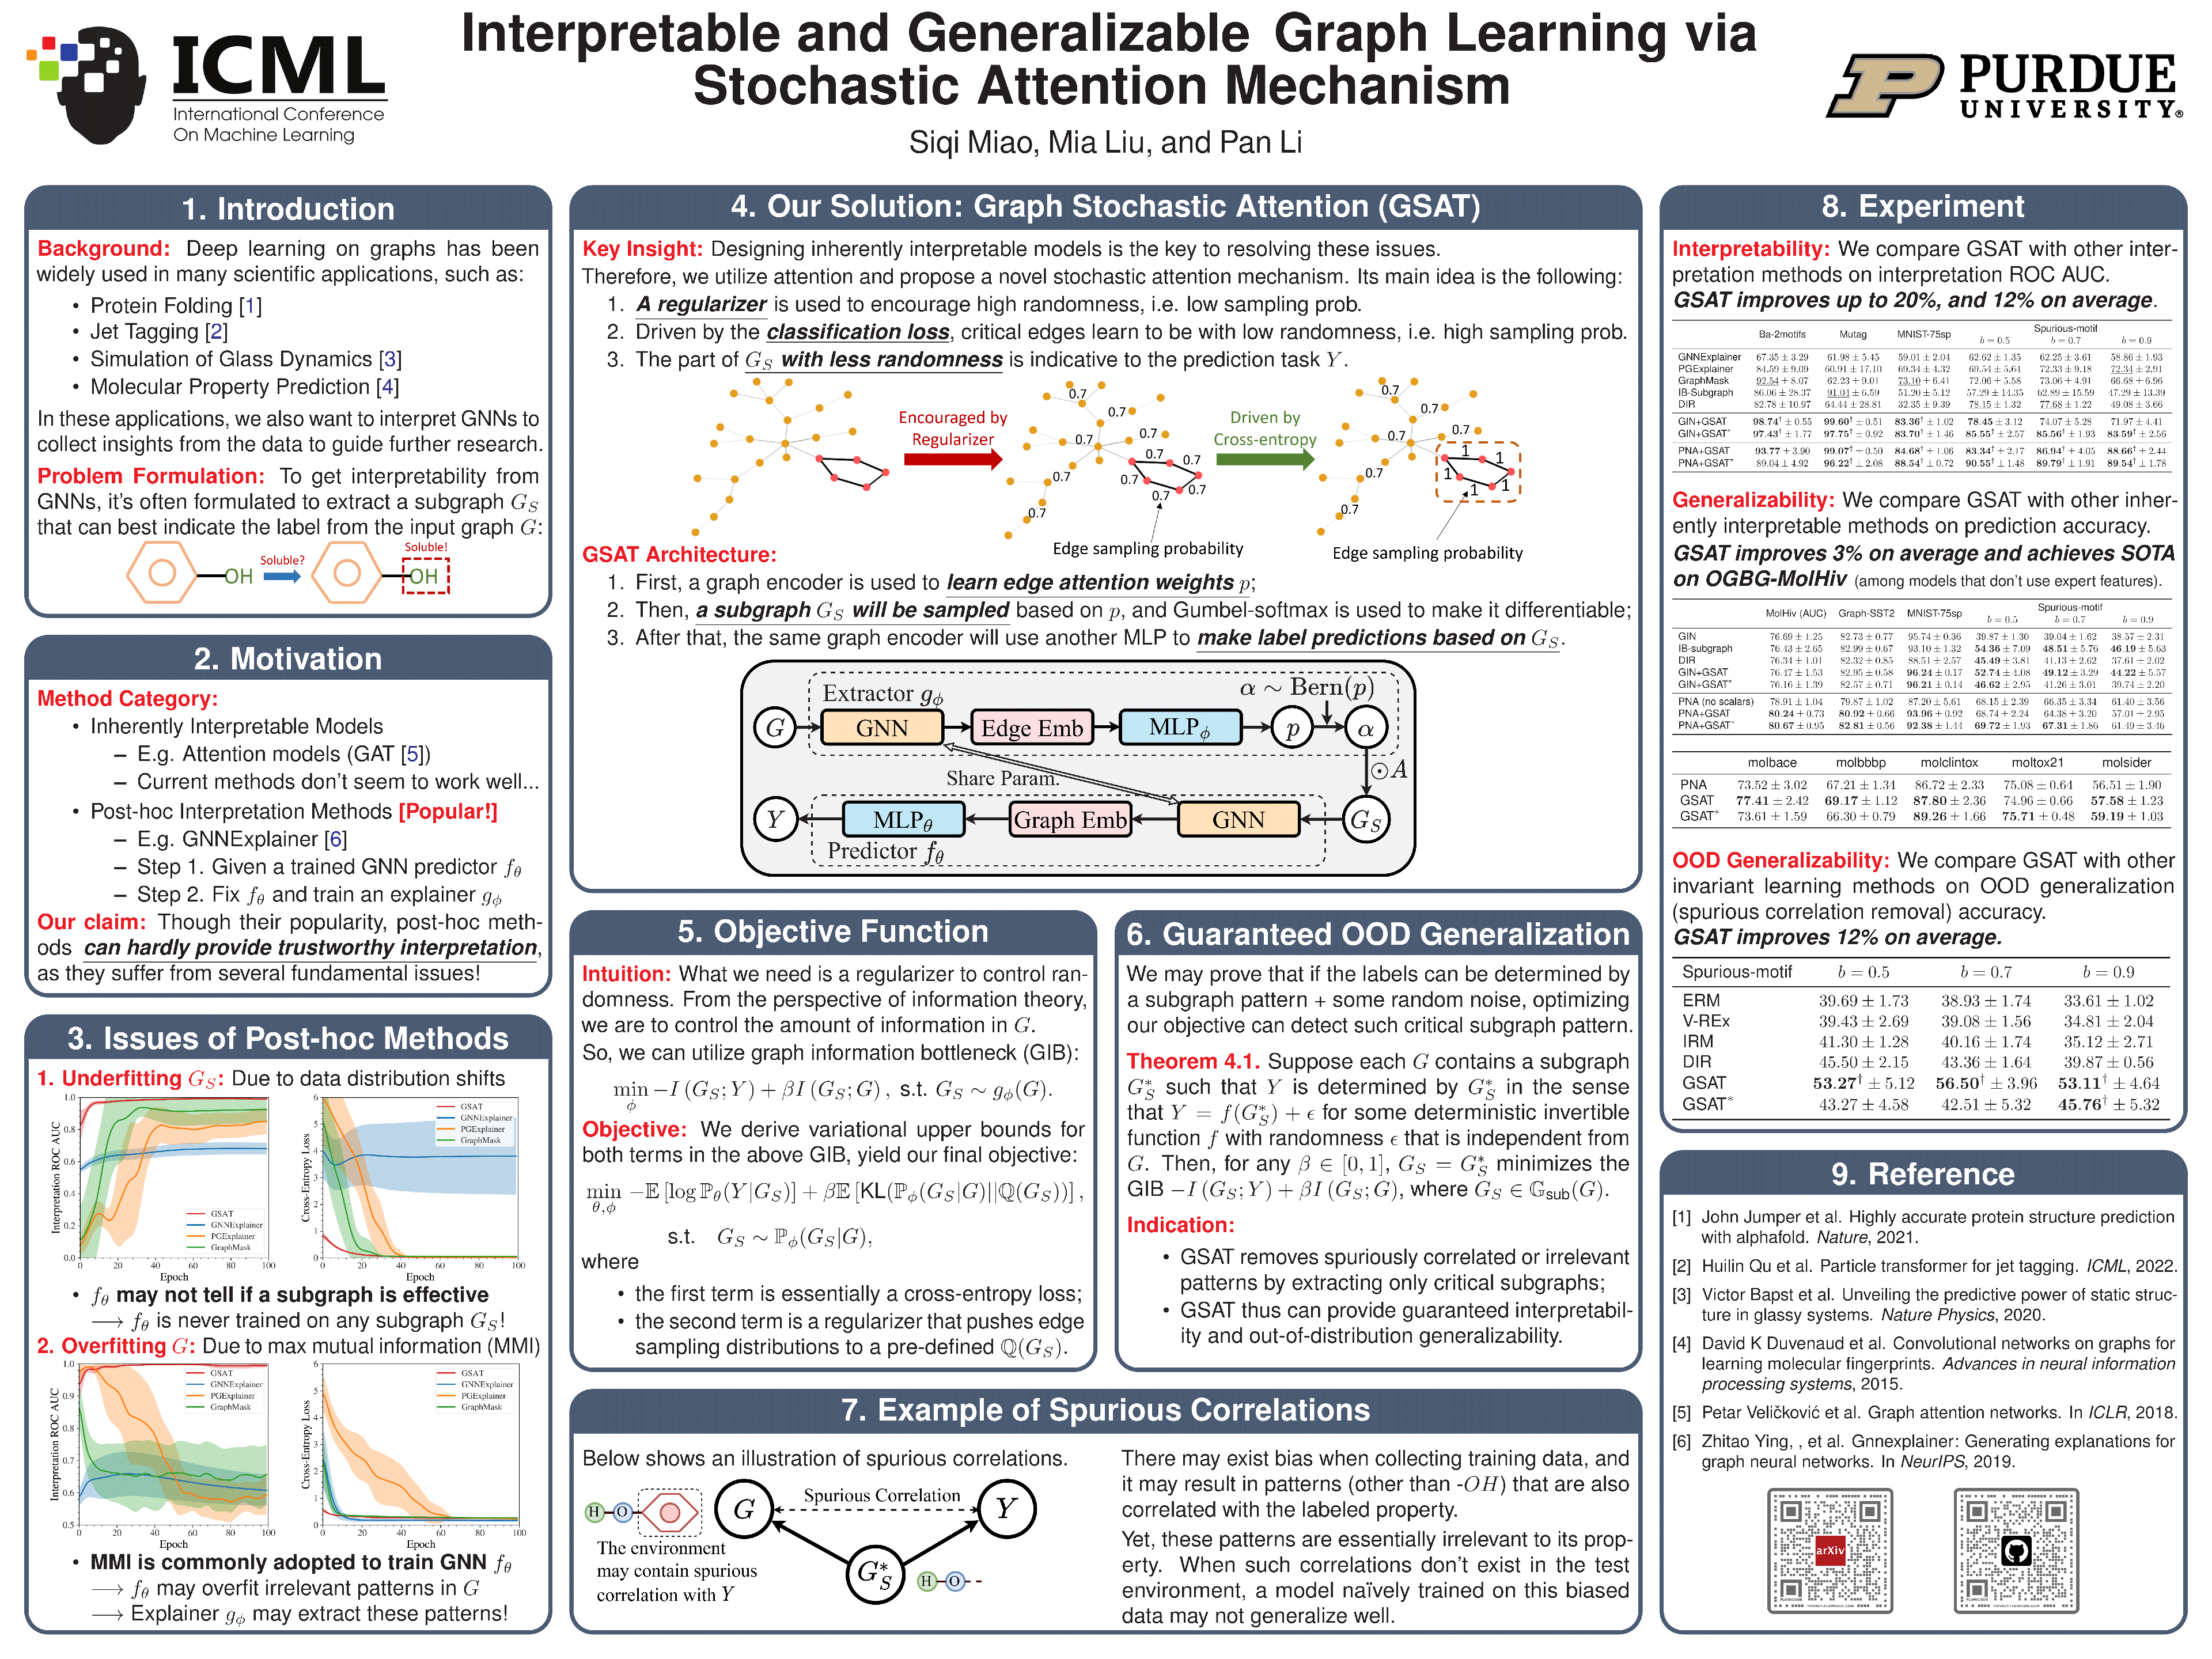
This repository contains the official implementation of GSAT as described in the paper: Interpretable and Generalizable Graph Learning via Stochastic Attention Mechanism (ICML 2022) by Siqi Miao, Mia Liu, and Pan Li.

News

  • Mar. 15, 2023: Check out GSAT on GOOD benchamrk with leaderboard here. GSAT (again) achieves multiple SOTA results on out-of-distribution generalization on the recent benchmark, while being highly interpretable!
  • Jan. 21, 2023: Check out our latest paper Learnable Randomness Injection (LRI) with code here, which is recently accepted to ICLR 2023! In LRI, we further generalize the idea of GSAT and propose four datasets with ground-truth interpretation labels from real-world scientific applications (instead of synthetic motif datasets to evaluate interpretability!).
  • Nov. 16, 2022: A bug was reported in the code when averaging edge attention weigts for undirected graphs, as pointed out by this issue. We have fixed this bug in the latest version of the code by this PR.

Introduction

Commonly used attention mechanisms have been shown to be unable to provide reliable interpretation for graph neural networks (GNNs). So, most previous works focus on developing post-hoc interpretation methods for GNNs.

This work shows that post-hoc methods suffer from several fundamental issues, such as underfitting the subgraph $G_S$ and overfitting the original input graph $G$. Thus, they are essentially good at checking feature sensitivity but can hardly provide trustworthy interpretation for GNNs if the goal is to extract effective patterns from the data (which should have been the most interesting goal).

This work addresses those issues by designing an inherently interpretable model. The key idea is to jointly train both the predictor and the explainer with a carefully designed Graph Stochastic Attention (GSAT) mechanism. With certain assumptions, GSAT can provide guaranteed out-of-distribution generalizability and guaranteed inherent interpretability, which makes sure GSAT doesn't suffer from those issues. Fig. 1 shows the architecture of GSAT.

Figure 1. The architecture of GSAT.

Rationale of GSAT

The rationale of GSAT is to inject stochasticity when learning attention. For example, Fig 2 shows a task to detect if there exists a five-node-circle in the input graph, so edges with pink end nodes are the critical edges for this task. The main idea of GSAT is the following:

  1. A regularizer is used to encourage high randomness, i.e. low sampling probability, say 0.7.
    • In this case, every critical edge may be dropped 30% of the time.
    • Whenever a critical edge is dropped, it may flip model predictions and incur a huge classification loss.
  2. Driven by the classification loss, critical edges learn to be with low randomness, i.e. high sampling probability.
    • With high sampling probabilities (e.g. 1.0), the critical edges are more likely to be kept during training.
  3. The part with less randomness is the underlying critical data patterns captured by GSAT.

To implement the above mechanism, a proper regularizer is needed. As the goal is to control randomness, from an information-theoretic point of view it's to control the amount of information in $G$. So, the information bottleneck (IB) principle can be utilized, which helps to provide guaranteed OOD generalizability and interpretability, see Theorem. 4.1. in the paper.

Figure 2. The rationale of GSAT.

Installation

We have tested our code on Python 3.9 with PyTorch 1.10.0, PyG 2.0.3 and CUDA 11.3. Please follow the following steps to create a virtual environment and install the required packages.

Clone the repository:

git clone https://github.com/Graph-COM/GSAT.git
cd GSAT

Create a virtual environment:

conda create --name gsat python=3.9 -y
conda activate gsat

Install dependencies:

conda install -y pytorch==1.10.0 torchvision cudatoolkit=11.3 -c pytorch
pip install torch-scatter==2.0.9 torch-sparse==0.6.12 torch-cluster==1.5.9 torch-spline-conv==1.2.1 torch-geometric==2.0.3 -f https://data.pyg.org/whl/torch-1.10.0+cu113.html
pip install -r requirements.txt

In case a lower CUDA version is required, please use the following command to install dependencies:

conda install -y pytorch==1.9.0 torchvision==0.10.0 torchaudio==0.9.0 cudatoolkit=10.2 -c pytorch
pip install torch-scatter==2.0.9 torch-sparse==0.6.12 torch-cluster==1.5.9 torch-spline-conv==1.2.1 torch-geometric==2.0.3 -f https://data.pyg.org/whl/torch-1.9.0+cu102.html
pip install -r requirements.txt

Run Examples

We provide examples with minimal code to run GSAT in ./example/example.ipynb. We have tested the provided examples on Ba-2Motifs (GIN), Mutag (GIN) and OGBG-Molhiv (PNA). Yet, to implement GSAT* one needs to load a pre-trained model first in the provided example. Also try Colab to play with example.ipynb in Colab.

It should be able to run on other datasets as well, but some hard-coded hyperparameters might need to be changed accordingly, see ./src/configs for all hyperparameter settings. To directly reproduce results for other datasets, please follow the instructions in the following section.

Reproduce Results

We provide the source code to reproduce the results in our paper. The results of GSAT can be reproduced by running run_gsat.py. To reproduce GSAT*, one needs to first change the configuration file accordingly (from_scratch: false).

To train GSAT or GSAT*:

cd ./src
python run_gsat.py --dataset [dataset_name] --backbone [model_name] --cuda [GPU_id]

dataset_name can be choosen from ba_2motifs, mutag, mnist, Graph-SST2, spmotif_0.5, spmotif_0.7, spmotif_0.9, ogbg_molhiv, ogbg_moltox21, ogbg_molbace, ogbg_molbbbp, ogbg_molclintox, ogbg_molsider.

model_name can be choosen from GIN, PNA.

GPU_id is the id of the GPU to use. To use CPU, please set it to -1.

Training Logs

Standard output provides basic training logs, while more detailed logs and interpretation visualizations can be found on tensorboard:

tensorboard --logdir=./data/[dataset_name]/logs

Hyperparameter Settings

All settings can be found in ./src/configs.

Instructions on Acquiring Datasets

  • Ba_2Motifs

    • Raw data files can be downloaded automatically, provided by PGExplainer and DIG.
  • Spurious-Motif

    • Raw data files can be generated automatically, provide by DIR.
  • OGBG-Mol

    • Raw data files can be downloaded automatically, provided by OGBG.
  • Mutag

    • Raw data files need to be downloaded here, provided by PGExplainer.
    • Unzip Mutagenicity.zip and Mutagenicity.pkl.zip.
    • Put the raw data files in ./data/mutag/raw.
  • Graph-SST2

    • Raw data files need to be downloaded here, provided by DIG.
    • Unzip the downloaded Graph-SST2.zip.
    • Put the raw data files in ./data/Graph-SST2/raw.
  • MNIST-75sp

    • Raw data files need to be generated following the instruction here.
    • Put the generated files in ./data/mnist/raw.

FAQ

Does GSAT encourage sparsity?

No, GSAT doesn't encourage generating sparse subgraphs. We find r = 0.7 (Eq.(9) in our paper) can generally work well for all datasets in our experiments, which means during training roughly 70% of edges will be kept (kind of still large). This is because GSAT doesn't try to provide interpretability by finding a small/sparse subgraph of the original input graph, which is what previous works normally do and will hurt performance significantly for inhrently interpretable models (as shown in Fig. 7 in the paper). By contrast, GSAT provides interpretability by pushing the critical edges to have relatively lower stochasticity during training.

How to tune the hyperparameters of GSAT?

We recommend to tune r in {0.5, 0.7} and info_loss_coef in {1.0, 0.1, 0.01} based on validation classification performance. And r = 0.7 and info_loss_coef = 1.0 can be a good starting point. Note that in practice we would decay the value of r gradually during training from 0.9 to the chosen value. Given our empirical observation, the classification performance of GSAT should always be no worse than that yielded by ERM (Empirical Risk Minimization) training, when its hyperparameters are tuned properly.

p or α to implement Eq. (9)?

Recall in Fig. 1, p is the probability of dropping an edge, while α is the sampled result from Bern(p). In our provided implementation, as an empirical choice, α is used to implement Eq.(9) (the Gumbel-softmax trick makes α essentially continuous in practice). We find that when α is used it may provide more regularization and make the model more robust to hyperparameters. Nonetheless, using p can achieve the same performance.

How to sample $G_S$?

In practice, we don't yield $G_S$ by doing $\alpha \odot A$ in Fig. 1, because based on the gumbel-softmax trick it's non-trivial to make this operation differentiable for message-passing-based neural networks (MPNNs). Instead, the learned attention will act on the message of the corresponding edge. Once the message of an edge is dropped, one can (roughly) believe that the corresponding edge is dropped in MPNNs, and this is like an approximation of $\alpha \odot A$.

Reference

If you find our paper and repo useful, please cite our paper:

@article{miao2022interpretable,
  title       = {Interpretable and Generalizable Graph Learning via Stochastic Attention Mechanism},
  author      = {Miao, Siqi and Liu, Mia and Li, Pan},
  journal     = {International Conference on Machine Learning},
  year        = {2022}
}

gsat's People

Contributors

siqim avatar

Stargazers

 avatar  avatar  avatar  avatar  avatar  avatar  avatar  avatar  avatar  avatar  avatar  avatar  avatar  avatar  avatar  avatar  avatar  avatar  avatar  avatar  avatar  avatar  avatar  avatar  avatar  avatar  avatar  avatar  avatar  avatar  avatar  avatar  avatar  avatar  avatar  avatar  avatar  avatar  avatar  avatar  avatar  avatar  avatar  avatar  avatar  avatar  avatar  avatar  avatar  avatar  avatar  avatar  avatar  avatar  avatar  avatar  avatar  avatar  avatar  avatar  avatar  avatar  avatar  avatar  avatar  avatar  avatar  avatar  avatar  avatar  avatar  avatar  avatar  avatar  avatar  avatar  avatar  avatar  avatar  avatar  avatar  avatar  avatar  avatar  avatar  avatar  avatar  avatar  avatar  avatar  avatar  avatar  avatar  avatar  avatar  avatar  avatar  avatar  avatar  avatar

Watchers

 avatar  avatar  avatar

gsat's Issues

directed edge weights on undirected graphs

Hello,

First of all, thank you for your paper and your code, it is a pleasure to work with it.

However, I have a question about the following line :

edge_att = (att + transpose(data.edge_index, att, nodesize, nodesize, coalesced=False)[1]) / 2

When I run it, this line does not seem to do anything more than edge_att = (att + att) / 2.
As a result, edge weights are different depending on the direction of the edge (0 to 1 != 1 to 0).
Have I missed anything?

Issues with implementation

Hi all, I tried to implement the info loss in my own GNN. I am using a custom convolution in a custom dataset that might have leakage, so this might be the source of error. But I am trying to understand why the model would behave the way it is behaving. I would appreciate any ideas/feedback.

My model is for link prediction on small subgraphs, where each for each edge I wanna predict, I sample a subgraph around it.

I am implementing the info_loss just like in your code:
info_loss = (edge_att * torch.log(edge_att/r + 1e-6) + (1-edge_att) * torch.log((1-edge_att)/(1-r+1e-6) + 1e-6)).mean()

If I don't use any sort of info loss, when I train my model, my edge attention looks like this:
image

If I use l1 loss (just minimizing edge_att.mean()), my edge attention looks like this:
image

If I use l1 loss, but multiply by 1e-3, it looks like this:
image

However, if I use the info loss proposed in your paper, my edge attention agglutinates in values close to r. For example, for r = 0.3, I get the attention distribution below. If I use r=0.5, then the dense part of the historgram moves to the middle, and if I use something like r=0.7 or r=0.9, then all my attention weights are closer to 1.
image

I tried to understand the intuition behind it by plotting the curve att x info_loss for different values of r
image

image

image

So basically the info_loss is approximately zero when closer to r, and positive everywhere else. This is forcing my model to try to have the attention always close to r (which I am not sure if I understand why), and apparently this is exactly what my model is doing. What confuses me is that in your paper, r is recommended to be between 0.5 and 0.9. However, in my current setting, this forces the majority of my edge attention to be > 0.5, instead of making them sparse.

I wonder if I am doing something wrong, if info_loss should have a smaller weight, or if my concrete_sampler should have a higher temperature to force a bernoulli-like distribution, or if maybe my model simply doesnt really need the edges, and it is ok with using any edge_attention value, hacking a way to get the same solution just based on node embedding, for example, without message passing. Maybe I have excess of dropout during training? (I do both node and edge dropout).

Please let me know if you have any ideas. Thanks in advance!

Sampling from Parameterized Bernoulli Distribution

When generating the subgraph, GSAT samples from the Bernoulli(sigmoid(att_log_logits)) to get the "soft" value of the Bernoulli samples (it seems to be a continuous value rather than discrete 1/0).

I don't quite understand how Gumbel-Softmax is applied here (

def concrete_sample(att_log_logit, temp, training):
). I don't think this function make it sample from Gumbel distribution. It should be -log(-log(u)) and u is from uniform(0,1) to be from Gumbel's. How does Gumbel softmax is applied?

Unstable accuracy on test set

Hello,

I also have a second question (see #5 for the first one).
When I run your code on ba_2motifs, I obtain the following graph:
image
Fortunately, the validation set have the exact same behaviour as the test set, so when the validation set accuracy is high, the test set accuracy is high too, hence the good results.
Is it expected that it is so unstable? What could I do to avoid that?

Node Classification

Hi, thanks for organizing the code so neatly, I am wondering if the code applicable for node classification task. If yes, can you please point out which part should be changed?

Infoloss before or after sampling

Hello, me again !

I read in your paper that your infoloss should be based on the distribution of the subgraphs knowing the original graph and the parameters.

However, in your code, in order, you 1) compute this distribution in logits, 2) sample with a gumbel-softmax trick, and 3) apply the infoloss on the sampled subgraph. From my understanding, you should rather 1) compute the distribution in logits, 2) transform the logits into probabilities, using the same temperature as in the gumbel-softmax code, 3) apply the infoloss on that distribution, and 4) do your gumbel-softmax trick on the logits to be used in other parts of the code.

Mathematically, I think what you do bring a lot of noise in the infoloss back-propagated gradients, and I would expect the loss to be more efficient and clean if you follow the order I propose. That is, apply the infoloss on (att_log_logits / temp).sigmoid() (with temp set to 1 in your code) rather than on self.sampling(att_log_logits, epoch, training).

What do you think? Have I missed something?
I would love to read your opinion on the matter.

ps: Thanks again for your paper and your reactivity to my previous issues!

issues about run colab example

when i run the last

all_viz_set = get_viz_idx(test_set, dataset_name, num_viz_samples)
visualize_results(gsat, all_viz_set, test_set, num_viz_samples, dataset_name, model_config['use_edge_attr'])
0%|          | 0/10 [00:00<?, ?it/s]
---------------------------------------------------------------------------
RuntimeError                              Traceback (most recent call last)
[<ipython-input-18-4b79db204498>](https://localhost:8080/#) in <cell line: 6>()
      4 all_viz_set = get_viz_idx(test_set, dataset_name, num_viz_samples)
      5 
----> 6 visualize_results(gsat, all_viz_set, test_set, num_viz_samples, dataset_name, model_config['use_edge_attr'])

1 frames
[/usr/local/lib/python3.10/dist-packages/torch_geometric/utils/subgraph.py](https://localhost:8080/#) in subgraph(subset, edge_index, edge_attr, relabel_nodes, num_nodes, return_edge_mask)
     97     edge_mask = node_mask[edge_index[0]] & node_mask[edge_index[1]]
     98     edge_index = edge_index[:, edge_mask].to('cpu')
---> 99     edge_attr = edge_attr[edge_mask] if edge_attr is not None else None
    100 
    101     if relabel_nodes:

RuntimeError: indices should be either on cpu or on the same device as the indexed tensor (cpu)

no issues

Just wanted to say that the paper is amazing. Thanks for publishing it and the code.

ERROR when generating MNIST-75sp

I am trying to generate the mnist75 dataset by running: ./scripts/prepare_data.sh and I am getting the following stacktrace:
Fr Dez 16 17:57:00 CET 2022
start time: 2022-12-16 17:57:01.936994
dataset mnist
data_dir ./data
out_dir ./data
split train
threads 0
n_sp 75
compactness 0.25
seed 111
/home/mada/anaconda3/lib/python3.9/site-packages/skimage/_shared/utils.py:338: FutureWarning: multichannel is a deprecated argument name for slic. It will be removed in version 1.0. Please use channel_axis instead.
warnings.warn(self.warning_msg.format(
Traceback (most recent call last):
File "graph_attention_pool/extract_superpixels.py", line 128, in
sp_data.append(process_image((images[i], i, n_images, args, True, True)))
File "graph_attention_pool/extract_superpixels.py", line 55, in process_image
assert n_sp_extracted == np.max(superpixels) + 1, ('superpixel indices', np.unique(superpixels)) # make sure superpixel indices are numbers from 0 to n-1
AssertionError: ('superpixel indices', array([ 1, 2, 3, 4, 5, 6, 7, 8, 9, 10, 11, 12, 13, 14, 15, 16, 17,
18, 19, 20, 21, 22, 23, 24, 25, 26, 27, 28, 29, 30, 31, 32, 33, 34,
35, 36, 37, 38, 39, 40, 41, 42, 43, 44, 45, 46, 47, 48, 49, 50, 51,
52, 53, 54, 55, 56, 57, 58, 59, 60, 61, 62, 63, 64, 65, 66, 67, 68,
69, 70, 71]))

Do you know what the issue might be?

Thank you in advance!

about subgraph Gs

Thanks for your amazing work! But where does the code reflect the process of obtaining subgraphs (Gs) through sampling.

If you see this issue, please tell me the answer.Thanks in advance!

Recommend Projects

  • React photo React

    A declarative, efficient, and flexible JavaScript library for building user interfaces.

  • Vue.js photo Vue.js

    🖖 Vue.js is a progressive, incrementally-adoptable JavaScript framework for building UI on the web.

  • Typescript photo Typescript

    TypeScript is a superset of JavaScript that compiles to clean JavaScript output.

  • TensorFlow photo TensorFlow

    An Open Source Machine Learning Framework for Everyone

  • Django photo Django

    The Web framework for perfectionists with deadlines.

  • D3 photo D3

    Bring data to life with SVG, Canvas and HTML. 📊📈🎉

Recommend Topics

  • javascript

    JavaScript (JS) is a lightweight interpreted programming language with first-class functions.

  • web

    Some thing interesting about web. New door for the world.

  • server

    A server is a program made to process requests and deliver data to clients.

  • Machine learning

    Machine learning is a way of modeling and interpreting data that allows a piece of software to respond intelligently.

  • Game

    Some thing interesting about game, make everyone happy.

Recommend Org

  • Facebook photo Facebook

    We are working to build community through open source technology. NB: members must have two-factor auth.

  • Microsoft photo Microsoft

    Open source projects and samples from Microsoft.

  • Google photo Google

    Google ❤️ Open Source for everyone.

  • D3 photo D3

    Data-Driven Documents codes.