Giter Club home page Giter Club logo

d3-geo-voronoi's Introduction

d3-geo-voronoi

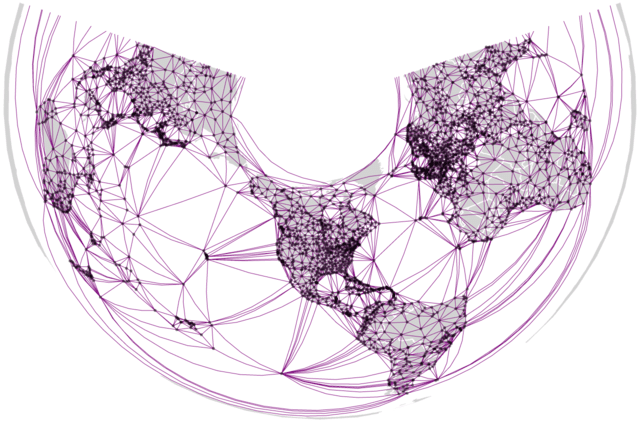
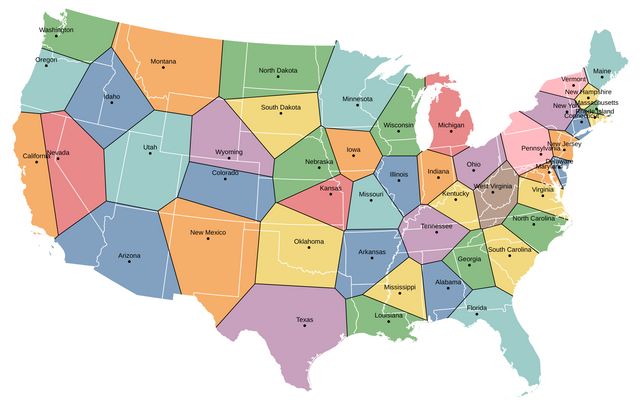
This module adapts d3-delaunay for spherical data. Given a set of objects in spherical coordinates, it computes their Delaunay triangulation and its dual, the Voronoi diagram.

In addition, it offers convenience methods to extract the convex hull, the Urquhart graph, the circumcenters of the Delaunay triangles, and to find the cell that contains any given point on the sphere.

The module offers two APIs.

The GeoJSON API is the most convenient for drawing the results on a map. It follows as closely as possible the API of the d3-voronoi module. It is available with d3.geoVoronoi().

A lighter API is available with d3.geoDelaunay(). It offers the same contents, but with a different presentation, where every vertex, edge, polygon… is referenced by an id rather than by its coordinates. This allows a more compact representation in memory and eases topology computations.

Installing

If you use npm, npm install d3-geo-voronoi. You can also download the latest release on GitHub. For vanilla HTML in modern browsers, import d3-geo-voronoi from Skypack:

<script type="module">
import {geoDelaunay} from "https://cdn.skypack.dev/d3-geo-voronoi@2";
</script>

For legacy environments, you can load d3-geo-voronoi’s UMD bundle from an npm-based CDN such as jsDelivr; a d3 global is exported:

<script src="https://cdn.jsdelivr.net/npm/d3-geo-voronoi@2"></script>
<script>
d3.geoContour();
</script>

API Reference

Delaunay

This API is a similar to d3-delaunay’s API. It provides information on the Delaunay triangulation (edges, triangles, neighbors, Voronoi cells, etc) as indices in two arrays — the array of points, and the array of circumcenters. It facilitates topological computations. To draw the actual triangles, Voronoi cells etc, the Voronoi API described in the next section will often be easier to use.

# d3.geoDelaunay([data]) · Source

Creates a new spherical Delaunay layout. data must be passed as an array of [lon, lat] coordinates.

# delaunay.find(lon, lat[, node])

Returns the closest point to [lon, lat]; optionally starting the search at node to boost the performance.

# delaunay.urquhart([distances])

Given a vector of distances (in the same order as the edges list), returns a vector of boolean values: true if the edge belongs to the Urquhart graph, false otherwise.

urquhart

# delaunay.hull()

Returns an array of indices of points on the hull. The array is empty if the points cover more than a hemisphere.

# delaunay.edges

An array of edges as indices of points [from, to].

edges

# delaunay.triangles

An array of the triangles, as indices of points [a, b, c]. The triangles are orientated in a clockwise manner, triangles that span more than the hemisphere are removed.

# delaunay.centers

The array of centers in spherical coordinates; the first t centers are the t triangles’s circumcenters. More centers might be listed in order to build the Voronoi diagram for smaller number of points (n≤3).

# delaunay.neighbors

The array of neighbors indices for each vertex.

edges

# delaunay.polygons

Array of Voronoi cells for each vertex. Each cell is an array of centers ordered in a clockwise manner.

# delaunay.mesh

An array containing all the edges of the Voronoi polygons.

Voronoi

This API is a wrapper around the Delaunay API, with inputs and outputs in GeoJSON, ready to draw on a map.

# d3.geoVoronoi([data]) · Source, Examples

Creates a new spherical Voronoi layout. data can be passed as an array of [lon, lat] coordinates, an array of GeoJSON features, or a GeoJSON FeatureCollection.

The following methods are similar to d3-voronoi's methods:

# voronoi.delaunay

The geoDelaunay object used to compute this diagram.

# voronoi.x([x])

Sets or returns the x accessor. The default x and y accessors are smart enough to recognize GeoJSON objects and return the geoCentroid of each feature.

# voronoi.y([y])

Sets or returns the y accessor.

# voronoi.polygons([data]) · Source, Examples

Returns the Voronoi tessellation of the data as a GeoJSON collection of polygons. (If there is only one data point, returns the Sphere). Each polygon exposes its datum in its properties.

# voronoi.cellMesh([data]) · Source

Returns the Voronoi tessellation as a GeoJSON mesh (MultiLineString).

# voronoi.triangles([data]) · Source, Examples

Returns the Voronoi tessellation of the data as a GeoJSON collection of polygons. Each triangle exposes in its properties the three sites, its spherical area (in steradians), and its circumcenter.

# voronoi.mesh([data]) · Source, Examples

Returns the Delaunay edges as a GeoJSON mesh (MultiLineString).

# voronoi.links([data]) · Source, Examples

Returns the Delaunay links of the data as a GeoJSON collection of lines. Each line exposes its source and target in its properties, but also its length (in radians), and a boolean flag for links that belong to the Urquhart graph.

voronoi.extent([extent]) and voronoi.size([size]) are not implemented.

Indeed, defining the “paper extent” of the geoVoronoi polygons can be quite tricky, as this block demonstrates.

# voronoi.find(x,y,[angle]) · Source, Examples

Finds the closest site to point x,y, i.e. the Voronoi polygon that contains it. Optionally, return null if the distance between the point and the site is larger than angle degrees.

# voronoi.hull(data) · Source, Examples

Returns the spherical convex hull of the data array, as a GeoJSON polygon. Returns null if the dataset spans more than a hemisphere. Equivalent to:

voronoi(data).hull();

Contours

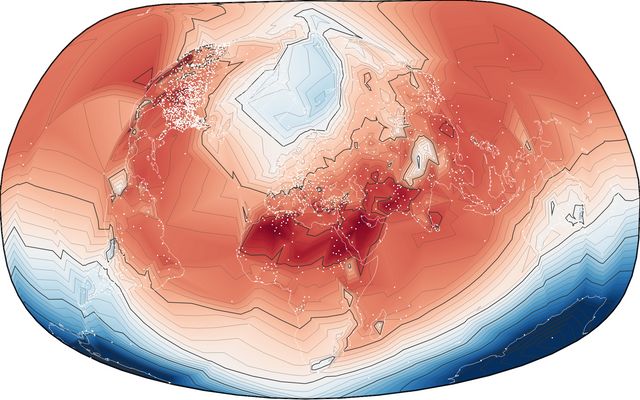
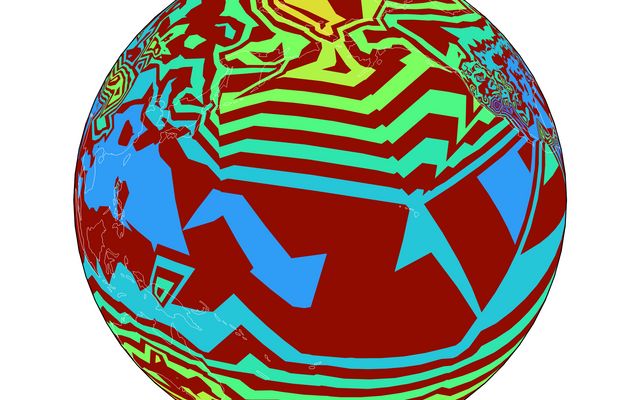
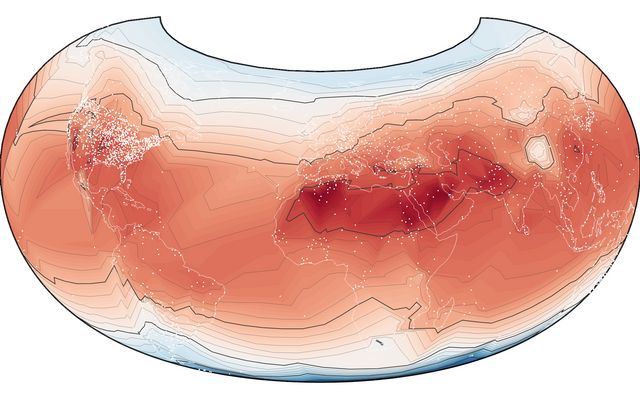
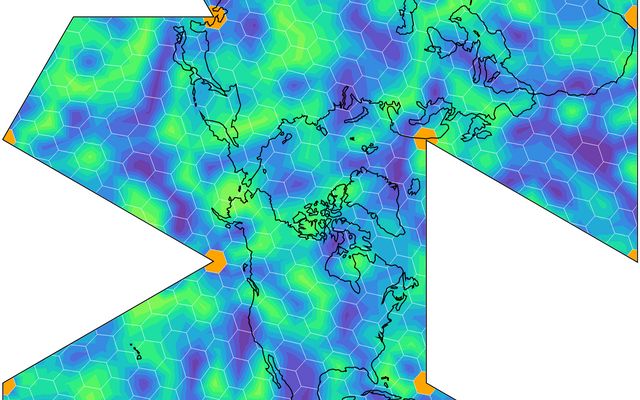
Create spherical contours for non-gridded data.

The API of geoContour is similar to that of d3-contour and d3-tricontour:

# d3.geoContour() · Source, Examples

Constructs a new geocontour generator with the default settings.

geoContour

# geocontour(data) · Examples

Returns an array of contours, one for each threshold. The contours are MultiPolygons in GeoJSON format, that contain all the points with a value larger than the threshold. The value is indicated as geometry.value.

The data is passed as an array of points, by default with the format [lon, lat, value].

# geocontour.contour(data[, threshold])

Returns a contour, as a MultiPolygon in GeoJSON format, containing all points with a value larger or equal to threshold. The threshold is indicated as geometry.value

# geocontour.contours(data)

Returns an iterable over the contours.

geoContour iterator

# geocontour.isobands(data)

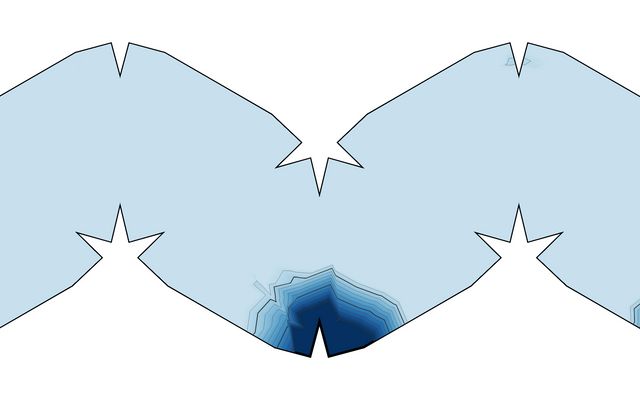
Returns an iterable over the isobands: contours between pairs of consecutive threshold values v0 (inclusive) and v1 (exclusive). geometry.value is equal to v0, geometry.valueMax to v1.

geoContour isobands

# geocontour.x([x])

Sets the x (longitude) accessor. Defaults to `d => d[0]`. If x is not given, returns the current x accessor.

# geocontour.y([y])

Sets the y (latitude) accessor. Defaults to `d => d[1]`. If y is not given, returns the current y accessor.

# geocontour.value([value])

Sets the value accessor. Defaults to `d => d[2]`. Values must be defined and finite. If value is not given, returns the current value accessor.

Blurry geoContours

geoContour and H3

# geocontour.thresholds([thresholds])

Sets the thresholds, either explicitly as an array of values, or as a count that will be passed to d3.ticks. If empty, returns the current thresholds.

Note: d3.geoContour uses the experimental API of d3-tricontour: triangulate, pointInterpolate and ringsort.

Other tools & projections

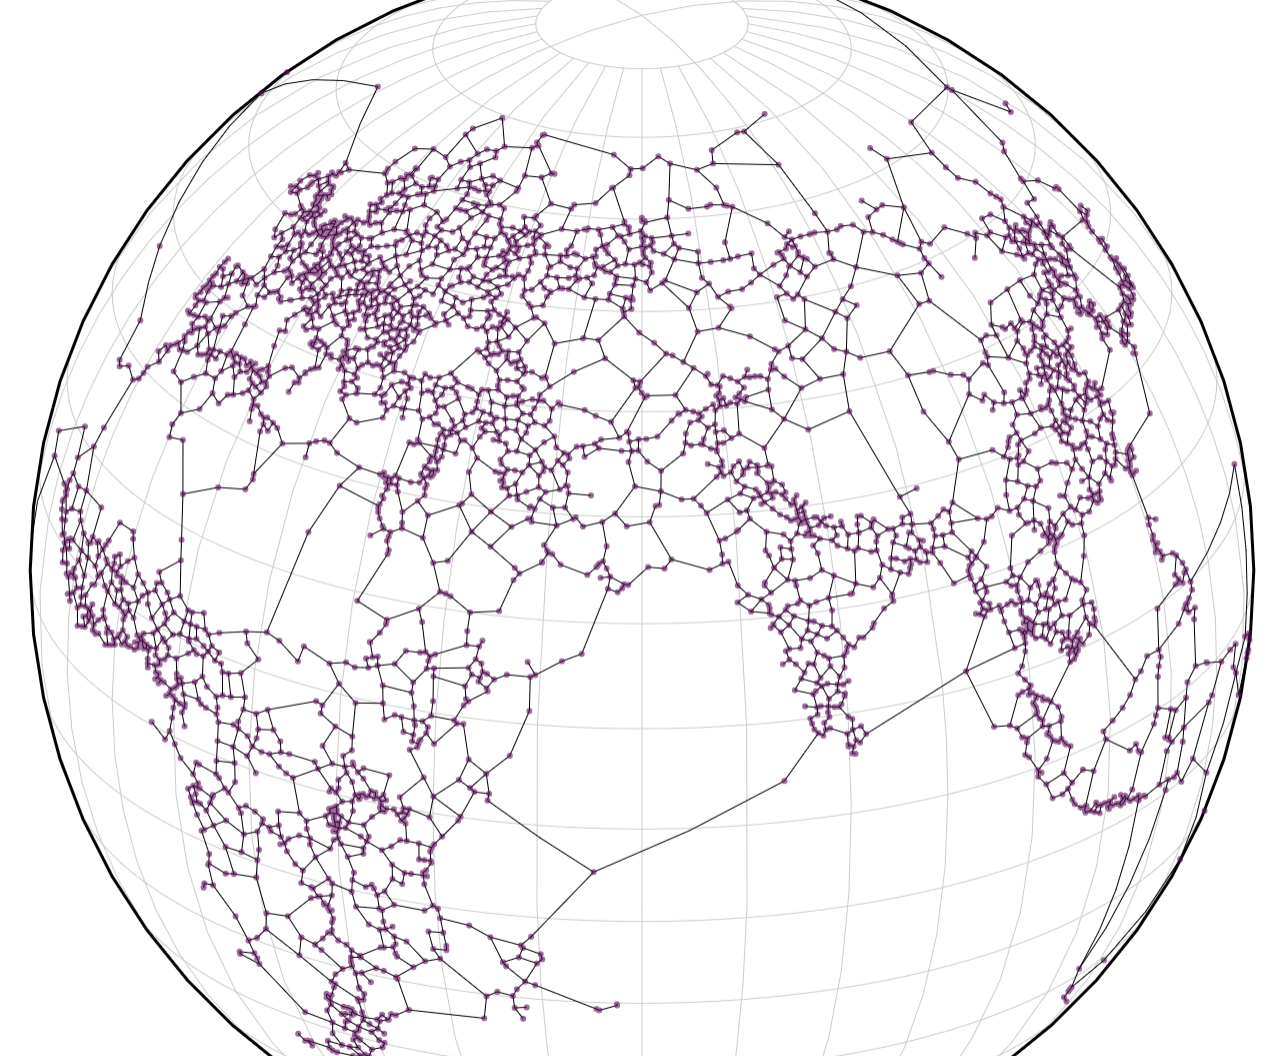
There is no reason to limit the display of Voronoi cells to the orthographic projection. The example below displays the Urquhart graph of top container ports on a Winkel tripel map.

Geo_triangulate converts GeoJSON to triangles for 3d rendering.

Comparison with planar Voronoi Diagrams

  • the Delaunay/Voronoi topology is quite different on the sphere and on the plane. This module deals with these differences by first projecting the points with a stereographic projection, then stitching the geometries that are near the singularity of the projection (the “infinite horizon” on the plane is one point on the sphere).

  • geoVoronoi returns GeoJSON objects, which are often FeatureCollections. By consequence, you will have to change .data(voronoi.polygons()) to .data(geovoronoi.polygons().features), and so on.

  • geoVoronoi is built on d3-delaunay, which is also exposed as d3.geoDelaunay in this library. If you want to have the fastest results, you should try to use d3.geoDelaunay directly (see the examples).

  • geoVoronoi and geoDelaunay offer methods to compute the spherical convex hull and the Urquhart graph of the data set. These can be achieved with the planar Voronoi (hull, Urquhart), but are not part of d3-voronoi or d3-delaunay.

d3-geo-voronoi's People

Contributors

deniscarriere avatar dependabot[bot] avatar fil avatar martinfrances107 avatar nunojpg avatar

Stargazers

 avatar  avatar  avatar  avatar  avatar  avatar  avatar  avatar  avatar  avatar  avatar  avatar  avatar  avatar  avatar  avatar  avatar  avatar  avatar  avatar  avatar  avatar  avatar  avatar  avatar  avatar  avatar  avatar  avatar  avatar  avatar  avatar  avatar  avatar  avatar  avatar  avatar  avatar  avatar  avatar  avatar  avatar  avatar  avatar  avatar  avatar  avatar  avatar  avatar  avatar  avatar  avatar  avatar  avatar  avatar  avatar  avatar  avatar  avatar  avatar  avatar  avatar  avatar  avatar  avatar  avatar  avatar  avatar  avatar  avatar  avatar  avatar  avatar  avatar  avatar  avatar  avatar  avatar  avatar  avatar  avatar  avatar  avatar  avatar  avatar  avatar  avatar  avatar  avatar  avatar  avatar  avatar  avatar  avatar  avatar  avatar  avatar  avatar  avatar  avatar

Watchers

 avatar  avatar  avatar  avatar  avatar  avatar  avatar  avatar  avatar  avatar  avatar  avatar

d3-geo-voronoi's Issues

Unexpected Singularities in Projection

I use this library to take a "point cloud" of data on a sphere and connect them to show the data as a continuous mesh. I am seeing weird singularities at the poles and a circle connecting them as shown here.

image

This image is generated by using globe.gl and plotting a polygon for each triangle in the triangles element of the output of geoDelaunay. I am giving it a set of points in lat long. I create points by converting the lat-long to Euclidian for the polygons.

I would expect as is shown in this post (https://www.redblobgames.com/x/1842-delaunay-voronoi-sphere/) that after projection and triangulation the only hole after triangulation would be at the point at infinity and that would be patched up at the end.

I took a look into how the projecting is being done and don't see a problem, but am not an expert on this kind of thing. Will look into it more myself, but if anyone has any ideas let me know.

Benchmarks: A uniform approach

I am getting into position where I need to start running comparative performance test between this module and my port to rust.

What is missing from this project is a standardised set of benchmarks which I can also port.

With a public module what I am concerned about is two stakeholders with different code-bases depending on this "library"

For a given PR one stakeholder can see a improvement whilst the other sees a degradation in performance.

The solution is to have a comprehensive set of samples with a diverse set of possible example uses.

Then we can make balanced judgements.

Philippe Rivière. [ hi :) ] has provided a high quality sample which I suggest we start using

https://bl.ocks.org/Fil/raw/a9ba8d0d023752aa580bd95480b7de60/

it is a rotating sphere onto which a 50 points are mapped.

a) The FPS from a browser can be used as a measure of goodness
b) Time to first paint can be used to track how long it takes to ingest a number of points.

I want to include in this webpage in a "benchmark" directory

but ... which pulls in the contents of the dist directory

For comparison I want to add buttons so we can compare the FPS for 50, 500, 5,000, 50,000 points.
[ 50,000 points ... I know I can dream... but I think 6000 points from the rust port is doable ]

If other readers can suggest other code samples which will challenge the library in alternative ways then we can add to the directory.

Anyway I will post a PR later this weekend

Faster

Ideas for later:

  • change the arrays into typed arrays when possible (edges => edges2, etc) in the delaunay part
  • use spherical trig for rotation & projection (instead of geoRotation+geoStereographic)
  • use spherical trig for checking if a triangle is clockwise or CCW (instead of geoArea!)

Inconsistent broken projection of a 4 - segment beach ball

Before I begin, I should note that the code quality of this module is high
and I really like the attention to detail that is apparent in the test coverage.

So I should say I am talking about bug .. which has slipped through high quality testing.

I found this as I am porting this module to rust.. my port has alsmost the same coverage as the original but a whole set of new bugs

So I am developing new test patterns to identify problems with my rust - and I have found a pattern which breaks the javascript version.

I have provded two branches which hightlight the problem.

The branches modify the benchmarks
The problem can be exposed from the branches by opening in a browser the file ./benchmark/sphereCanvas.html
[from the project root directory]

[The benchmarks normal function is rendering a rotating sphere with a number of random point under the control of the user ... ]

Senario A
A have created a new branch showing the bug.
https://github.com/martinfrances107/d3-geo-voronoi/tree/broken_4_segment_beech_ball

A rotating sphere with 4 sites to display a 4 - segment beach ball. With sites at

[ [-20, -20], [20, -20], [20, 20], [-20,20]] ( degrees )

as can be seen in this branch .. the rotation is all flickerey it appears, at times, that not all of the of the 4 items are returned by the call to poloygon().

Senario B
https://github.com/martinfrances107/d3-geo-voronoi/tree/offset_4_segment_beach_ball

The position of the sites is offset just slightly .. the flicker is disappears and the slightly wonky beach ball is rendered consitently.

[ [-15, -20], [20, -20], [20, 20], [-20,20]] ( degrees )

Export base functions to compute elements as they are needed

Hello, would it be possible to export "all" the functions in this library so we can create custom/liter geoDelaunay for example ?

My use-case is to use geoDelaunay to create the edges on a big set of points but i am not interested in anything after edges = geo_edges(triangles, points),.
Looking at performance, ~50% of load is used of generating edges and the rest on neighbors,hulls,etc.

Something like this as a basic example is what I am thinking (with export to all the functions inside the .js files):

export * as rawGeoDelaunay from "./src/delaunay.js";
export * as rawGeoVoronoi from "./src/voronoi.js";
export * as rawGeoContour from "./src/contour.js";

Error in hull

This polygon has a broken hull (thanks @HarryStevens for the example).

[
  [-99.99981816168162,35.88112731556315],
  [-99.99981816168162,36.055516432754324],
  [-99.99981816168162,36.49965029279292],
  [-100.00340745567455,36.49965029279292],
  [-100.54539084860848,36.49965029279292],
  [-100.95457036380363,36.49965029279292],
  [-101.08378494754947,36.49965029279292],
  [-101.62217904649046,36.49965029279292],
  [-102.03135856168561,36.50050935248352],
  [-102.16416243942439,36.50050935248352],
  [-103.00405723377233,36.50050935248352],
  [-103.0004679397794,36.60273745566455],
  [-103.0004679397794,37.00048209241092],
  [-102.77793171221711,36.99962303272032],
  [-102.69896724437244,36.995327734267335],
  [-102.04212644366443,36.99275055519555],
  [-102.02776926769268,36.99275055519555],
  [-101.5539824606246,36.995327734267335],
  [-101.06583847758478,36.99790491333913],
  [-100.94380248182482,36.99790491333913],
  [-100.63153390443904,36.99962303272032],
  [-100.08955051150511,37.002200211792115],
  [-100.00340745567455,37.00134115210152],
  [-99.5403885305853,36.99962303272032],
  [-99.45783476874769,36.99962303272032],
  [-99.0019944316443,36.99962303272032],
  [-98.54615409454094,36.998763973029725],
  [-98.34874292492924,36.99790491333913],
  [-98.11184952139521,36.99790491333913],
  [-97.80317023800238,36.998763973029725],
  [-97.46218730867308,36.998763973029725],
  [-97.14632943729437,36.998763973029725],
  [-96.75150709807097,36.998763973029725],
  [-96.52538157651576,36.998763973029725],
  [-96.00134465354652,36.998763973029725],
  [-95.96545171361713,36.998763973029725],
  [-95.78598701397013,36.99962303272032],
  [-95.52396855248551,36.99962303272032],
  [-95.40911114471145,36.99962303272032],
  [-95.07171750937509,36.99962303272032],
  [-95.00711021750217,36.99962303272032],
  [-94.61946646626465,36.998763973029725],
  [-94.61946646626465,36.76681785656856],
  [-94.61946646626465,36.668025992149914],
  [-94.61946646626465,36.49965029279292],
  [-94.56203776237761,36.16203983438834],
  [-94.5512698803988,36.101905656046554],
  [-94.49384117651176,35.759140839498386],
  [-94.47230541255412,35.638872482814826],
  [-94.43641247262472,35.42840285861858],
  [-94.43282317863178,35.38630893377933],
  [-94.44718035460355,34.93358447683476],
  [-94.45435894258942,34.7291282704727],
  [-94.4615375305753,34.507490870298696],
  [-94.46871611856118,34.18963878477784],
  [-94.47589470654707,33.94051147450474],
  [-94.48666258852587,33.638122463414625],
  [-94.51896623446234,33.61664597114971],
  [-94.5871628203282,33.67935732856328],
  [-94.64459152421524,33.66818955258552],
  [-94.64818081820817,33.687947925469246],
  [-94.70919881608816,33.687088865778655],
  [-94.73791316803168,33.705988178971786],
  [-94.77380610796108,33.75495458133581],
  [-94.82764551785517,33.741209626286256],
  [-94.87071704577045,33.745504924739244],
  [-94.94609221962219,33.8125115806058],
  [-94.97121727757278,33.86233704266042],
  [-95.05018174541745,33.864055162041616],
  [-95.12196762527626,33.93106181790817],
  [-95.1542712712127,33.93707523574235],
  [-95.22964644506445,33.961128907079065],
  [-95.25477150301502,33.902712848118476],
  [-95.30861091290913,33.880377296162955],
  [-95.34091455884558,33.869209520185194],
  [-95.46295055460554,33.872645758947584],
  [-95.46295055460554,33.88553165430654],
  [-95.53832572845728,33.87951823647236],
  [-95.56345078640786,33.93192087759877],
  [-95.59934372633725,33.93449805667056],
  [-95.68548678216781,33.88982695275952],
  [-95.75727266202662,33.89240413183131],
  [-95.76086195601955,33.872645758947584],
  [-95.77162983799838,33.84343772946729],
  [-95.8003441899419,33.861477982969824],
  [-95.84700501185011,33.8408605503955],
  [-95.93673736167361,33.88724977368773],
  [-95.94032665566655,33.861477982969824],
  [-96.04800547545474,33.83656525194252],
  [-96.10184488534885,33.84773302792027],
  [-96.09825559135591,33.830551834108334],
  [-96.14850570725707,33.83742431163311],
  [-96.1772200592006,33.76010893947939],
  [-96.22747017510174,33.74808210381103],
  [-96.2956667609676,33.764404237932375],
  [-96.32079181891818,33.694820402994026],
  [-96.36386334683347,33.69224322392223],
  [-96.37822052280522,33.725746551855515],
  [-96.42847063870639,33.77900825267252],
  [-96.50384581255813,33.77385389452894],
  [-96.53256016450165,33.822820296892964],
  [-96.57204239842397,33.819384058130574],
  [-96.62947110231102,33.845155848848485],
  [-96.58998886838867,33.894981310903106],
  [-96.67613192421923,33.90872626595265],
  [-96.70484627616275,33.83484713256132],
  [-96.76945356803567,33.827115595345944],
  [-96.78381074400744,33.86319610235102],
  [-96.83047156591566,33.87522293801938],
  [-96.85200732987329,33.84687396822968],
  [-96.88431097580975,33.8683504604946],
  [-96.9058467397674,33.949961131101304],
  [-96.93456109171092,33.95425642955429],
  [-96.94532897368973,33.94910207141071],
  [-96.99557908959089,33.94910207141071],
  [-96.98481120761207,33.88639071399714],
  [-97.04223991149911,33.83742431163311],
  [-97.08890073340733,33.85374644575445],
  [-97.04941849948499,33.81766593874938],
  [-97.0960793213932,33.79876662555625],
  [-97.08531143941438,33.74378680535805],
  [-97.12479367333673,33.71715595494955],
  [-97.16427590725907,33.7291827906179],
  [-97.20734743517434,33.80993440153401],
  [-97.17145449524494,33.83570619225192],
  [-97.17863308323082,33.89240413183131],
  [-97.21093672916729,33.91645780316803],
  [-97.24682966909668,33.90013566904668],
  [-97.25400825708256,33.864055162041616],
  [-97.30066907899078,33.880377296162955],
  [-97.33297272492725,33.87436387832878],
  [-97.37245495884959,33.819384058130574],
  [-97.44424083870838,33.82367935658356],
  [-97.46218730867308,33.849451147301465],
  [-97.45859801468015,33.903571907809074],
  [-97.48372307263072,33.91559874347743],
  [-97.5626875404754,33.89755848997489],
  [-97.5985804804048,33.91817592254922],
  [-97.58781259842598,33.953397369863694],
  [-97.65600918429183,33.98947787686876],
  [-97.6883128302283,33.98690069779697],
  [-97.73138435814357,33.93707523574235],
  [-97.83547388393883,33.85804174420743],
  [-97.87854541185412,33.85031020699206],
  [-97.97904564365643,33.88982695275952],
  [-97.95392058570586,33.937934295432946],
  [-97.97186705567056,33.93707523574235],
  [-97.94674199771997,33.988618817178164],
  [-97.97186705567056,34.00580001099011],
  [-98.01852787757878,33.99377317532175],
  [-98.08672446344463,34.003222831918315],
  [-98.12261740337402,34.08139726376263],
  [-98.09390305143052,34.111464352933524],
  [-98.10826022740227,34.15441733746337],
  [-98.14056387333873,34.141531442104416],
  [-98.16927822528224,34.11404153200532],
  [-98.24106410514105,34.13294084519845],
  [-98.29490351503514,34.13294084519845],
  [-98.36310010090101,34.15699451653516],
  [-98.42411809878098,34.083974442834425],
  [-98.48513609666097,34.0624979505695],
  [-98.57127915249151,34.144967680866806],
  [-98.61076138641386,34.15699451653516],
  [-98.64665432634325,34.164726053750535],
  [-98.68972585425854,34.13294084519845],
  [-98.76510102811028,34.13637708396083],
  [-98.8117618500185,34.15871263591635],
  [-98.85842267192672,34.161289814988145],
  [-98.91944066980669,34.18190724756247],
  [-98.95174431574316,34.21283339642396],
  [-98.98763725567255,34.22142399332993],
  [-99.0450659595596,34.19822938168381],
  [-99.07736960549605,34.211115277042765],
  [-99.12044113341133,34.2016656204462],
  [-99.12761972139721,34.218846814258136],
  [-99.19222701327013,34.21626963518634],
  [-99.21017348323483,34.33653799186991],
  [-99.27478077510774,34.384645334543336],
  [-99.26042359913599,34.403544647736474],
  [-99.31785230302303,34.407839946189455],
  [-99.38245959489595,34.45680634855348],
  [-99.3968167708677,34.37777285701856],
  [-99.43988829878299,34.37433661825618],
  [-99.47578123871239,34.396672170211694],
  [-99.51885276662766,34.41471242371423],
  [-99.57987076450765,34.41643054309542],
  [-99.60140652846528,34.37433661825618],
  [-99.70908534825348,34.38722251361513],
  [-99.79522840408404,34.45422916948169],
  [-99.84547851998519,34.5066318106081],
  [-99.92803228182281,34.577074705237045],
  [-99.99622886768867,34.56075257111571],
  [-99.99981816168162,34.746309464284636],
  [-99.99981816168162,35.030658221872216],
  [-99.99981816168162,35.18271178710786],
  [-99.99981816168162,35.4223894407844],
  [-99.99981816168162,35.61911410993109],
  [-99.99981816168162,35.88112731556315]
];

voronoi.polygons([data]) outputs non-compliant GeoJSON

Hi!

The current output of polygons looks like this:

{  
   "type":"FeatureCollection",
   "features":[  
      {  
         "type":"Polygon",
         "coordinates": ...
         "properties":...
      },...

According to http://geojson.org/:

Geometric objects with additional properties are Feature objects.

So to make it compliant it should be instead like:

{  
   "type":"FeatureCollection",
   "features":[  
      {  
         "type":"Feature",
         "geometry":{  
            "type":"Polygon",
            "coordinates":...
         },
         "properties":...
      },...
...

Thanks!

Bounding box support for geoVoronoi

Currently one is able to generate Voronoi polygons by passing a set of points. Unfortunately there is no support for bounding box clipping like the Delaunay.vornoi(bbox) or the turf.voronoi(points, { bbox }) function. Is it possible that this functionality can be added or is there another way to achieve this?

Add code coverage

I am measuring my progress in porting this module into rust by the amount to code coverage I see...

That is compared to this module.

It is a simple change to the package.json file have a new test script, So that when I run

npm run coverage

I see this appended to the usual test result.

-------------------|---------|----------|---------|---------|------------------------
File               | % Stmts | % Branch | % Funcs | % Lines | Uncovered Line #s      
-------------------|---------|----------|---------|---------|------------------------
All files          |   93.85 |    72.02 |   98.75 |   96.39 |                        
 d3-geo-voronoi.js |   93.85 |    72.02 |   98.75 |   96.39 | 31,300-315,474,489,495 
-------------------|---------|----------|---------|---------|------------------------

Its adds a new dependancy 'nyc' but it is a popular module with over a million weekly download
https://www.npmjs.com/package/nyc

I am about to generate a PR.

Would pull requests with typescript *.d.ts definition files be welcome

Hi I love this module.. I am happily using it

There is one fly in the ointment.

I am using it in a typescript project.

Currently that mean I need to fake the index.d.ts files so I can invoke this in *.ts and *.tsx files.

import { geoVoronoi } from 'd3-geo-voronoi';

If I create the relevant files would you review and maybe merge my work?

It would be a big task ... so I just want to check before I do anything?

long edges?

Should the mesh contain the long edges? It would be more consistent to have that, and also include the large triangle, so that the union of all triangles would cover the whole globe. It's possible to do so now that the triangulation is clean, but it means we need to insert intermediate points when an edge is 180°.

Ref. daf7b88, reverted in daf7b88

(note: this would be a breaking change)

Extend and correct benchmarking

I want to revisit our current bench-marking ... I will post a PR in the next few days.. but I want to talk about it publicly first.

By benchmark I mean this file.
https://github.com/Fil/d3-geo-voronoi/blob/master/benchmark/sphere.html

I am making progress porting three modules d3-geo, d3-delaunay, d3-geo-voronoi into rust for performance.
In my testing I am starting to find sphere.html a little limiting.

From my perspective - a benchmark should be a battery of test simple to understand but exercise a surprisingly large set of "critical path" ... code sections.

I want to add a new benchmark - pulled from the internet - The simplest world map drawing code snippet.

https://www.d3-graph-gallery.com/graph/backgroundmap_canvas_basic.html

This adds to the bench-marking as ​it is CANVAS based. not SVG based.

It covers sections of code in this module that will be found in any performance heavy user code.
Namely writing directly to the canvas's 2d graphics context

Lastly I want to fix the current benchmark - so looking back at sphere.html.

a) The number of patches is fix... I want to add a range slider so the evaluator can increase or decrease the number of points rendered - As the performance characteristics of mobile and laptop and desktops are different.

b) There is a performance kink in the existing code ..in the browser's "dev tools" performance monitoring tab..
​if you look at the performance graphs about every 4 seconds the is a glitch and for a short time it starts to drop frames.
​I can make to go away with a two line refactor .. if I use requestAnimationFrame instead of redrawing on a timer.

c) It only cover a small patch of the sphere.. it looks better if it cover the whole globe.

Overlapping Voronoi polygons

When I tried to create a Voronoi diagram from a gridded dataset of 4 points (±90, ±45) using geoVoronoi(), the cells seem to overlap. @Fil has graciously pointed out that this is because the polygons have some 180° edges but no intermediate points.

Here's a minimal, reproducible example: https://observablehq.com/d/1433b09bb55a4807. Ideally, each Voronoi cell should be colored either orange or blue. Would love for a way to fix this. Thanks!

screen_cap

Voronoi where each site is a segment instead of a point.

I have a map with one or more polylines, and want to know the segment that is closest to the cursor. I've successfully done this in another library (https://github.com/Voxel8/pyvoronoi), however (besides preferring to be using JS), I'm seeing that on larger scales the voronoi chart is being warped by the earth's curvature, hence this d3-geo-voronoi seems worth a try. Problem is my understanding of geometry isn't sufficient enough to bridge the gap between generating from points to generating from segments. Does anyone please have some advice? Thanks.

geo_hull() Use more semantically meaningful Set and Map.

I have been inspecting this code line by line while I port it over to rust.

This issue is very minor I want to refactor some code that uses

object 'key' => 'value' properties

But I think better structures such as Map and Set should be employed.

let me explain something minor that gives me unease.

  if (_hull[code]) delete _hull[code];
  else _hull[e.join("-")] = true;
}

for example after this loop _hull object will look something like

{ '4-3': true, '3-1': true, '0-4': true, '1-0': true }

A) Given the 'value' in the key: value pair is always a 'true' ... I suggest using a set Set structure so the machine does not need to repeatedly store the value.

B) While this code typical java-script and bug free.. the possible values passes into the if condition are TRUE when the key-value pair is found and NULL/UNDEFINED otherwise ..but if we used the Set method has() then the condition is restricted to just TRUE or FALSE.

Secondly _index is a Map like data structure which is currently a Object.

Anyway I have a patch ...l which I am going to link to this issue.

polygons() not working

Consider:

        let points = {
            "type": "FeatureCollection",
            "features": [
                {
                    "type": "Feature",
                    "id": "north",
                    "properties": {},
                    "geometry": {
                        "type": "Point",
                        "coordinates": [
                            0,
                            20
                        ]
                    }
                },
                {
                    "type": "Feature",
                    "id": "south",
                    "properties": {},
                    "geometry": {
                        "type": "Point",
                        "coordinates": [
                            0,
                            -20
                        ]
                    }
                }
            ]
        }

        let voronoi = d3.geoVoronoi()(points).polygons()

voronoi is now:

{
    "type": "FeatureCollection",
    "features": [
        {
            "type": "Feature",
            "geometry": {
                "type": "Polygon",
                "coordinates": [
                    [
                        [
                            0,
                            0
                        ],
                        [
                            -90,
                            0
                        ],
                        [
                            -180,
                            0
                        ],
                        [
                            90,
                            0
                        ],
                        [
                            0,
                            0
                        ]
                    ]
                ]
            },
            "properties": {
                "site": {
                    "type": "Feature",
                    "id": "north",
                    "properties": {},
                    "geometry": {
                        "type": "Point",
                        "coordinates": [
                            0,
                            20
                        ]
                    },
                    "index": 0
                },
                "sitecoordinates": [
                    0,
                    20
                ],
                "neighbours": [
                    1
                ]
            }
        },
        {
            "type": "Feature",
            "geometry": {
                "type": "Polygon",
                "coordinates": [
                    [
                        [
                            0,
                            0
                        ],
                        [
                            90,
                            0
                        ],
                        [
                            -180,
                            0
                        ],
                        [
                            -90,
                            0
                        ],
                        [
                            0,
                            0
                        ]
                    ]
                ]
            },
            "properties": {
                "site": {
                    "type": "Feature",
                    "id": "south",
                    "properties": {},
                    "geometry": {
                        "type": "Point",
                        "coordinates": [
                            0,
                            -20
                        ]
                    },
                    "index": 1
                },
                "sitecoordinates": [
                    0,
                    -20
                ],
                "neighbours": [
                    0
                ]
            }
        }
    ]
}

As both input points were symmetric to the equator, the voronoi polygons are the north and south hemisphere, but geoVoronoi outputs zero area polygons (lines).

This can be plotted/linted at http://geojsonlint.com/.

Geo Voronoi polygons out of triangles

Hi,
I'm trying to build Voronoi diagram for "infinite horizon" map. The points - are the cities with defined coordinates [lat, lon].

Input: geoJSON

{
  "features": [
    {
      "geometry": {
        "coordinates": [
          2.1699187,
          41.387917
        ],
        "type": "Point"
      },
      "properties": {},
      "type": "Feature"
    },
    {
      "geometry": {
        "coordinates": [
          7.205232,
          43.66049
        ],
        "type": "Point"
      },
      "properties": {},
      "type": "Feature"
    },
    {
      "geometry": {
        "coordinates": [
          12.4942486,
          41.8905198
        ],
        "type": "Point"
      },
      "properties": {},
      "type": "Feature"
    }
  ],
  "type": "FeatureCollection"
}

Links d3.geoVoronoi(geoJSON).links()
image
Triangles d3.geoVoronoi(geoJSON).triangles()
image
Polygons d3.geoVoronoi(geoJSON).polygons()
image

Can't understand what I'm doing wrong. I will appreciate any help on these.

geo_edges: Use the more semantically meaningful Set

The last 2 commits have replaced the generic javascript object {} data objects with Map and Set data structures.

This is the last issue of that form.

I am about to attach a PR which show one of two possible approaches

The PR needs discussion as approach one has possible performance implications where as options two involves a backwards compatible breaking change.

So this set of judgement calls needs careful review.

In this PR to keep the return of geo_edges() to be an array I was forced chain and Array.from() into a .map()

return Array.from(_index).map(d => d.split("-").map(Number));
the JIT compiler may look at the chain of language primitives and do the correct thing - looping only once.

but on the face of it the PR introduces a "double looping structure."

My preferred solution is option two in which the return type of array becomes an iterator

... Obviously this would break all existing code bases in the wild.

making things faster is a concern #7

Maybe we should just leave geo_edges alone
Maybe the apparent double looping is acceptable.
Maybe we need to wait until the next major version number update?

Performance

Loren Petrich's lib uses an algorithm that seems to be in O(n^2). It is unpractical for n > 1000. (d3-voronoi runs in O(n) log(n).)

See http://bl.ocks.org/Fil/704bdbac80ab2e5d741d5fa3662bdf82

Three possibilities:

    1. “I'm sorry, Dave, I'm afraid I can't do that”: let geoVoronoi() log a warning if n > 500 (10s on my computer) and return an error if n > 2000 (2.5 min).
    1. Switch to an approximate algorithm when n > 500 (If we accept bugs around the poles, we can piggy-back on d3-voronoi by using a specific cylindric projection.)
    1. Find and implement a better algorithm.

Recommend Projects

  • React photo React

    A declarative, efficient, and flexible JavaScript library for building user interfaces.

  • Vue.js photo Vue.js

    🖖 Vue.js is a progressive, incrementally-adoptable JavaScript framework for building UI on the web.

  • Typescript photo Typescript

    TypeScript is a superset of JavaScript that compiles to clean JavaScript output.

  • TensorFlow photo TensorFlow

    An Open Source Machine Learning Framework for Everyone

  • Django photo Django

    The Web framework for perfectionists with deadlines.

  • D3 photo D3

    Bring data to life with SVG, Canvas and HTML. 📊📈🎉

Recommend Topics

  • javascript

    JavaScript (JS) is a lightweight interpreted programming language with first-class functions.

  • web

    Some thing interesting about web. New door for the world.

  • server

    A server is a program made to process requests and deliver data to clients.

  • Machine learning

    Machine learning is a way of modeling and interpreting data that allows a piece of software to respond intelligently.

  • Game

    Some thing interesting about game, make everyone happy.

Recommend Org

  • Facebook photo Facebook

    We are working to build community through open source technology. NB: members must have two-factor auth.

  • Microsoft photo Microsoft

    Open source projects and samples from Microsoft.

  • Google photo Google

    Google ❤️ Open Source for everyone.

  • D3 photo D3

    Data-Driven Documents codes.