easystats / easystats Goto Github PK
View Code? Open in Web Editor NEW:milky_way: The R easystats-project
Home Page: http://easystats.github.io/easystats
License: Other
:milky_way: The R easystats-project
Home Page: http://easystats.github.io/easystats
License: Other
Any idea why code blocks in the paramters-website have a dark background, while for performance these are light? Though they both have defined the same css-template in the yaml-file? Or is it not related to the yaml?
Related to #4, but for future reference; once we'll have something valuable, we could also think about the different modes of dissemination. We both have blogs connected to R-bloggers, so that's a start. Maybe we could create, in the future, a "collaborative" blog for easystats. Hopefully, if the project takes off, we might have something interesting to publish 😁
I'm just putting this there, but it would be super cool to have some money to 1) organize some kind of workshop to gather ourselves and spread the news and 2) to be able to decently pay some intern or student to contribute (there are many areas that could be easily improved in the context of a training, such as documentation, testing etc.) and 3) get filthy rich of course
If you hear of any grant call to which we could apply do let it know
Seems like the name "performance" is available on CRAN :)
This could be a good name for covering the computation of all goodness of fit metrics, i.e., whether a model is performant in its prediction of the outcome.
From a design perspective, there could be a set of functions implementing the "computation" per se of non-base indices (Tjur's, nakawaga etc.), starting with compute_R2tjur, compute_R2nakawaga and a set of functions for retrieving these indices from the models, performance_R2tjur(model) etc.
Or, only one set of functions performance_R2foo() that would both be applicable to vectors and matrices (used for index computation), and to models (which would then retrieve the relevant things from the model and do the index computation using the former function).
Can we summarise the next release steps for CRAN?
Packages not affected from the restructuring are bayestestR and performance, which can be released independently. Correct?
It is my pleasure to welcome the king of the reductio ad lineari modelum, the twitter dinosaur, the great @lindeloev to easystats 🎉
Here we are, in what is probably the best open, collaborative and fun project and community since Human evolution itself. It's centred (at least for now) around building tools surrounding statistical models, with a focus on user experience; carefully considering functions' design, names, argument names etc. to maximize clarity, intuitiveness, and accessibility. Our target audiences are both beginners (to which we provide a way of easily obtaining complex and relevant information) and experts, that can use our specialized packages and incorporate them in their work. In sum, make R stats fun again! 😁
As for what is expected of members? Nothing! But feel free to comment, give suggestions in issues or such whenever you feel comfortable enough. You might see us ping specific people from time to time, but we encourage everyone to give their opinion and thoughts even if not directly pinged (or just reacting with a 👍 or a 😠)
I'd recommend to "watch" (follow) all the 11 easystats repos, to stay tuned to what's going on, as we usually work in parallel :)
As for a "roadmap context", We are currently working at stabilizing the current packages that are on CRAN, as well as aiming to release estimate and correlation soon, to then be able to finally ship the last piece of the current puzzle, report. Feel free to share any thoughts, ideas, suggestions or fun facts.
Glad to have you onboard
@pdwaggoner @mattansb @IndrajeetPatil @humanfactors @jacob-long
As you might have seen, one of the vignette is a bit more detailed and looks almost like a paper. Actually, the whole bayestestR package came from a paper that I started writing to compare different indices together, but the implementation (in psycho) was a bit messy and after some preliminary reviews, I've decided to reimplement the functions in a separate and dedicated package, and ended up mostly copying the manuscript to the vignettes.
However, I would still like to try to publish some sort of guide and comparison of indices (including the comparison with the frequentist p value, about which almost every already-convinced-Bayesian says "it's doesn't make sense" but probably is one of the things that many frequentists interested in switching to the Bayesian framework would like to see to feel "comfy" and secure - giving them some references and benchmarks).
Anyway, the current version tries to see how the different "indices of existence" are influenced by different things such as sample size, noise, priors specification and so on. The end goal was to give a "intuitive" feeling of these metrics to users and neophytes and draw reporting guidelines (that would be then implemented in report 😏 ). However, one of the thing that could be improved is the generalizability, as the current results are based on a simulation of a simple regression model. But I am not sure what is the most smart way of extending the analysis to different models to see if and how it influence sthe metrics.
Would you be interested in such collaborating around such paper? Since I'd like to try a continuous and open writing process, through the progressive enhancement of the vignettes, there is absolutely no time pressure of any kind. Once we would be happy with the vignettes, we could try submitting its content to a journal. What are your thoughts?
A warm welcome to @IndrajeetPatil to easystats 🎉
There isn't much left to be said that hasn't already been written somewhere. But long story short,
easystats is an open and collaborative project mainly centred (at least for now) around building tools surrounding statistical models, with a focus on user experience; carefully considering functions' design, names, argument names etc. to maximize clarity, intuitiveness, and accessibility.
Do not hesitate to comment, give suggestions or such whenever you feel comfortable enough. It might be useful to "watch" (follow) all the easystats repos, to be notified of what's going on, as we usually work in parallel :)
Just to give you some context, the work is currently focused on the following roadmap:
Feel free to share any thoughts, ideas or dank memes
Number of functions associated with PCA/FA and cluster analysis is increasing in parameters, so I thought if it would make sense (in the near or far future) to move these into an own package?
I've received questions about what's the right way to cite the package(s).
One "guidelines" option would be to recommend citing the particular package used + general easystats citation. For instance citing insight + easystats, or bayestestR + easystats etc.
Unfortunately, we are currently nowhere near having something ready for the general easystats citation, which will be possible once we have released most of the core packages.
However, we could maybe consider drafting a very small and preliminary preprint for easystats (presenting the general aim and packages), which might immediately start to be cited. Then, we would improve this preprint until we submit it to a journal. Hopefully, the citations would transfer to the published version.
Another brick of the structure appears to be functions surrounding the model's parameters. This might include consistent parameters tables extraction (similar to what broom does), which might have its place in insight, and additional indices computation (CIs, p values, ROPEs and so forth). I am not sure whether this should be a separate package or included in the "performance" package. What do you think?
This is sort of a question, but I do think any answers would be well placed in a wiki or some form of contribution guidelines documentation. In short, I'm actually not sure the best way to set setup easystats in a development environment. There's really two parts to this:
[✔ - Not issue for me] Firstly, should a new user want to help contribute, my understanding is that they would need to first install all easystats packages on the dev branch
install_easystats_dev <- function(){
  devtools::install_github(c("easystats/insight",
                             "easystats/bayestestR",
                             "easystats/performance",
                             "easystats/parameters",
                             "easystats/effectsize",
                             "easystats/correlation",
                             "easystats/estimate",
                             "easystats/see",
                             "easystats/report"),
                           ref = "dev",
                           upgrade = "never")
}
This isn't documented on the main page, and while it's certainly not a big issue, the instructions in the README.md imply to me that you'd first devtools::install_github("easystats/easystats") and then call install_easystats_dev, but this seems excessive of course. I actually should note that I have had a few troubles installing with install_easystats_dev when I've already had dev packages installed, but I haven't really had time to debug
[❓ My confusion] For packages that I contribute too, or modify, I obviously have my own fork of the package. I then develop a branch on this, and make sure I am regularly updating the other packages to the dev branch. To be honest, this actually works fine, but it does make it hard to scale up to keeping track of developing multiple packages in this expanding and quite large ecosystem.
I'm guessing there's an alternative in which I can fork and then clone every single easystats package, but this is of course completely overkill and unmaintainable for my brain. I imagine this is what you have setup @DominiqueMakowski? 🤯
One issue here is in debugging problems users that users report on the master branches, or for creating an isolated environment for developing a package (and not ruining my existing install of easystats — e.g., development of insight). I've been thinking about setting up an renv, but given the cross dependencies, but I'm not sure if this is overkill again, and I'm sure there's a better solution. 😫
TL;DR: How do you set up your easystats development environment? How isolate production from development? I think whatever answers emerge here would be worth documenting a best practice to help contributors come up to speed.
I landed at this because tonight I landed at a bug in report which effectively was caused by an older development version of parameters, and I just reinstalled everything from scratch.
Best all 😊
This issue just to warmly welcome @mattansb to easystats 🎉
Just to contextualise a bit (we should write down our "mission" somewhere, - once (if) we defined it
Currently, part of what makes easystats what it is is a focus on user experience (and especially non-programmers). We try to put some thoughts into the functions' design, names, argument names etc. to maximize clarity, intuitiveness, and accessibility.
It seems from your packages like your interest lies more in the Bayesian approach. However, feel free to share your other interests, skills, wishes and dreams, so we can spam-ping you in possibly relevant issues 😉.
Also, you might want to "watch" (follow) all the easystats repos, to be notified of what's going on, as we usually work in parallel :) Do not hesitate to comment on things if you have any suggestions or thoughts.
@DominiqueMakowski
I'm not sure, but I thought that ggeffects might fit into the easystats-philosophy, though it's a "closed" package including both computation and plotting / printing... But: it aims at easily getting marginal effects, and meanwhile has also reduced package dependencies to a minimum, thus it's rather light-weight...
I'm a bit undecided, and in no way offended it you would opt against having ggeffects here...
I was admiring looking at the functions list and I thought, it would be funny to do some clustering/network analysis as they do with texts to visualise (and summarise) the different types and groups of functions... Unfortunately, I have no idea how to do that 😅
Should we version cap our own packages so it forces the user to update easystats dependencies whenever he updates a piece, to have a fully compatible set?
For instance, the current version of parameters relies on the latest bayestestR. Should we add a cap in the DESCRIPTION; imports: bayestestR (>= 0.1.6)?
Following conventions apply to the easystats-ecosystem, to ensure that function and argument names as well as element names for return-values follow a consistent pattern across all packages.
Importing other packages
Helper-functions
tibble::has_name()), to reduce dependencies.Function names
get_*() to get data, find_*() to find information, or performance, performance_*() to compute measures of model quality, check_*() to check model assumptions...). (e.g., .do_some_internal_stuff()).Argument names
Element / Column names (for returned data frames)
Parameter)ROPE_Percentage, Prior_Scale)CI_high)Median_standardized, ROPE_percentage)ESS, MCSE, ROPE)p, pd, Rhat)high or low in CI_high or CI_low)Hi @pdwaggoner, and welcome to easystats 🎉! We are very happy to have you onboard 😀
As you see, it's a very WIP project, with quite an open and collaborative spirit. Currently, it is mainly focused around building tools surrounding statistical models (especially regressions), with an ecosystem of packages designed to work together (but supporting different aspects, such as extraction, computation or formatting of things). That being said, the future is yet to be shaped.
Currently, I would say (@strengejacke might complete or correct) that what makes easystats what it is is a focus on user experience (and especially non-programmers). We try to put some thoughts into the functions' design, names, argument names etc. to maximize clarity, intuitiveness, and accessibility.
Daniel and myself are, I believe, using quite similar methods in our research (mixed models) and are both Bayesian enthusiasts. Daniel has a super impressive knowledge of everything (and of the modelling R framework), whereas I have developed an interest in best practices (exploring them and helping people implementing them).
Anyway, we would be interested in knowing about your ideas, interests and skills (to be able to spam you by mentioning you in the relevant issues 😈).
Also, you might want to "watch" (follow) all the easystats repos, to see what's going on :)
(and do not hesitate to talk around about it 😉)
Thanks for your interest!
Whoever succeeds in fixing the formatting of the README page (having the logos on one row and the paragraph below) will be rewarded by an enormous amount of
I think about giving a "lightning talk" (small talk to make people aware of something) at the next Hamburg-R-Users meeting, to introduce easystats, and maybe make people interested in our goal, possibly contributing by testing, providing code, giving feedback etc.?
library(VGAM)
#> Loading required package: stats4
#> Loading required package: splines

# Nonparametric proportional odds model
pneumo <- transform(pneumo, let = log(exposure.time))
fit <- vgam(
  formula = cbind(normal, mild, severe) ~ s(let),
  cumulative(parallel = TRUE),
  data = pneumo,
  trace = FALSE
)

insight::get_parameters(fit)
#>       Parameter  Estimate    Component
#> 1 (Intercept):1  9.117550  conditional
#> 2 (Intercept):2 10.019252  conditional
#> 3        s(let) -2.439717 smooth_terms

parameters::ci(fit)
#> Error in standard_error.vglm(model, component = component): no slot of name "coef3" for this object of class "summary.vgam"

parameters::model_parameters(fit)
#> Error in cs[, 3]: incorrect number of dimensions

performance::model_performance(fit)
#> Can't extract residuals from model.
#> Error in (function (..., row.names = NULL, check.rows = FALSE, check.names = TRUE, : arguments imply differing number of rows: 0, 1
Created on 2019-11-22 by the reprex package (v0.3.0)
devtools::session_info()
#> - Session info ---------------------------------------------------------------
#>  setting  value
#>  version  R version 3.6.1 (2019-07-05)
#>  os       Windows 10 x64
#>  system   x86_64, mingw32
#>  ui       RTerm
#>  language (EN)
#>  collate  English_United States.1252
#>  ctype    English_United States.1252
#>  tz       Europe/Berlin
#>  date     2019-11-22
#>
#> - Packages -------------------------------------------------------------------
#>  package     * version    date       lib source
#>  assertthat    0.2.1      2019-03-21 [1] CRAN (R 3.6.0)
#>  backports     1.1.5      2019-10-02 [1] CRAN (R 3.6.1)
#>  bayestestR    0.4.0      2019-10-20 [1] CRAN (R 3.6.1)
#>  callr         3.3.2      2019-09-22 [1] CRAN (R 3.6.1)
#>  cli           1.1.0      2019-03-19 [1] CRAN (R 3.6.0)
#>  crayon        1.3.4      2017-09-16 [1] CRAN (R 3.5.1)
#>  desc          1.2.0      2019-11-11 [1] Github (r-lib/desc@61205f6)
#>  devtools      2.2.1      2019-09-24 [1] CRAN (R 3.6.1)
#>  digest        0.6.22     2019-10-21 [1] CRAN (R 3.6.1)
#>  ellipsis      0.3.0      2019-09-20 [1] CRAN (R 3.6.1)
#>  evaluate      0.14       2019-05-28 [1] CRAN (R 3.6.0)
#>  fs            1.3.1      2019-05-06 [1] CRAN (R 3.6.0)
#>  glue          1.3.1      2019-03-12 [1] CRAN (R 3.6.0)
#>  highr         0.8        2019-03-20 [1] CRAN (R 3.6.0)
#>  htmltools     0.4.0      2019-10-04 [1] CRAN (R 3.6.1)
#>  insight       0.7.0      2019-11-20 [1] local
#>  knitr         1.26       2019-11-12 [1] CRAN (R 3.6.1)
#>  magrittr      1.5        2014-11-22 [1] CRAN (R 3.5.1)
#>  memoise       1.1.0      2017-04-21 [1] CRAN (R 3.6.0)
#>  parameters    0.3.0      2019-11-19 [1] Github (easystats/parameters@155a843)
#>  performance   0.4.0.1    2019-11-19 [1] local
#>  pkgbuild      1.0.6      2019-10-09 [1] CRAN (R 3.6.1)
#>  pkgload       1.0.2      2018-10-29 [1] CRAN (R 3.6.0)
#>  prettyunits   1.0.2      2015-07-13 [1] CRAN (R 3.5.1)
#>  processx      3.4.1      2019-07-18 [1] CRAN (R 3.6.1)
#>  ps            1.3.0      2018-12-21 [1] CRAN (R 3.6.0)
#>  R6            2.4.1      2019-11-12 [1] CRAN (R 3.6.1)
#>  Rcpp          1.0.3      2019-11-08 [1] CRAN (R 3.6.1)
#>  remotes       2.1.0      2019-06-24 [1] CRAN (R 3.6.0)
#>  rlang         0.4.1      2019-10-24 [1] Github (r-lib/rlang@30feeac)
#>  rmarkdown     1.17       2019-11-13 [1] CRAN (R 3.6.1)
#>  rprojroot     1.3-2      2018-01-03 [1] CRAN (R 3.5.1)
#>  sessioninfo   1.1.1      2018-11-05 [1] CRAN (R 3.6.0)
#>  stringi       1.4.3      2019-03-12 [1] CRAN (R 3.6.0)
#>  stringr       1.4.0      2019-02-10 [1] CRAN (R 3.6.0)
#>  testthat      2.3.0      2019-11-05 [1] CRAN (R 3.6.1)
#>  usethis       1.5.1.9000 2019-11-13 [1] Github (r-lib/usethis@c5f1e7f)
#>  VGAM        * 1.1-2      2019-11-21 [1] CRAN (R 3.6.1)
#>  withr         2.1.2      2018-03-15 [1] CRAN (R 3.5.1)
#>  xfun          0.11       2019-11-12 [1] CRAN (R 3.6.1)
#>  yaml          2.2.0      2018-07-25 [1] CRAN (R 3.5.1)
#>
#> [1] C:/Users/inp099/Documents/R/win-library/3.6
#> [2] C:/Program Files/R/R-3.6.1/libraryAlthough the package names have high face validity, it still might not be 100% clear if after fitting a model I should use parameters or estimate? For a Bayesian model, should I also or only use bayestestR? Maybe a combination of these? And what exactly the difference is between some of the functionality between these packages?
I think it could be useful to have some sort of flowchart or diagram to help users navigate the various easystats packages (inspired by the new insight figure). A sort of "So you've fit a model - what do you want to do next?" kind of map.
https://twitter.com/github/status/1118562875830882304
Let's start by performance as I expect some tweets soon
Hi guys - I have been thinking about the need for a clean, simple interface to send interested users to. The reason for this need, from my perspective is threefold: First, while the Github page is obviously expansive and super useful, its definitely geared more toward developers, or at least people who understand programming more than many users who likely use our packages. Second, though the blog is great, its only a small part of easystats. And third, though many vignettes via pkgdown are super helpful, they're package-specific.
Thus, I felt like we would really benefit from having a central, clean, easy-to-use web presence to which we could point anyone who is interested in the "Easyverse", which would serve as the home base or launching pad (pick your preferred metaphor) for all things-easystats.
With that said, I have pulled together a super simple version of a website with a clean interface (via blogdown).
To take a look to see what you think follow these steps:
Download the repo I just created for it: https://github.com/pdwaggoner/easyverse
On your own machine in a new R session, simply open the file: easyverse.Rproj
Once opened and working from within the easyverse R project, in the console run: devtools::install_github('rstudio/blogdown')
Load the latest version of the library: library(blogdown)
Then finally run: serve_site()
It should pop up in the viewer within the session, at which point you can either navigate from within Rstudio, or you can select "Open in a new window" from within the Viewer pane. It should open in a new tab on your default web browser.
Note also, if we go this direction, I think updating our monicker to the "easyverse" (instead of easystats) would be a good idea, as its a bit more all encompassing. Just an idea, though.
Anyway, take a look and let me know what you all think. If you don't like it, truly no hard feelings, as I only spent a few hours developing this template. It's no big deal if you don't like this direction, truly! I just thought it could be a cool thing as we continue to formalize as a group. I would welcome any and all feedback.
Do you still have dplyr 0.7.8 installed? I can't find our discussion where you posted the str() of a grouped data frame grouped with dplyr 0.7.8... I need once again the information on grouped df's from dplyr < 0.8
Dear easystats friends
I'm planning some releases in January:
plot.si()I think that all relevant issues are addressed and features implemented, or do you have any suggestions?
I cannot install all the easystats packages.
devtools::install_github("easystats/easystats")
Downloading GitHub repo easystats/easystats@master
These packages have more recent versions available.
Which would you like to update?
1: insight (0.3.0 -> 0460c7695...) [GitHub]
Enter one or more numbers separated by spaces, or an empty line to cancel
1: 1
insight (0.3.0 -> 0460c7695...) [GitHub]
parameters (NA -> 53bedb12d...) [GitHub]
correlation (NA -> 273f9fcb0...) [GitHub]
estimate (NA -> eb70bd661...) [GitHub]
report (NA -> e1ba97369...) [GitHub]
Downloading GitHub repo easystats/parameters@master
✔ checking for file ‘/private/var/folders/cl/hcgkwrb55ls2pmv5kkrslvm40000gn/T/RtmpgvFoaA/remotes1cc225ed918/easystats-parameters-53bedb1/DESCRIPTION’ ...
─ preparing ‘parameters’:
✔ checking DESCRIPTION meta-information ...
Warning: bad markup (extra space?) at describe_distribution.Rd:13:131
Warning: bad markup (extra space?) at model_parameters.BFBayesFactor.Rd:15:131
Warning: bad markup (extra space?) at model_parameters.BFBayesFactor.Rd:24:135
Warning: bad markup (extra space?) at model_parameters.BFBayesFactor.Rd:26:79
Warning: bad markup (extra space?) at model_parameters.stanreg.Rd:16:131
Warning: bad markup (extra space?) at model_parameters.stanreg.Rd:24:135
Warning: bad markup (extra space?) at model_parameters.stanreg.Rd:26:79
Warning: bad markup (extra space?) at model_parameters.stanreg.Rd:30:161
─ checking for LF line-endings in source and make files and shell scripts
─ checking for empty or unneeded directories
Removed empty directory ‘parameters/docs’
Removed empty directory ‘parameters/pkgdown’
Removed empty directory ‘parameters/vignettes’
─ looking to see if a ‘data/datalist’ file should be added
─ building ‘parameters_0.1.0.tar.gz’
Currently, to make automatic updates work in the easystats package, we don't import the packages. However, this causes troubles for people who have not already installed all easystats packages (including GitHub only packages) before running the easystats package. This is probably the situation for most users.
I would suggest it's more useful to import packages and only to say which packages are out of date and should be updated manually after restarting the R session?
right now I tried loading easystats without internet, and had this error:
> library(easystats)
Warning: unable to access index for repository https://cran.r-project.org/src/contrib:
  cannot open URL 'https://cran.r-project.org/src/contrib/PACKAGES'
Error: package or namespace load failed for ‘easystats’:
 .onAttach failed in attachNamespace() for 'easystats', details:
  call: `[.data.frame`(easystats_versions, , c("package", "local"))
  error: undefined columns selected
Can someone confirm?
I tried to install easystats/easystats today but it fails with following error:
devtools::install_github("easystats/easystats")
# Downloading GitHub repo easystats/easystats@master
# Error: Missing commas separating Remotes: 'easystats/estimate
#	easystats/see
# 	easystats/report'
(R version 3.5.3 - Platform: x86_64-apple-darwin18.2.0 (64-bit) - devtools 2.0.2)
What do you think which light weight packages we need? What core tasks should these focus on?
today see was the first of our packages reaching 100 stars ⭐️ 🎉
I like to believe it's only the start :)
The project is only 10 times bigger (89% CI [9.2, 10.7], p < .01) than what was originally thought. And that is thank to all of you for being part of this small team and contributing one way or another.
And there is still much to be done for an easyfuture 😉
@strengejacke @pdwaggoner @mattansb @IndrajeetPatil @humanfactors
Very happy new year from the easysteam team to the easyteam and the easystats users 🎉 May this year be the wisdom year for us, with a perfecting and stabilising ecosystem. I wish us more awesome features and more outreach (blogposts, publications, tweets and word of mouth) so that more users are pulled from the dark side, where they are chained by their fear of stats and R, and brought to the light side of best practices and honest science. We will need all our and your help to defeat the challenges to come...
Palpatine's maniacal laugh resonates
Looking forward to the future
@strengejacke @pdwaggoner @mattansb @IndrajeetPatil @humanfactors @jacob-long @lindeloev
I have this error message
Errore: Failed to install 'easystats' from GitHub:
Failed to install 'insight' from GitHub:
lazy-load database '/Library/Frameworks/R.framework/Versions/3.6/Resources/library/prettyunits/R/prettyunits.rdb' is corrupt
Inoltre: Warning message:
In paste0(" (", pretty_dt(elapsed), ")") :
internal error -3 in R_decompress1
I used devtools as you suggest here.
How can I solve this?
Thanks
As our small ecosystem is slowly starting to make sense in terms of scope and functionalities, and its first baby is going out to CRAN, I am starting to think about future ways of dissemination.
What in your opinion should be the preferred medium of dissemination? Our respective blogs? A new easystats blog (possibly located here, and possibly created with blogdown, so we can (both) easily contribute and create new posts with Rmd)? Something else?
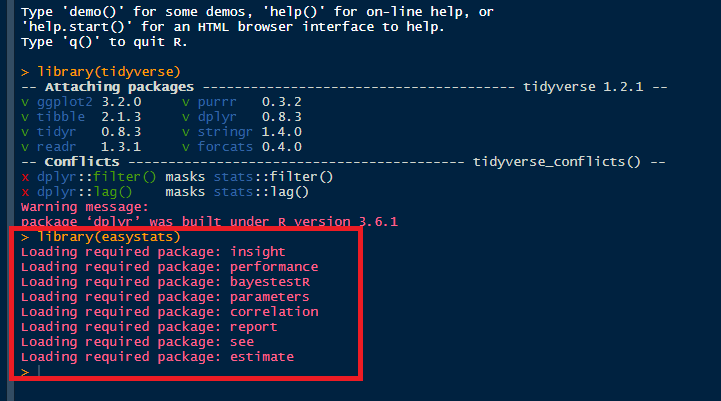
Would be nice to have something less verbose like "easystats successfuly loaded!" rather than these red messages
Welcome to @humanfactors to easystats 🎉
I am personally happy to have you here in as it seems that you are the first member in my timezone 😁
So for the traditional introduction, easystats is an open and collaborative project mainly centred (at least for now) around building tools surrounding statistical models, with a focus on user experience; carefully considering functions' design, names, argument names etc. to maximize clarity, intuitiveness, and accessibility. Our target audiences are both beginners (to which we provide a way of easily obtaining complex and relevant information) and experts, that can use our specialized packages and incorporate them in their work.
Do not hesitate to tell us a bit more about who you are, what are your interests and what skills (if any) you're are interested to develop. After all, this project is also the occasion for us to experiment and learn
Feel free to comment, give suggestions or such whenever you feel comfortable enough. You might see us ping specific people from time to time, but we encourage everyone to give their opinion and thoughts even if not directly pinged (or just reacting with a 👍).
I can only recommend to "watch" (follow) all the 11 easystats repos, to be notified of what's going on, as we usually work in parallel :)
Just to give you some context, the work is currently focused on the following roadmap:
These two packages are the foundations of the report package, which will depend on them. Once they are "stabilized" (especially parameters), we will be able to give report the love it deserves and make it available to the world 😉
Anyway, feel free to share any thoughts, ideas, suggestions or good jokes.
Here is where we can more succinctly workshop an idea for approaching the ML world from an easystats perspective. Per @strengejacke 's suggestion, I wanted to just get the conversation started for a simple function idea to add to performance (based on model_performance.lm):
# quick idea for cluster objects (kmeans, hierarchical, etc.)
model_performance.cluster <- function(d, x, metrics = "all", ...) {

  if (!requireNamespace("fpc", quietly = TRUE)) {
    stop("Package \"fpc\" needed for this function to work. Please install it.",
         call. = FALSE)
  }

  if (!requireNamespace("factoextra", quietly = TRUE)) {
    stop("Package \"factoextra\" needed for this function to work. Please install it.",
         call. = FALSE)
  }

  if(!is.data.frame(d)) {
    stop('"d" must be data frame\n',
         'You have provided an object of class: ', class(d)[1])
  }

# requring an "eclust" object here, because the eclust function from factoextra allows for specifying many types of clustering algorithms (e.g., diana, pam, hierarchical, kmeans, etc.)
  x <- try(methods::as(x, "eclust", strict=TRUE))
  if (!inherits(x, "eclust")){
    stop('"x" must be a eclust object',
         'You have provided an object of class: ', class(x)[1])
  }

  # calculate and store validation stats for cluster model
  cluster_stats <- fpc::cluster.stats(stats::dist(d), x$cluster)

  if (all(metrics == "all")) {
    metrics <- c("cluster.number", "cluster.size", "average.between", "average.within",
                 "silhouette.widths", "within.cluster.ss", "dunn", "rand", "vi")
  }

  out <- list()

  # cluster.number: number of clusters
  if ("cluster.number" %in% metrics) {
    out$cluster.number <- cluster_stats$cluster.number
  }

  # cluster.size: number of obs in each cluster
  if ("cluster.size" %in% metrics) {
    out$cluster.size <- cluster_stats$cluster.size
  }

  # average.between: average distance between clusters
  if ("average.between" %in% metrics) {
    out$average.between <- cluster_stats$average.between
  }

  # average.within: average distance within clusters
  if ("average.within" %in% metrics) {
    out$average.within <- cluster_stats$average.within
  }

  # clus.avg.silwidths: average silhouette widths
  if ("silhouette.widths" %in% metrics) {
    out$silhouette.widths <- cluster_stats$clus.avg.silwidths
  }

  # within.cluster.ss: within clusters sum of squares
  if ("within.cluster.ss" %in% metrics) {
    out$within.cluster.ss <- cluster_stats$within.cluster.ss
  }

  # dunn: Dunn index
  if ("dunn" %in% metrics) {
    out$dunn <- cluster_stats$dunn
  }

  # corrected.rand: (corrected) Rand index assesses cluster similarity
  if ("rand" %in% metrics) {
    out$rand <- cluster_stats$corrected.rand
  }

  #vi: Meila’s variation of information (VI) index assesses cluster similarity
  if ("vi" %in% metrics) {
    out$vi <- cluster_stats$vi
  }

  out <- as.data.frame(out)
  row.names(out) <- NULL
  out
}
Is this more in line with something you're considering? If not, let me know as there are many directions we could take this.
Re: caret, I think it would take a bit more careful thought, as with most of the more advanced ML techniques, as there is much more behind "fitting" a model, such as tuning algorithms, creating and iterating over training and testing data sets, and so on. Its significantly more involved (though not overly arduous) than fitting a basic lm or glm, for example. Let me know your thoughts here, and we can decide how to best move forward in the ML world as it makes sense with the mission and focus of the easyverse (very nice, by the way ;) , love it)
This code-chunk in lines 122- fails...
dependency_graph_df <- ggnetwork::ggnetwork(
  dependency_graph
  , layout = "fruchtermanreingold"
  , arrow.gap = 0.015
  , layout.par = list(niter = 5000)
)I am not sure if this is addressable, but update doesn't seem to work after loading:
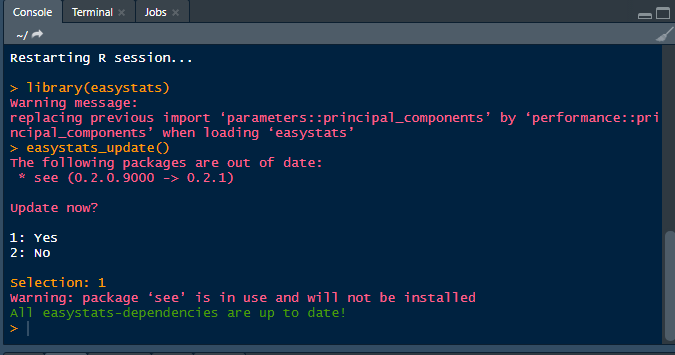
Maybe we can force the installation?
Was thinking about the writing on the vignette for bayestestR, for the introductory examples, and it needs some plots to show the posteriors, visualise the indices and such. Hence, we might want to push these plotting functions for bayestestR :)
So, about the name... any ideas?
Is there a styling convention easystats packages are following?
I personally follow tidyverse style guide in my packages (https://style.tidyverse.org/) and use styler (https://github.com/r-lib/styler) package to stylize code.
What would you consider to be the next packages (order of submission) to be released on CRAN?
Does following order make sense?
I personally would currently focus on performance, as I have still some parts to contribute (ICC etc.). Still haven't heard anything from CRAN yet according insight, though they wrote that it takes approx. 10 working days to hear from them (would be by the end of this week).
Two of our packages that are on CRAN are already in task views (effectsize, parameters). We may think of recommending "bayestestR" for the Bayes task view as well?
https://www.tidyverse.org/articles/2019/04/testthat-2-1-0/
context is deprecated
Is there any particular reason why we are not checking package builds on Windows CI services like AppVeyor?
Currently, we only have Travis builds for linux and macOS, but it will be good to have the same for Windows platform.
If you agree, I can set up yaml files for repos.
Originally from here.
One of the most common error in easystats in the stopping related to the absence of a necessary package. Ideas for a template of this error can be:
stop("This function requires the package 'X' to be installed. Please install by running 'install.packages(X)' and run the function again ;-)")
A very warm welcome to @jacob-long to easystats 🎉, creator of awesome and popular packages such as panelr and interactions.
It is our pleasure to have you there :)
A bit about us, easystats is an open and collaborative project mainly centred (at least for now) around building tools surrounding statistical models, with a focus on user experience; carefully considering functions' design, names, argument names etc. to maximize clarity, intuitiveness, and accessibility. Our target audiences are both beginners (to which we provide a way of easily obtaining complex and relevant information) and experts, that can use our specialized packages and incorporate them in their work.
As for what is expected of members? Nothing! But feel free to comment, give suggestions in issues or such whenever you feel comfortable enough. You might see us ping specific people from time to time, but we encourage everyone to give their opinion and thoughts even if not directly pinged (or just reacting with a 👍)
I can only recommend to "watch" (follow) all the 11 easystats repos, to be notified of what's going on, as we usually work in parallel :)
As for a "roadmap context" (where we're currently at), we just released parameters on CRAN, and hard work is currently done to extend its support. General improvements and fixes are brought to insight, and the next planned CRAN release will be hopefully estimate (for which you might want to share your expertise and opinion, since it has similar features to your interactions
Anyway, feel free to share any thoughts, ideas, suggestions or memes.
Welcome to you, easyjacob 🙌
@strengejacke @pdwaggoner @mattansb @IndrajeetPatil @humanfactors
quickly came up with a logo, let me know your thoughts. We could wrap it up into a hexbin to follow the open sources / R packages style.
Doing some data analysis for my job, I realised that one of the last aspect lacking to the easyverse (at least for my use) is a brick that handles means, contrasts (and predictions in general), similar to emmeans, ggeffects and the get_predicted/get_means/get_contrasts methods from psycho, but in a more easy' fashion.
I will think about a possible design
A declarative, efficient, and flexible JavaScript library for building user interfaces.
🖖 Vue.js is a progressive, incrementally-adoptable JavaScript framework for building UI on the web.
TypeScript is a superset of JavaScript that compiles to clean JavaScript output.
An Open Source Machine Learning Framework for Everyone
The Web framework for perfectionists with deadlines.
A PHP framework for web artisans
Bring data to life with SVG, Canvas and HTML. 📊📈🎉
JavaScript (JS) is a lightweight interpreted programming language with first-class functions.
Some thing interesting about web. New door for the world.
A server is a program made to process requests and deliver data to clients.
Machine learning is a way of modeling and interpreting data that allows a piece of software to respond intelligently.
Some thing interesting about visualization, use data art
Some thing interesting about game, make everyone happy.
We are working to build community through open source technology. NB: members must have two-factor auth.
Open source projects and samples from Microsoft.
Google ❤️ Open Source for everyone.
Alibaba Open Source for everyone
Data-Driven Documents codes.
China tencent open source team.