Giter Club home page Giter Club logo

kbn_network's Introduction

Network Plugin for Kibana 5, 6 and 7

This is a plugin developed for Kibana that displays a network node that link two fields that have been previously selected.

Installation Steps from release

Now this plugin is avalible for differents versions of Kibana (6, 5 and 4), in releases you can download the plugin with all its dependencies installed:

  1. Go to releases and download the right one for your Kibana
  2. unzip/untar it into KIBANA_HOME/plugins
  3. Start your Kibana

Installation Steps from GitHub source code

  1. Move into plugins folder: Β cd KIBANA_HOME/plugins

  2. Clone the source code (it depends on your Kibana's version):

    • Kibana 7.5 and upper: git clone https://github.com/dlumbrer/kbn_network.git network_vis -b 7-dev
    • Kibana 7.0 to 7.4: git clone https://github.com/dlumbrer/kbn_network.git network_vis -b 7.4-dev
    • Kibana 6.6 and upper: git clone https://github.com/dlumbrer/kbn_network.git network_vis -b 6-dev
    • Kibana 6.5: git clone https://github.com/dlumbrer/kbn_network.git network_vis -b 6.5-dev
    • Kibana 6.3 or 6.4: git clone https://github.com/dlumbrer/kbn_network.git network_vis -b 6.4-dev
    • Kibana 6.0, 6.1 or 6.2: git clone https://github.com/dlumbrer/kbn_network.git network_vis -b 6.2-dev
    • Kibana 5.5.X or 5.6.X: git clone https://github.com/dlumbrer/kbn_network.git network_vis -b 5.5.x
    • Kibana 5.5.X or lower: git clone https://github.com/dlumbrer/kbn_network.git network_vis -b 5.4.x
    • Kibana 4: git clone https://github.com/dlumbrer/kbn_network.git network_vis -b 4.x
  3. Install dependencies:

    cd network_vis
    rm -rf images/
    npm install
    
  4. Start Kibana

Important: If you have any problem with the plugin version (like a warning message "it expected Kibana version "x.x.x", and found "x.x.x"") only change the value of the "version" tag on the package.json to your Kibana version

Uninstall:

cd KIBANA_HOME
rm -rf plugins/network_vis/

Types of networks

Two types of Nodes:

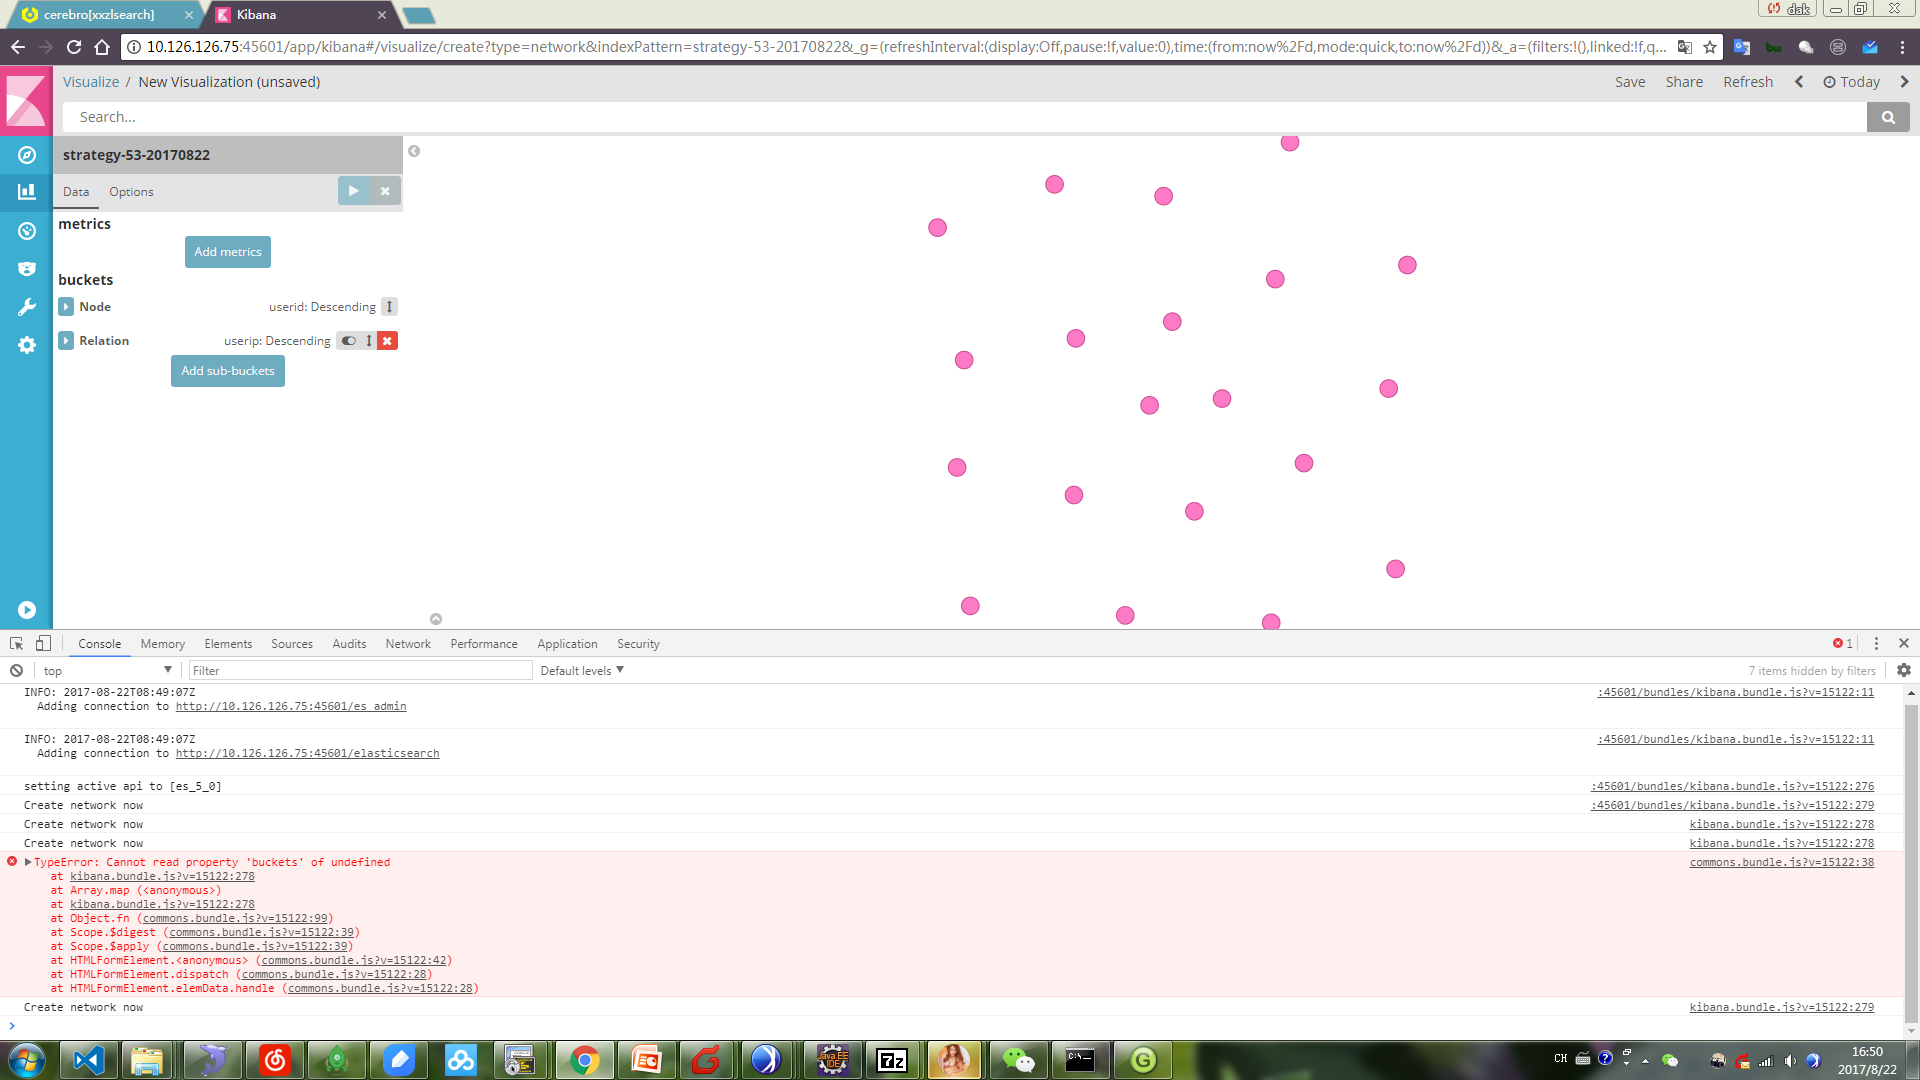
It can select 'Node'-'Node' in buckets to show a network that link two types of nodes. Each type is the result of the field selected.

Screenshot

Nodes linked by a Relationship:

First, select 'Node' on buckets for build the network of one type of nodes, it depends of the field it has been selected. After, select 'Relation' to link the nodes through a relationship that depends of the field it has been selected.

Screenshot

Integration on Dashboard

Completly integration on Dashboards with other visualizations.

Screenshot

User Guide

You can find an user guide in the file USER_GUIDE.md

Help me to improve! πŸ˜„

You can contact or helping me if you have any issue by:

  • Opening an issue in the repository
  • Opening a PR
  • Sending an email to me!

This is an open source project that I maintain in my free time, as a hobby and my love for open source and data visualization. It is free as you know, but you can help me with a cup of coffee:

paypal

kbn_network's People

Contributors

cgiraldo avatar dlumbrer avatar nico-df avatar numbnut avatar

Stargazers

 avatar  avatar  avatar  avatar  avatar  avatar  avatar  avatar  avatar  avatar  avatar  avatar  avatar  avatar  avatar  avatar  avatar  avatar  avatar  avatar  avatar  avatar  avatar  avatar  avatar  avatar  avatar  avatar  avatar  avatar  avatar  avatar  avatar  avatar  avatar  avatar  avatar  avatar  avatar  avatar  avatar  avatar  avatar  avatar  avatar  avatar  avatar  avatar  avatar  avatar  avatar  avatar  avatar  avatar  avatar  avatar  avatar  avatar  avatar  avatar  avatar  avatar  avatar  avatar  avatar  avatar  avatar  avatar  avatar  avatar  avatar  avatar  avatar  avatar  avatar  avatar  avatar  avatar  avatar  avatar  avatar  avatar  avatar  avatar  avatar  avatar  avatar  avatar  avatar  avatar  avatar  avatar  avatar  avatar  avatar  avatar  avatar  avatar  avatar  avatar

Watchers

 avatar  avatar  avatar  avatar  avatar  avatar  avatar  avatar  avatar  avatar  avatar  avatar  avatar  avatar  avatar  avatar  avatar  avatar  avatar  avatar  avatar  avatar  avatar  avatar  avatar  avatar

kbn_network's Issues

Disappear in Dashboard

Hello, I have installed your plugin in my kibana environnment but I have a little issue.

The plugin works well but when I'm adding it in a Dashboard, the graph disappear sometimes and I always have to click on the graph to make it reappear.

Do you know why this is happening ?

Thanks in advance

This plugin changes the native Kibana tooltip/position

Hi,

Unfortunately, my installation of this plugin in the latest version of Kibana (5.6.2 and 5.6.3) changed the style and position of tooltips for the entire visualisations/dashboard.

I reported this issue initially in Kibana repo, but it turns out it is kbn_network:
elastic/kibana#14589

Many thanks for your plugin i really enjoying it, I thought it might be helpful to report this.

Best,
Maziyar

5.5.0 deployment

After checking out the kbn_network plugin, changing package.json to point to Kibana 5.5.0, removing the /images directory and running NPM build, everything seems successful in the build process. When I start Kibana, I get the following error coming back in the browser, but nothing the kibana log files:

 Fatal Error
Uncaught TypeError: __webpack_require__(...).register is not a function (https://<ip>/bundles/kibana.bundle.js?v=15382:282)
Version: 5.5.0
Build: 15382
Error: Uncaught TypeError: __webpack_require__(...).register is not a function (https://<ip>/bundles/kibana.bundle.js?v=15382:282)
    at window.onerror (https://52.222.116.102/bundles/commons.bundle.js?v=15382:90:20832)

Is kbn_network building properly for 5.5.0?

Loading/rendering time

Performances look to be acceptable only when few nodes are loaded.
The user experience is suffering, as it is not clear whether the graph is working or not.

Docker install

Hello,

Have you tried to install this plugin in a Docker environment? I have tried several ways but I cannot seem to make it work.

FROM kibana:5.5
MAINTAINER esteban.sastre <[email protected]>

ENV KIBANA_PLUGINS /usr/share/kibana/plugins
RUN apt-get update && apt-get install -y git npm

WORKDIR $KIBANA_PLUGINS
RUN git clone https://github.com/dlumbrer/kbn_network.git network_vis && cd network_vis && rm -rf images/ && sed -i "s/5\..\.0/5\.5\.0/g" package.json && npm install

Last line just changes the package.json form 5.4.0 to 5.5.0 as you advised, but I cannot seem to find the plugin in visualizations anywhere. I have tried with other plugins and they seem to be properly installed.
Is is possible that you provide a way like: kibana-plugin install <url>?

When it comes to build docker images with plugins it is much easier.

kibana5.5.0 install plugin failed.

Download zip file for 5.5.X.
but installation failed.
below is error message
bin/kibana-plugin install file:///esdemo-media/kibana-5.5.0-linux-x86_64/network_vis.zip
Attempting to transfer from file:///esdemo-media/kibana-5.5.0-linux-x86_64/network_vis.zip
Transferring 6607531 bytes....................
Transfer complete
Retrieving metadata from plugin archive
Plugin installation was unsuccessful due to error "No kibana plugins found in archive"

Also try to use git clone, but kibana start failed.

Zooming?

kbn_network is awesome - thanks so much for all the hard work! Question: is there some way to zoom in/out on a graph, or do you have any plans to add that functionality?

Order nodes by score?

Hi,
Thanks for a great plugin! I'm just trying to learn how to use it still and can't seem to find a way to order my nodes based on the elasticsearch score? For instance if I search for "javascript" in my document collection, I can't seem to find a good way to avoid sorting the results by their titles alphabetically?

screen shot 2017-10-06 at 5 14 35 pm

What to do?

This should be a stupid question, but after installation how can i make a new visualization graph?
It's supposed show a new visualization type on visualizer tab, add new visualizer?

image

I follow all steps and the installation looks fine to me.

image

Sorry but it's my first Kibana plugin. Now I only use ElastiFlow by Rob Cowart
Thanks

Feature request: SVG / PNG output

First of all, may I just say what an amazing plugin it is? Kudos!

I would really like to save my network as an SVG for further processing / including my reports though. Would you consider adding it?

why no detail guide for "relation "

There's no detail information for 'Relation' in the user guide.
the graph for Node & Relation is quite different from that for the two type of nodes.
what 's the meaning ?I can't see the text araround the nodes clearly in the figures.
Would you plz put an example dataset file ,maybe it helps to make sense.

By the way , is there any way using this plugin to show the co-occurrence network of papers or publications or projects?
Thanks.

Why not Graph from X-pack

Hello dlumbrer,

Can you tell me a bit more about what made you decide to write your own plugin, instead of using Graph from X-pack, which has almost the same features I suppose? And I mean, reasons besides the fact X-pack is a paid plugin of course ;)

Error when trying to install release

Hi,

I am having issues installing release 4.x for my Kibana 4.6.4

I am getting the following modules are not found:

  • 'vis' ,
  • 'randomcolor',
  • 'css-element-queries/src/ElementQueries',
  • 'css-element-queries-src/src/ResizeSensor'

in kibana/installedPlugins/kbn_network/public.

network_vis inside docker-kibana

Hi,

I install as guided. My kibana is inside docker
cd KIBANA_HOME/plugins
git clone https://github.com/dlumbrer/kbn_network.git network_vis
cd network_vis
rm -rf images/
npm install

change the version to the Kibana (5.6.1).

However I cannot see the 'network' visualisation menu in Kibana.
log [09:09:33.979] [warning] Plugin "network_vis" was disabled because it expected Kibana version "5.6.1", and found "5.5.2".

I did it in Kibana in a other machine (without docker), no problem.
Is there any special treatment for docker?

Tks

Simple install as plugin

Would it be possible to provide the releases of this awesome tool as a kibana-compatible plugin "out of the box"?

Especially for docker deployments it would be awesome to just use

RUN kibana-plugin install https://github.com/dlumbrer/kbn_network....zip

Not working..how do you start?

I've installed this, but how do I get to it? Create a new visualization? Which kind? I don't see a "Node" anywhere that I've tried. I restarted Kibana after install, but no success.

Http Header Authetication

Does this Plugin work with ReadOnlyREST/SearchGuard/XPack-Security which require username password to access elasticsearch indices..?
If yes, Then How ?

Support other bucketing aggregations

It would be amazing if this plugin supported other bucketing aggregations such as Significant Terms for a filtered expression.
Right now I can only use a Terms aggregation, which is only really useful when I plan to plot all documents (of a certain type) in my collection.

Feature request : Be able to graph relation analysis

Hi @dlumbrer,
First of all thank you for sharing such a great plugin.

It would be really awsome if it was possible to have the possibility to add informations to two "Node" bucket type.
Let me explain it "clearly" we wish to graph flows between hosts regarding the port number.
What we have :
what_we_have

and what we wish to have :
what_we_wish

At the moment we know how to get this informations using "Data Table" but not able to visualize it.
Do you think it could be an eventuality ?

Maybe by allowing something different than "Edge size" ? a Edge Info list ? (e.g : "80, 443, 53")

Regards,

Double-click node or edge to add filter condition to all visualizations on the dashboard

Double-click on a node, this node is added to the filter conditions, show only the nodes and the nodes connected to the edges and nodes; Double-click on one side, the side added to the filter conditions, only show the edge and the two nodes connected to this side.

So that we achieved by double-clicking the node or edge in the network visualisation to add filter conditions to all visualization on the dashboard.

node-node-node option

This is a great plugin, and what would really make it work for my use case would be a node-node-node mode so that we could graph thing like NIDS/HIDS events that consist of 3-tuples like {source IP, event, and destination IP}. I have long used AfterGlow and Graphviz to do that but would love to do it in the context of Kibana. I am looking to be able to make something that looks somewhat like this.

Kevin

a quesiton . is this plugin support offline install?

a quesiton . is this plugin support offline install?
i have a machine can't connect to the internet how can install this plugin as offline?
as elastic x-pack plugin ./kibana-plugin install file:///xxx.zip?
is't support?

Kibana 5.4.0 support

Hi, I changed the package.json to version 5.4.0 but Kibana freezes on start: after npm install I copied everything to the official Docker container and the run it, but logs say Kibana is not starting.

Loading message does not go away

Hi @dlumbrer / @robcowart

I was checkin out the tutorial by Rob from here. I got everything working as portrayed in the tutorial, however, I noticed that there is a message that says "loading network..." in the top right of the canvas that doesn't seem to go away.

I noticed that it's being generated from this file. I'm not sure why it stays that way or when it should ideally go away.

Can you please throw some light as to why it's there and what it's trying to do? Is it actually constantly trying to load something?

Thanks.

Kibana not loading plugin

Running Kibana 5.4.2, followed install instructions:

cd KIBANA_HOME/plugins
git clone https://github.com/dlumbrer/kbn_network.git network_vis
cd network_vis
npm install

When restarting Kibana:

{"type":"log","@timestamp":"2017-06-22T00:12:15Z","tags":["warning"],"pid":9191,"message":"Plugin "network_vis" was disabled because it expected Kibana version "5.4.0", and found "5.4.2"."}

So I changed the version number as documented in the install notes and restart Kibana again. This time there is no error, but it also never generates a log message about initializing the network_vis plugin like it does all the others. I tried another 'npm install' in the network_vis directory (unfamiliar with npm) as a blind attempt and restarted kibana again. Here's the log:

{"type":"log","@timestamp":"2017-06-22T00:26:03Z","tags":["info","optimize"],"pid":10100,"message":"Optimizing and caching bundles for logtrail, kibana, timelion and status_page. This may take a few minutes"}
{"type":"log","@timestamp":"2017-06-22T00:27:37Z","tags":["info","optimize"],"pid":10100,"message":"Optimization of bundles for logtrail, kibana, timelion and status_page complete in 93.44 seconds"}
{"type":"log","@timestamp":"2017-06-22T00:27:37Z","tags":["status","plugin:[email protected]","info"],"pid":10100,"state":"green","message":"Status changed from uninitialized to green - Ready","prevState":"uninitialized","prevMsg":"uninitialized"}
{"type":"log","@timestamp":"2017-06-22T00:27:37Z","tags":["status","plugin:[email protected]","info"],"pid":10100,"state":"yellow","message":"Status changed from uninitialized to yellow - Waiting for Elasticsearch","prevState":"uninitialized","prevMsg":"uninitialized"}
{"type":"log","@timestamp":"2017-06-22T00:27:37Z","tags":["status","plugin:[email protected]","info"],"pid":10100,"state":"green","message":"Status changed from uninitialized to green - Ready","prevState":"uninitialized","prevMsg":"uninitialized"}
{"type":"log","@timestamp":"2017-06-22T00:27:37Z","tags":["status","plugin:[email protected]","info"],"pid":10100,"state":"green","message":"Status changed from yellow to green - Kibana index ready","prevState":"yellow","prevMsg":"Waiting for Elasticsearch"}
{"type":"log","@timestamp":"2017-06-22T00:27:37Z","tags":["status","plugin:[email protected]","info"],"pid":10100,"state":"green","message":"Status changed from uninitialized to green - Ready","prevState":"uninitialized","prevMsg":"uninitialized"}
{"type":"log","@timestamp":"2017-06-22T00:27:37Z","tags":["listening","info"],"pid":10100,"message":"Server running at http://127.0.0.1:5601"}
{"type":"log","@timestamp":"2017-06-22T00:27:37Z","tags":["status","ui settings","info"],"pid":10100,"state":"green","message":"Status changed from uninitialized to green - Ready","prevState":"uninitialized","prevMsg":"uninitialized"}

I'd expect to see something for network_vis in there somewhere.

root@host:/usr/share/kibana/plugins# ls -la network_vis/
total 56
drwxr-xr-x 6 root root 4096 Jun 21 18:25 .
drwxrwxr-x 4 kibana kibana 4096 Jun 21 17:46 ..
drwxr-xr-x 8 root root 4096 Jun 21 17:40 .git
-rw-r--r-- 1 root root 28 Jun 21 17:40 .gitignore
drwxr-xr-x 2 root root 4096 Jun 21 17:40 images
-rw-r--r-- 1 root root 168 Jun 21 18:00 index.js
-rw-r--r-- 1 root root 11357 Jun 21 17:40 LICENSE
drwxr-xr-x 10 root root 4096 Jun 21 18:25 node_modules
-rw-r--r-- 1 root root 353 Jun 21 18:25 package.json
drwxr-xr-x 2 root root 4096 Jun 21 17:40 public
-rw-r--r-- 1 root root 2757 Jun 21 17:40 README.md
-rw-r--r-- 1 root root 3774 Jun 21 17:40 USER_GUIDE.md

root@host:/usr/share/kibana/bin# ./kibana-plugin list
[email protected]
[email protected]

warning] Plugin "network_vis" was disabled because it expected Kibana version "1.0.0", and found "5.0.0-beta1

Hi
We want to install your great plugin β€œnetwork_vis” (Ubuntu box with kibana 5.0beta1)

We go strait with your install instruction:
cd KIBANA_HOME/installedPlugins
git clone https://github.com/dlumbrer/kbn_network.git network_vis
cd network_vis
npm install

The following warning comes up when we start kibana:

log [11:20:24.229] [warning] Plugin "network_vis" was disabled because it expected Kibana version "1.0.0", and found "5.0.0-beta1".
log [11:20:24.636] [info][status][plugin:[email protected]] Status changed from uninitialized to green - Ready
log [11:20:24.671] [info][status][plugin:[email protected]] Status changed from uninitialized to yellow - Waiting for Elasticsearch
log [11:20:24.679] [info][status][plugin:[email protected]] Status changed from uninitialized to yellow - Waiting for Elasticsearch
log [11:20:24.733] [info][status][plugin:[email protected]] Status changed from uninitialized to yellow - Waiting for Elasticsearch
log [11:20:24.738] [info][status][plugin:[email protected]] Status changed from yellow to green - Kibana index ready
log [11:20:24.747] [info][license][xpack] Imported license information from Elasticsearch: mode: trial | status: active | expiry date: 2016-10-25T16:49:01+02:00
log [11:20:24.751] [info][status][plugin:[email protected]] Status changed from yellow to green - Ready
log [11:20:24.752] [info][status][plugin:[email protected]] Status changed from yellow to green - Ready
log [11:20:24.781] [info][status][plugin:[email protected]] Status changed from uninitialized to yellow - Waiting for Monitoring Health Check
log [11:20:24.920] [warning][reporting] Generating a random key for xpack.reporting.encryptionKey. To prevent pending reports from failing on restart, please set xpack.reporting.encryptionKey in kibana.yml
log [11:20:24.925] [info][status][plugin:[email protected]] Status changed from uninitialized to green - Ready
log [11:20:24.952] [info][status][plugin:[email protected]] Status changed from yellow to green - Ready
log [11:20:24.957] [info][status][plugin:[email protected]] Status changed from uninitialized to green - Ready
log [11:20:24.959] [warning][security] Generating a random key for xpack.security.encryptionKey. To prevent sessions from being invalidated on restart, please set xpack.security.encryptionKey in kibana.yml
log [11:20:24.965] [warning][security] Session cookies will be transmitted over insecure connections. This is not recommended.
log [11:20:25.004] [info][status][plugin:[email protected]] Status changed from uninitialized to green - Ready
log [11:20:25.208] [info][status][plugin:[email protected]] Status changed from uninitialized to green - Ready
log [11:20:25.214] [info][listening] Server running at http://10.229.62.29:5601
log [11:20:25.216] [info][status][ui settings] Status changed from uninitialized to green – Ready

The Plugin is not visible in kibana 
Please help us

Error installing plugin for Kibana 5.6.3

Currently we are working with kibana-5.6.3 i downloaded the plugin form the branch for 5.X and the follow all the steps, the service starts ok but when we are goint to add visualization we could not see the network option. It does not appear in the visualization menu.

The folder is install in /usr/share/kibana/plugins

If we see the logs it appear
FATAL Error: Config schema already has key: network_vis
at Config.extendSchema (/usr/share/kibana/src/server/config/config.js:51:13)
at /usr/share/kibana/src/server/plugins/plugin_collection.js:19:12
at next (native)
at step (/usr/share/kibana/src/server/plugins/plugin_collection.js:49:191)
at /usr/share/kibana/src/server/plugins/plugin_collection.js:49:361

Underlying document schema

I couldn't understand the underlying document schema for both node-node and node-relation. Are there any examples for these?

Loading message always is diplayed on 5.6.1

HI @dlumbrer ,
the plugin works fine in 5.6.1 kibana version, except for the up-right message that says:
Loading network ...
This message is diplayed also after the network was loaded.
Abny idea to fix it?
Many thanks
Filippo
immagine

Better performance

Hi,

big thanks for this really awesome plugin!

Do you see any chance to speed up the render process with many nodes on the sheet? Like Top 50 Nodes which individually can also have 50 nodes.. This lags heavy in the browser - mostly because its jailed to one cpu core i think.

Maybe you already have some hints or practices to speed things up for big visualisations?

Edit: Some more info regarding to my performance issues. I use Kibana mostly in google chrome and if I render multiple visualizations - one after another (for testing purposes for example) - and switch then to a minimal dashboard with no visualization on it, the cpu load is not decreasing. Only after closing and opening a new tab, the cpu load is normal and the visualizations are fast again. (Sry for the weird description)

Incorrect labels for second-level nodes if "Edge Size" metric is selected

Hi.
I've noticed an issue with node labels after updating this plugin from the 6-dev branch. I'm currently running Kibana 6.1.0.

Steps to reproduce:

  1. Create a "node-node" visualization. The network is displayed without any issues.
  2. Now select the "Edge Size" metric and refresh the visualization. Second-level nodes now have numbers on their labels instead of the actual values. I assume those are doc counts from the terms aggregation.
  3. Remove the "Edge Size" metric and select the "Node Size" one. Second-level nodes now have correct labels and the first-level nodes are scaled accordingly.

I think that keys and values from the terms aggregation are getting mixed up somewhere when the "Edge Size" metric is selected.

Feature request: Node scaling

Since you seem to care about my feature requests, I shall add more here. I have a few related ones so I guess I will add them all here:

  1. Second node scaling. I have noticed that the second node never scales. If I selected dot for the first node as well as the second node, only the first node gets scaled. Not sure if this is a bug or is something that you need to add.
  2. Denote scaleable shapes. Some node type: e.g. box + text only does not scale at all. If possible I would like a checkbox to mark if to scale these.
  3. Textbox as option for all nodes. To increase readibility (especially when nodes are very close to each other), I have chosen to use textbox to show my secondary nodes, but what I would really like is allow the text to be set against a white background so I can set the secondary node as a shape (which scales) and then allow the text to still be clearly shown.
  4. Text color. Because the node colors can sometimes be dark (hopefully once the color options are created and I can set that range with HLS), I would like the option to set the text color β€”Β or allow the script to intelligently determine if the text needs to be dark and light depending on the node color. I believe that you can determine this by using Lab color modeβ€”or just convert color to gray scale and determine where the threshold is.

Hope you will consider these! I will try to learn how to write plugins for Kibana so I can write something useful also. Thanks again for the great plugin!

loading kbn_network in kibana 4.5

I'm trying to load the plugin into kibana 4.5, the install goes smoothly, I see the plugin in the kibana/installedPlugins/network_vis directory, but after reloading the kibana service I don't see the plugin listed in the visualizations list

which kibana 5 version

Hi i'm not an npm expert i tried to do what you wrote and got this
on which version did the software expect to be instaled?

npm ERR! install Couldn't read dependencies
npm ERR! Windows_NT 6.1.7601
npm ERR! argv "C:\Program Files\nodejs\node.exe" "C:\Program Files\nodejs\node_modules\npm\bin\npm-cli.js" "install"
npm ERR! node v4.4.5
npm ERR! npm v2.15.5

npm ERR! Invalid version: "kibana"
npm ERR!
npm ERR! If you need help, you may report this error at:
npm ERR! https://github.com/npm/npm/issues

npm ERR! Please include the following file with any support request:
npm ERR! C:\elastic\kibana-5.0.0-beta1-windows-x86\plugins\network_vis\npm-debug.log

Recommend Projects

  • React photo React

    A declarative, efficient, and flexible JavaScript library for building user interfaces.

  • Vue.js photo Vue.js

    πŸ–– Vue.js is a progressive, incrementally-adoptable JavaScript framework for building UI on the web.

  • Typescript photo Typescript

    TypeScript is a superset of JavaScript that compiles to clean JavaScript output.

  • TensorFlow photo TensorFlow

    An Open Source Machine Learning Framework for Everyone

  • Django photo Django

    The Web framework for perfectionists with deadlines.

  • D3 photo D3

    Bring data to life with SVG, Canvas and HTML. πŸ“ŠπŸ“ˆπŸŽ‰

Recommend Topics

  • javascript

    JavaScript (JS) is a lightweight interpreted programming language with first-class functions.

  • web

    Some thing interesting about web. New door for the world.

  • server

    A server is a program made to process requests and deliver data to clients.

  • Machine learning

    Machine learning is a way of modeling and interpreting data that allows a piece of software to respond intelligently.

  • Game

    Some thing interesting about game, make everyone happy.

Recommend Org

  • Facebook photo Facebook

    We are working to build community through open source technology. NB: members must have two-factor auth.

  • Microsoft photo Microsoft

    Open source projects and samples from Microsoft.

  • Google photo Google

    Google ❀️ Open Source for everyone.

  • D3 photo D3

    Data-Driven Documents codes.