Giter Club home page Giter Club logo

lppls's Introduction

PyPI ๐Ÿ“ฆ   PyTests Downloads

Log Periodic Power Law Singularity (LPPLS) Model

lppls is a Python module for fitting the LPPLS model to data.

Overview

The LPPLS model provides a flexible framework to detect bubbles and predict regime changes of a financial asset. A bubble is defined as a faster-than-exponential increase in asset price, that reflects positive feedback loop of higher return anticipations competing with negative feedback spirals of crash expectations. It models a bubble price as a power law with a finite-time singularity decorated by oscillations with a frequency increasing with time.

๐Ÿ†• The LPPLS Confidence Indicator (LPPLS CI), an indicator derived from the LPPLS model, is applied to both G7 and BRICS nations and has been made available as a digital resource. To experience and interact with the data visualization, one can access the platform hosted by Boulder Investment Technologies at โœจsignals.boulderinvestment.techโœจ.

Here is the model:

$$E[ln\ p(t)] = A + B(t_c-t)^{m}+C(t_c-t)^{m}\cos(\omega\ ln(t_c-t) - \phi)$$

where:

  • $E[ln\ p(t)]$: expected log price at the date of the termination of the bubble
  • $t_c$: critical time (date of termination of the bubble and transition in a new regime)
  • $A$: expected log price at the peak when the end of the bubble is reached at $t_c$
  • $B$: amplitude of the power law acceleration
  • $C$: amplitude of the log-periodic oscillations
  • $m$: degree of the super exponential growth
  • $\omega$: scaling ratio of the temporal hierarchy of oscillations
  • $\phi$: time scale of the oscillations

The model has three components representing a bubble. The first, $A+B(t_c-t)^{m}$, handles the hyperbolic power law. For $m$ < 1 when the price growth becomes unsustainable, and at $t_c$ the growth rate becomes infinite. The second term, $C(t_c-t)^{m}$, controls the amplitude of the oscillations. It drops to zero at the critical time $t_c$. The third term, $\cos(\omega\ ln(t_c-t) - \phi)$, models the frequency of the oscillations. They become infinite at $t_c$.

Important links

Installation

Dependencies

lppls requires:

  • Python (>= 3.7)
  • Matplotlib (>= 3.1.1)
  • Numba (>= 0.51.2)
  • NumPy (>= 1.17.0)
  • Pandas (>= 0.25.0)
  • SciPy (>= 1.3.0)
  • Pytest (>= 6.2.1)

User installation

pip install -U lppls

Example Use

from lppls import lppls, data_loader
import numpy as np
import pandas as pd
from datetime import datetime as dt
%matplotlib inline

# read example dataset into df 
data = data_loader.nasdaq_dotcom()

# convert time to ordinal
time = [pd.Timestamp.toordinal(dt.strptime(t1, '%Y-%m-%d')) for t1 in data['Date']]

# create list of observation data
price = np.log(data['Adj Close'].values)

# create observations array (expected format for LPPLS observations)
observations = np.array([time, price])

# set the max number for searches to perform before giving-up
# the literature suggests 25
MAX_SEARCHES = 25

# instantiate a new LPPLS model with the Nasdaq Dot-com bubble dataset
lppls_model = lppls.LPPLS(observations=observations)

# fit the model to the data and get back the params
tc, m, w, a, b, c, c1, c2, O, D = lppls_model.fit(MAX_SEARCHES)

# visualize the fit
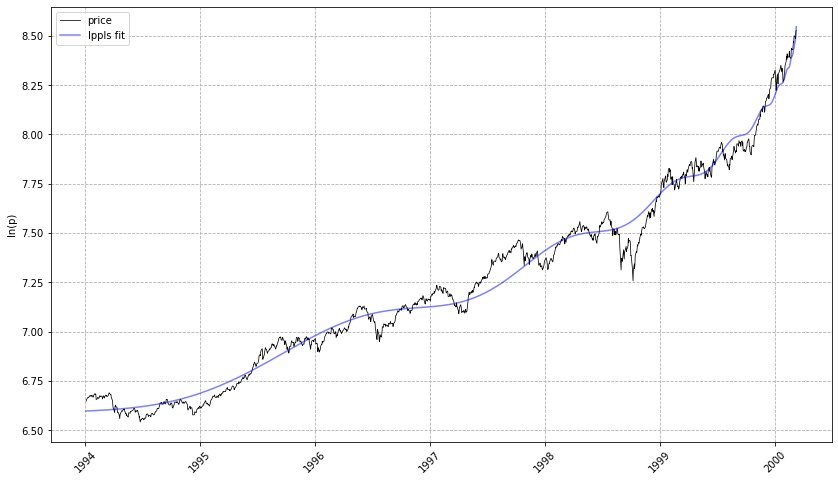
lppls_model.plot_fit()

# should give a plot like the following...

LPPLS Fit to the Nasdaq Dataset

# compute the confidence indicator
res = lppls_model.mp_compute_nested_fits(
    workers=8,
    window_size=120, 
    smallest_window_size=30, 
    outer_increment=1, 
    inner_increment=5, 
    max_searches=25,
    # filter_conditions_config={} # not implemented in 0.6.x
)

lppls_model.plot_confidence_indicators(res)
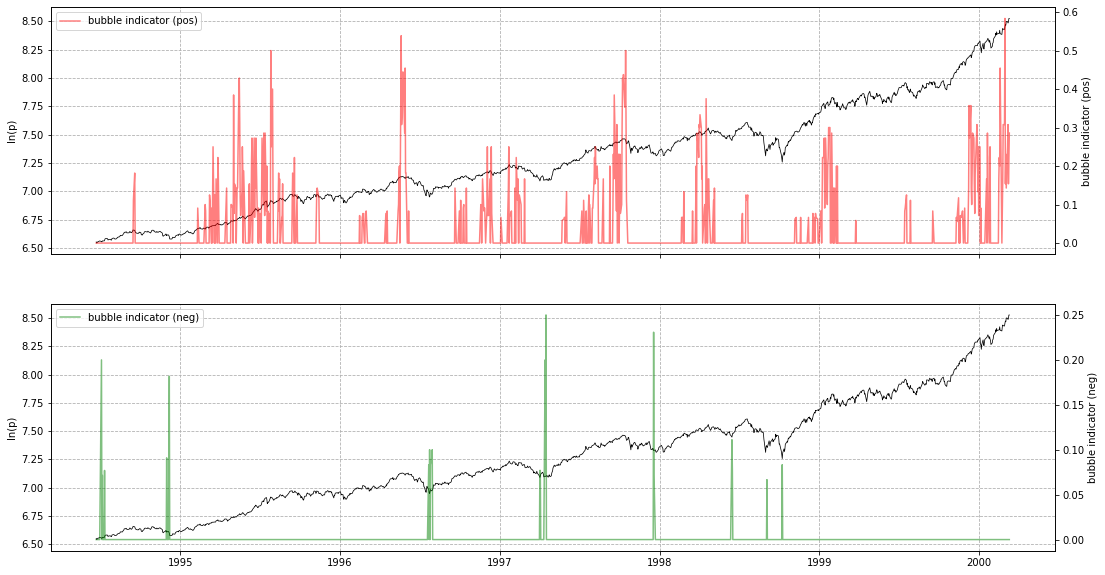
# should give a plot like the following...

LPPLS Confidnce Indicator

If you wish to store res as a pd.DataFrame, use compute_indicators.

Example
res_df = lppls_model.compute_indicators(res)
res_df
# gives the following...

Quantile Regression

Based on the work in Zhang, Zhang & Sornette 2016, quantile regression for LPPLS uses the L1 norm (sum of absolute differences) instead of the L2 norm and applies the q-dependent loss function during calibration. Please refer to the example usage here.

Other Search Algorithms

Shu and Zhu (2019) proposed CMA-ES for identifying the best estimation of the three non-linear parameters ($t_c$, $m$, $\omega$).

The CMA-ES rates among the most successful evolutionary algorithms for real-valued single-objective optimization and is typically applied to difficult nonlinear non-convex black-box optimization problems in continuous domain and search space dimensions between three and a hundred. Parallel computing is adopted to expedite the fitting process drastically.

This approach has been implemented in a subclass and can be used as follows... Thanks to @paulogonc for the code.

from lppls import lppls_cmaes
lppls_model = lppls_cmaes.LPPLSCMAES(observations=observations)
tc, m, w, a, b, c, c1, c2, O, D = lppls_model.fit(max_iteration=2500, pop_size=4)

Performance Note: this works well for single fits but can take a long time for computing the confidence indicators. More work needs to be done to speed it up.

References

  • Filimonov, V. and Sornette, D. A Stable and Robust Calibration Scheme of the Log-Periodic Power Law Model. Physica A: Statistical Mechanics and its Applications. 2013
  • Shu, M. and Zhu, W. Real-time Prediction of Bitcoin Bubble Crashes. 2019.
  • Sornette, D. Why Stock Markets Crash: Critical Events in Complex Financial Systems. Princeton University Press. 2002.
  • Sornette, D. and Demos, G. and Zhang, Q. and Cauwels, P. and Filimonov, V. and Zhang, Q., Real-Time Prediction and Post-Mortem Analysis of the Shanghai 2015 Stock Market Bubble and Crash (August 6, 2015). Swiss Finance Institute Research Paper No. 15-31.
  • Zhang, Q., Zhang, Q., and Sornette, D. Early Warning Signals of Financial Crises with Multi-Scale Quantile Regressions of Log-Periodic Power Law Singularities. PLOS ONE. 2016. DOI:10.1371/journal.pone.0165819

lppls's People

Contributors

changlan avatar joshwani avatar joshwani-broadcom avatar knskito avatar matthewburke1995 avatar nightvision04 avatar stephenypan avatar tucaman avatar xgdgsc avatar xuy avatar

Stargazers

 avatar  avatar  avatar  avatar  avatar  avatar  avatar  avatar  avatar  avatar  avatar  avatar  avatar  avatar  avatar  avatar  avatar  avatar  avatar  avatar  avatar  avatar  avatar  avatar  avatar  avatar  avatar  avatar  avatar  avatar  avatar  avatar  avatar  avatar  avatar  avatar  avatar  avatar  avatar  avatar  avatar  avatar  avatar  avatar  avatar  avatar  avatar  avatar  avatar  avatar  avatar  avatar  avatar  avatar  avatar  avatar  avatar  avatar  avatar  avatar  avatar  avatar  avatar  avatar  avatar  avatar  avatar  avatar  avatar  avatar  avatar  avatar  avatar  avatar  avatar  avatar  avatar  avatar  avatar  avatar  avatar  avatar  avatar  avatar  avatar  avatar  avatar  avatar  avatar  avatar  avatar  avatar  avatar  avatar  avatar  avatar  avatar  avatar  avatar  avatar

Watchers

 avatar  avatar  avatar  avatar  avatar  avatar  avatar  avatar  avatar  avatar  avatar  avatar  avatar  avatar  avatar  avatar  avatar  avatar  avatar  avatar  avatar  avatar  avatar  avatar  avatar

lppls's Issues

Filtering Condition

I'm trying to apply the same conditions of this article:

Demirer, Riza & Demos, Guilherme & Gupta, Rangan & Sornette, Didier. (2017). On the Predictability of Stock Market Bubbles: Evidence from LPPLS Confidence TM Multi-scale Indicators. SSRN Electronic Journal. 10.2139/ssrn.3076609.

image

filter_conditions_config = [
  {'condition_1':[
      (-0.05, 0.1), # tc_range
      (0.01,1.2), # m_range
      (6,13), # w_range
      2.5, # O_min
      0.8, # D_min
  ]},
  {'condition_2':[
      (-0.05, 0.1), # tc_range
      (0.01,0.99), # m_range
      (6,13), # w_range
      2.5, # O_min
      1.0, # D_min
  ]}
]

Am I setting the conditions correctly?

I would appreciate any help. Thank you!

I have a question, May I use another data?

May I use another data instead of the data in nasdaq_dotcom.csv?

Traceback (most recent call last):
File "C:\Users\bao25\Desktop\lppls-master\use.py", line 14, in
time = [pd.Timestamp.toordinal(dt.strptime(t1, '%Y-%m-%d')) for t1 in data['Date']]
File "C:\Users\bao25\Desktop\lppls-master\use.py", line 14, in
time = [pd.Timestamp.toordinal(dt.strptime(t1, '%Y-%m-%d')) for t1 in data['Date']]
File "C:\Users\bao25\anaconda3\lib_strptime.py", line 568, in _strptime_datetime
tt, fraction, gmtoff_fraction = _strptime(data_string, format)
File "C:\Users\bao25\anaconda3\lib_strptime.py", line 349, in _strptime
raise ValueError("time data %r does not match format %r" %
ValueError: time data '1994/1/3' does not match format '%Y-%m-%d'

ERROR in lppls.mp_compute_nested_fits

Here is my example code:

data = data_loader.nasdaq_dotcom()

time = [pd.Timestamp.toordinal(dt.strptime(t1, '%Y-%m-%d')) for t1 in data['Date']]

price = np.log(data['Adj Close'].values)

observations = np.array([time, price])

MAX_SEARCHES = 25

lppls_model = lppls.LPPLS(observations=observations)

tc, m, w, a, b, c, c1, c2, O, D = lppls_model.fit(MAX_SEARCHES)

res = lppls_model.mp_compute_nested_fits(
workers=8,
window_size=120,
smallest_window_size=30,
outer_increment=1,
inner_increment=5,
max_searches=25,
filter_conditions_config={} # not implemented in 0.6.x
)

Here is the error, this is the error that continues in a loop:

Traceback (most recent call last):
File "", line 1, in
File "C:\Users\kylee\AppData\Local\Programs\Python\Python39\lib\multiprocessing\spawn.py", line 116, in spawn_main
exitcode = _main(fd, parent_sentinel)
File "C:\Users\kylee\AppData\Local\Programs\Python\Python39\lib\multiprocessing\spawn.py", line 125, in _main
prepare(preparation_data)
File "C:\Users\kylee\AppData\Local\Programs\Python\Python39\lib\multiprocessing\spawn.py", line 236, in prepare
_fixup_main_from_path(data['init_main_from_path'])
File "C:\Users\kylee\AppData\Local\Programs\Python\Python39\lib\multiprocessing\spawn.py", line 287, in _fixup_main_from_path
main_content = runpy.run_path(main_path,
File "C:\Users\kylee\AppData\Local\Programs\Python\Python39\lib\runpy.py", line 268, in run_path
return _run_module_code(code, init_globals, run_name,
File "C:\Users\kylee\AppData\Local\Programs\Python\Python39\lib\runpy.py", line 97, in _run_module_code
_run_code(code, mod_globals, init_globals,
File "C:\Users\kylee\AppData\Local\Programs\Python\Python39\lib\runpy.py", line 87, in _run_code
exec(code, run_globals)
File "C:\Users\kylee\Documents\Stock Science\Portfolio Analysis\main.py", line 392, in
res = lppls_model.mp_compute_nested_fits(
File "C:\Users\kylee\Documents\Stock Science\Portfolio Analysis\venv\lib\site-packages\lppls\lppls.py", line 426, in mp_compute_nested_fits
with Pool(processes=workers) as pool:
File "C:\Users\kylee\AppData\Local\Programs\Python\Python39\lib\multiprocessing\context.py", line 119, in Pool
return Pool(processes, initializer, initargs, maxtasksperchild,
File "C:\Users\kylee\AppData\Local\Programs\Python\Python39\lib\multiprocessing\pool.py", line 212, in init
self._repopulate_pool()
File "C:\Users\kylee\AppData\Local\Programs\Python\Python39\lib\multiprocessing\pool.py", line 303, in _repopulate_pool
return self._repopulate_pool_static(self._ctx, self.Process,
File "C:\Users\kylee\AppData\Local\Programs\Python\Python39\lib\multiprocessing\pool.py", line 326, in _repopulate_pool_static
w.start()
File "C:\Users\kylee\AppData\Local\Programs\Python\Python39\lib\multiprocessing\process.py", line 121, in start
self._popen = self._Popen(self)
File "C:\Users\kylee\AppData\Local\Programs\Python\Python39\lib\multiprocessing\context.py", line 327, in _Popen
return Popen(process_obj)
File "C:\Users\kylee\AppData\Local\Programs\Python\Python39\lib\multiprocessing\popen_spawn_win32.py", line 45, in init
prep_data = spawn.get_preparation_data(process_obj._name)
File "C:\Users\kylee\AppData\Local\Programs\Python\Python39\lib\multiprocessing\spawn.py", line 154, in get_preparation_data
_check_not_importing_main()
File "C:\Users\kylee\AppData\Local\Programs\Python\Python39\lib\multiprocessing\spawn.py", line 134, in _check_not_importing_main
raise RuntimeError('''
RuntimeError:
An attempt has been made to start a new process before the
current process has finished its bootstrapping phase.

    This probably means that you are not using fork to start your
    child processes and you have forgotten to use the proper idiom
    in the main module:

        if __name__ == '__main__':
            freeze_support()
            ...

    The "freeze_support()" line can be omitted if the program
    is not going to be frozen to produce an executable.

Have you ever come across this?

Thanks for any feedback

Optimizing and high freq.

Hello, I just discovered this wonderful thing. But I am wondering how to optimize so many parameters in short time intervals. Could you help me about this ?

Compute Indicator error - name 'self' is not defined

Hi I tried to run this:

define custom filter condition
filter_conditions_config = [
{'condition_1':[
(0.0, 0.1), # tc_range
(0,1), # m_range
(4,25), # w_range
2.5, # O_min
0.5, # D_min
]},
]

compute the confidence indicator
res = lppls_model.mp_compute_indicator(
workers=32,
window_size=120,
smallest_window_size=30,
increment=5,
max_searches=25,
filter_conditions_config=filter_conditions_config
)
res_df = self.res_to_df(res, 'condition_1')
lppls_model.plot_confidence_indicators(res_df, title='Short Term Indicator 30-120')

And got this error:
NameError Traceback (most recent call last)
in ()
19 filter_conditions_config=filter_conditions_config
20 )
---> 21 res_df = self.res_to_df(res, 'condition_1')
22 lppls_model.plot_confidence_indicators(self, res_df, title='Short Term Indicator 30-120')
23

NameError: name 'self' is not defined

Minor issue running the example ...

Hi -

Thanks for posting !

Running your example I ran into trouble when you call the function

res_df = res_to_df(res, 'condition_1')

... as the function res_to_df is not recognized, rather res_df = lppls_model.res_to_df(res, 'condition_1') seems to work fine.

Thanks, Jesper.

Filtering conditions for bubble indicators.

Playing with the S&P 500 time series for the past recent month, trying to compute the bubble confidence indicator. I noted that neither a bubble early warning nor a bubble end flag would be raised, when running _func_compute_indicator with window_size=125 and smallest_window_size=20.

The filtering conditions in _func_compute_indicator appear too strict. In particular the condition

n_oscillation = ((w / 2) * np.log(abs((tc - first) / (last - first)))) > 2.5

almost never evaluates to true.

I wonder whether you did a similar analysis and noticed the same?

I am aware that these are the conditions cited in all reference papers. from Sornette et. al.; However, I found much more reasonable results when using the filtering conditions for the confidence indicator as implemented in the R bubble package by Dean Fantazzini (https://github.com/deanfantazzini/bubble/blob/master/R/LPPL_confidence.R), which is:

n_oscillation = w /( 2 * math.pi) * np.log(abs(tc / (tc - last))) > 2.5

Using this much less strict condition, I end up with the indicator values plotted in the attached file:

SP500_Confidence_Indicator_20200215_20200605

Using different minimizer

I tried to use scipy.optimize.differential_evolution for optimization.
init_limits = [
(tc_init_min, tc_init_max),
(0.1, 0.9),
(6, 13),
]
cofs = differential_evolution(
func=self.func_restricted, bounds=init_limits, args=observations

            )

But its throwing some error. Can anyone point out the issue
Screenshot from 2020-05-28 14-40-02

Computation Bound not explicit in existing documentation

The double moving windows implementation is unfit to most production implementation due to the fact that the latest data point is unexplored by the window most of the time (at the time of indicator computation).

func_arg_map = [( obs_copy[:, i:window_size + i], window_size, i, smallest_window_size, outer_increment, inner_increment, max_searches, ) for i in range(0, obs_opy_len+1, outer_increment)]
I suggest adding the option to start the iteration at (obs_opy_len % outer_increment) to make it usable in monitoring or backtest applications without branching the project.

ValueError of LPPL_CMAES in NASDAQ Example

from lppls import lppls, data_loader
import numpy as np
import pandas as pd
from datetime import datetime as dt
%matplotlib inline

data = data_loader.nasdaq_dotcom()
time = [pd.Timestamp.toordinal(dt.strptime(t1, '%Y-%m-%d')) for t1 in data['Date']]

price = np.log(data['Adj Close'].values)

observations = np.array([time, price])

from lppls import lppls_cmaes
lppls_model = lppls_cmaes.LPPLSCMAES(observations=observations)
tc, m, w, a, b, c, c1, c2, O, D = lppls_model.fit(max_iteration=2500, pop_size=4)

res = lppls_model.mp_compute_nested_fits(
    workers=8,
    window_size=120, 
    smallest_window_size=30, 
    outer_increment=1, 
    inner_increment=5, 
    max_searches=25,

)   
lppls_model.plot_confidence_indicators(res)


(80_w,160)-aCMA-ES (mu_w=42.4,w_1=5%) in dimension 3 (seed=470772, Wed Jan  5 15:43:08 2022)
Iterat #Fevals   function value  axis ratio  sigma  min&max std  t[m:s]
1    160 9.527592475130895e-01 1.0e+00 1.02e+00  7e-02  4e+04 0:00.1
2    320 9.456107662596909e-01 2.0e+00 1.09e+00  8e-02  3e+04 0:00.1
3    480 9.137850385070987e-01 2.9e+00 1.09e+00  8e-02  2e+04 0:00.2
Array must not contain infs or NaNs.
/opt/anaconda3/lib/python3.9/site-packages/scipy/stats/stats.py:6685: RuntimeWarning: divide by zero encountered in 
double_scalars
relative_diff = (np.abs(f_obs_sum - f_exp_sum) /

ValueError Traceback (most recent call last)
/var/folders/s2/86r_kl2925q1brkhmg1nmfr40000gn/T/ipykernel_25457/2648792023.py in
19 lppls_model = lppls_cmaes.LPPLSCMAES(observations=observations)
20
---> 21 tc, m, w, a, b, c, c1, c2, O, D = lppls_model.fit(max_iteration=2500, pop_size=4)
22
23 # visualize the fit

/opt/anaconda3/lib/python3.9/site-packages/lppls/lppls_cmaes.py in fit(self, max_iteration, factor_sigma, pop_size, obs)
80 while not es.stop() and es.countiter <= max_iteration:
81 solutions = es.ask()
---> 82 solution = [self.fun_restricted(s, obs) for s in solutions]
83 es.tell(solutions, solution)
84 es.logger.add() # write data to disc to be plotted

/opt/anaconda3/lib/python3.9/site-packages/lppls/lppls_cmaes.py in (.0)
80 while not es.stop() and es.countiter <= max_iteration:
81 solutions = es.ask()
---> 82 solution = [self.fun_restricted(s, obs) for s in solutions]
83 es.tell(solutions, solution)
84 es.logger.add() # write data to disc to be plotted

/opt/anaconda3/lib/python3.9/site-packages/lppls/lppls_cmaes.py in fun_restricted(self, x, obs)
41
42 # calculate the chi square
---> 43 error, _ = chisquare(f_obs=res, f_exp=obs[1, :])
44 return error
45

/opt/anaconda3/lib/python3.9/site-packages/scipy/stats/stats.py in chisquare(f_obs, f_exp, ddof, axis)
6850
6851 """
-> 6852 return power_divergence(f_obs, f_exp=f_exp, ddof=ddof, axis=axis,
6853 lambda_="pearson")
6854

/opt/anaconda3/lib/python3.9/site-packages/scipy/stats/stats.py in power_divergence(f_obs, f_exp, ddof, axis, lambda_)
6692 f"of {rtol}, but the percent differences are:\n"
6693 f"{relative_diff}")
-> 6694 raise ValueError(msg)
6695
6696 else:

ValueError: For each axis slice, the sum of the observed frequencies must agree with the sum of the expected frequencies to a relative tolerance of 1e-08, but the percent differences are:
inf

add future days forecast for the fitted lines

I tried to extend the fitted line into future days.
It would be useful to update the lppls_model.plot_fit() function.

#  extend
new_dates = pd.date_range(start=data.index[-1] + pd.Timedelta(days=1), periods=500)
t = [pd.Timestamp.toordinal(timestamp) for timestamp in new_dates]
y = a + np.power(tc - t, m) * (b + ((c1 * np.cos(w * np.log(tc - t))) + (c2 * np.sin(w * np.log(tc - t)))))

plt.plot(new_dates, y)
plt.show()

image

Incorrectly calculating C

From collaborator: H.C. Shih:

I think this may be a little error in your damping rate code

(mabs(b))/(wabs(c1+c2))

you assume c1+c2=c here

but
c1=ccos and c2=csin
sin^2 + cos^2 = 1

Thus
(csin)^2 + (ccos)^2 = c^2 = c1^2 + c2^2
c = (c1^2 + c2^2)^(1/2)

Can this module be used to minute data as well as daily data?

Hi
As I mentioned in the title, I'd like to put some price minute data. But it seems not to work when I just put them in the module.
If I can use this module to analyze minute data, could you tell me how to do it.
Thank you for your effort and post. It's so cool module and always helpful.

Allow customisation of search space and filtering conditions

At the moment fit does not incorporate filtering logic, which may lead to bogus results that depending on the conditions may also vary significantly based on the chosen random.seed, whilst mp_compute_nested_fits has a hardcoded filtering logic for m, w, damping and oscillations but not for error.

It would be great to be able to define search space and filtering conditions both on the fit and mp_compute_nested_fits methods in such a way that it is possible to encode the full set described in Sornette et al. 2015 via a configuration option.

Screenshot 2023-04-30 at 13 33 50

Branchless Programming

I think I could squeeze some speed in by applying branchless programming. Particularly in the indicator function. Is our primary objective speed? It would come at the cost of some readability.

was using lppl to rolling predict the critical time but got lots of 'SVD did not converge' errors

tested=pd.DataFrame()
count=0
for i in data[data.trade_date>'20070801'].trade_date.values:
test_data=data[data.trade_date<=i]
time = np.linspace(0, len(test_data)-1, len(test_data))
# create list of observation data, in this case,
# daily adjusted close prices of the S&P 500
price = [p for p in test_data['close']]
# create Mx2 matrix (expected format for LPPLS observations)
observations = np.array([time, price])

# the literature suggests 25
MAX_SEARCHES = 10000

# instantiate a new LPPLS model with the S&P 500 dataset
lppls_model = lppls.LPPLS(use_ln=True, observations=observations)

# fit the model to the data and get back the params
tc, m, w, a, b, c = lppls_model.fit(observations, MAX_SEARCHES, minimizer='Nelder-Mead')

# visualize the fit
#lppls_model.plot_fit(observations, tc, m, w)
count+=1
print('calculating {}th data in {}datas'.format(count,len(data[data.trade_date>'20070801'].trade_date.values)))
tested=tested.append(pd.DataFrame({'date':i,'critical_time':tc,'critical_time2':tc-len(time),'m':m,'w':w,'a':a,'b':b,'c':c},index=[i]))

image

Support for Windows

Currently we only platform test for ubuntu-latest. Could we expand the yml to include windows-latest?

Data_loader is undefined

Hey there, I'm trying to run this code but with a btc data set, however, just running it out of the box I am faced with the error that data loader variable is not defined.

Divide by zero encountered in double_scalars

The following error is encountered from time to time, but does not seem to affect the computation of indicators

lib/python3.10/site-packages/lppls/lppls.py:640: RuntimeWarning: divide by zero encountered in double_scalars
return (m * np.abs(b)) / (w * np.abs(c))

Name Error

19 filter_conditions_config=filter_conditions_config
20 )
---> 21 res_df = res_to_df(res, 'condition_1')
22 lppls_model.plot_confidence_indicators(res_df, title='Short Term Indicator 120-30')
23

NameError: name 'res_to_df' is not defined

Help with tests

I find this interesting.

Despite the procedure being non-deterministic, it would be great to see some unittests added. Is this something you would like help in?

LPPL on CUDA graphic cards

Hi Josh,

I was reading articles on your site where you said that you run LPPL backtest for x20 hours on x96 vCPUs.

I have an NVIDIA CUDA card and was wondering whether your LPPL Python code would be helped by CUDA cards? A NVIDIA CUDA card can easily have x1,000 or more processors, but these processors are limited in what they can do.

Looking forward to hearing your thoughts.

regards
dejan

add reversed LPPL model

The normal LPPL model fits and predicts future market trends by capturing the cyclicity and acceleration in price trends.
A reversed LPPL model may be also useful in describing the cyclicity and deceleration in price trends.
it could be achieved by changing m to -m and allowing a negative value of -m๏ผŒ and change (tc-t) to (t - tc).

y_2 = a + np.power(t - tc, -m) * (b + ((c1 * np.cos(w * np.log(t - tc))) + (c2 * np.sin(w * np.log(t - tc)))))

minimize failed

lppls.py:57: RuntimeWarning: invalid value encountered in log
phase = np.log(deltaT) if self.use_ln else deltaT
lppls.py:58: RuntimeWarning: invalid value encountered in power
fi = np.power(deltaT, m)

minimize failed: SVD did not converge in Linear Least Squares

error message when running the code.

Dear developer

When I try to run your code, it shows the below error message:

TypeError Traceback (most recent call last)
in ()
30 # fit the model to the data and get back the params
31
---> 32 tc, m, w, a, b, c, c1, c2, O, D = lppls_model.fit(MAX_SEARCHES)
33
34 # visualize the fit

TypeError: fit() missing 1 required positional argument: 'max_searches'

Can you help to solve it? Tks!

with regards,
Peter

TypeError: float() argument must be a string or a number, not 'Timestamp'

hi,
I am follwing exactly the same scripts in Example Use:

`from lppls import lppls, data_loader
import numpy as np
import pandas as pd
from datetime import datetime as dt
%matplotlib inline

data = data_loader.nasdaq_dotcom()
time = [pd.Timestamp.toordinal(dt.strptime(t1, '%Y-%m-%d')) for t1 in data['Date']]
price = np.log(data['Adj Close'].values)
observations = np.array([time, price])
MAX_SEARCHES = 25
lppls_model = lppls.LPPLS(observations=observations)
tc, m, w, a, b, c, c1, c2, O, D = lppls_model.fit(MAX_SEARCHES)
lppls_model.plot_fit()
`
instead of the chart shown, I got an error message:
TypeError Traceback (most recent call last)
in
22
23 # visualize the fit
---> 24 lppls_model.plot_fit()
25
26 # should give a plot like the following...

~\Anaconda3\lib\site-packages\lppls\lppls.py in plot_fit(self, show_tc)
219 # fontsize=16)
220
--> 221 ax1.plot(time_ord, price, label='price', color='black', linewidth=0.75)
222 ax1.plot(time_ord, lppls_fit, label='lppls fit', color='blue', alpha=0.5)
223 # if show_tc:

~\Anaconda3\lib\site-packages\matplotlib\axes_axes.py in plot(self, scalex, scaley, data, *args, **kwargs)
1665 lines = [*self._get_lines(*args, data=data, **kwargs)]
1666 for line in lines:
-> 1667 self.add_line(line)
1668 self.autoscale_view(scalex=scalex, scaley=scaley)
1669 return lines

~\Anaconda3\lib\site-packages\matplotlib\axes_base.py in add_line(self, line)
1900 line.set_clip_path(self.patch)
1901
-> 1902 self._update_line_limits(line)
1903 if not line.get_label():
1904 line.set_label('_line%d' % len(self.lines))

~\Anaconda3\lib\site-packages\matplotlib\axes_base.py in _update_line_limits(self, line)
1922 Figures out the data limit of the given line, updating self.dataLim.
1923 """
-> 1924 path = line.get_path()
1925 if path.vertices.size == 0:
1926 return

~\Anaconda3\lib\site-packages\matplotlib\lines.py in get_path(self)
1025 """
1026 if self._invalidy or self._invalidx:
-> 1027 self.recache()
1028 return self._path
1029

~\Anaconda3\lib\site-packages\matplotlib\lines.py in recache(self, always)
668 if always or self._invalidx:
669 xconv = self.convert_xunits(self._xorig)
--> 670 x = _to_unmasked_float_array(xconv).ravel()
671 else:
672 x = self._x

~\Anaconda3\lib\site-packages\matplotlib\cbook_init_.py in _to_unmasked_float_array(x)
1388 return np.ma.asarray(x, float).filled(np.nan)
1389 else:
-> 1390 return np.asarray(x, float)
1391
1392

~\Anaconda3\lib\site-packages\numpy\core_asarray.py in asarray(a, dtype, order)
83
84 """
---> 85 return array(a, dtype, copy=False, order=order)
86
87

TypeError: float() argument must be a string or a number, not 'Timestamp'

could you please help to check?
Thanks

Run tests on 'push' instead of 'master'

Could we run tests on 'push' instead of master? That would allow forks to be checked against the CI build.

In my latest pull request, I see that the tests failed because my tests for failed convergence raised a ValueError (instead of a numpy.linalg.LinAlgError) in ubuntu-latest.

Since I'm using windows, it's tricky to anticipate some of those platform differences without additionally testing on the CI build.

Recommend Projects

  • React photo React

    A declarative, efficient, and flexible JavaScript library for building user interfaces.

  • Vue.js photo Vue.js

    ๐Ÿ–– Vue.js is a progressive, incrementally-adoptable JavaScript framework for building UI on the web.

  • Typescript photo Typescript

    TypeScript is a superset of JavaScript that compiles to clean JavaScript output.

  • TensorFlow photo TensorFlow

    An Open Source Machine Learning Framework for Everyone

  • Django photo Django

    The Web framework for perfectionists with deadlines.

  • D3 photo D3

    Bring data to life with SVG, Canvas and HTML. ๐Ÿ“Š๐Ÿ“ˆ๐ŸŽ‰

Recommend Topics

  • javascript

    JavaScript (JS) is a lightweight interpreted programming language with first-class functions.

  • web

    Some thing interesting about web. New door for the world.

  • server

    A server is a program made to process requests and deliver data to clients.

  • Machine learning

    Machine learning is a way of modeling and interpreting data that allows a piece of software to respond intelligently.

  • Game

    Some thing interesting about game, make everyone happy.

Recommend Org

  • Facebook photo Facebook

    We are working to build community through open source technology. NB: members must have two-factor auth.

  • Microsoft photo Microsoft

    Open source projects and samples from Microsoft.

  • Google photo Google

    Google โค๏ธ Open Source for everyone.

  • D3 photo D3

    Data-Driven Documents codes.