

Statistical models and app for predicting when bikeshare stations will be empty or full in Washington DC and someday Chicago. The app is live at bikeshare.dssg.io.
This project is a part of the 2013 Data Science for Social Good fellowship, in partnership with Divvy and the Chicago Department of Transportation.
For a quick and gentle overview of the project, check out our blog post.
The City of Chicago just launched Divvy, a new bike sharing system designed to connect people to transit, and to make short one-way trips across town easy. Bike sharing is citywide bike rental - you can take a bike out at a station on one street corner and drop it off at another.
Bike sharing systems share a central flaw: because of commuting patterns, bikes tend to pile up downtown in morning and on the outskirts in the afternoon. This imbalance can make using bikeshare difficult, because people can’t take out bikes from empty stations, or finish their rides at full stations.
To prevent this problem, bikeshare operators drive trucks around to reallocate bikes from full stations to empty ones. In bikeshare parlance, this is called rebalancing.
Right now, they do this by looking at the current number of bikes at each station - not how many will be there in an hour or two.
We’re working with the City of Chicago’s Department of Transportation to make bikeshare rebalancing more proactive: by analyzing weather and bikeshare station trends, we can predict how many bikes are likely to be at each Divvy station in the future.
However, since there's not much bike sharing data for Chicago yet, we're first developing predictive models for Capital Bikeshare, Washington DC's bike sharing system.
Read more about bikeshare rebalancing on our blog
To predict the number of bikes at bike share stations in DC, we're using Poisson regression, a statistical technique useful for modeling counts.
Specifically, we take the current time of day, day of week, month, and weather as inputs into our model, and try to predict the number of bike arrivals and departures we expect to see at a given bike share station over the next 60 minutes. We subtract departures from arrivals to find the net change in bikes over the hour, and add this change to the current number of bikes to get our predicted bikes at the station in 60 minutes.
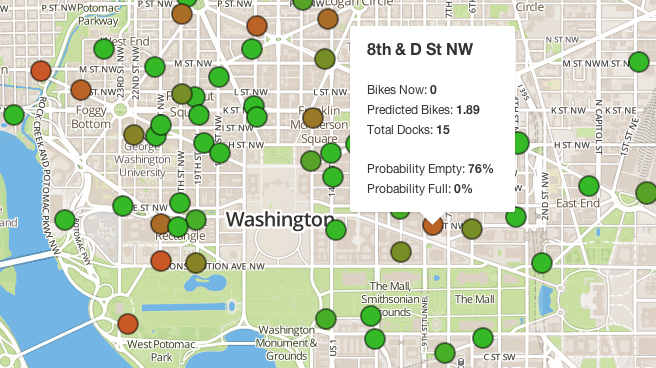
We do this for every station in DC's bikeshare system, and display the resulting predictions in a human-friendly web app.
Read more about our statistical model in the wiki
Alta bikeshare - the company that runs the bikeshare systems in Boston, Washington DC, New York, Chicago, and others - publishes real-time bike availability data for these cities through an API.
Every minute or two, the API reports the number of bikes and docks available at each bikeshare station in the city's system:
{
	"id":17,
	"stationName": "Wood St & Division St",
	"location": "1802 W. Divison St",
	"availableBikes": 6,
	"availableDocks": 9,
	"totalDocks": 15,
	"latitude": 41.90332,
	"longitude": -87.67273,
	"statusValue": "In Service",
}
We're using historical bike availability data for DC - courtesy of urban researcher Oliver O'Brien - and historical weather data from Forecast.io to fit our Poisson model.
To make predictions, we get real-time bike availability and weather data from Alta's DC API and Procure.io, and plug these inputs into our model.
Read more about how we're getting data in the wiki
There are three components to the project:
Thanks to Oliver O'Brien, we've got historical data on the number of bikes and docks available at every bikeshare station in DC and Boston since their systems launched. We're storing this data in postgreSQL database, and updating it constantly by hitting Atla's real-time bikeshare APIs. Read our wiki for more detail on these data sources.
Scripts to build the database, load historical data into it, and add real-time data to it are in the data and scrapers folders. The database updates every minute using a cron job that you need schedule on your own machine.
The Poisson model lives in model. There's also a binomial logistic model we implemented in there. Exploratory data analysis that informed the model choice lives in analysis.
There are scripts in model/possion that crunch the historical data in the database to estimate the model's parameters, and others that use the model to predict by consuming these parameters, fetching real-time model inputs from the database, and spitting out predictions. We also have model validation scripts that measure our model's predictive accuracy.
The webapp is currently live at bikeshare.dssg.io.
The app, which uses flask and bootstrap, lives in web. We use MapBox.js for mapping. Simply run python app.py to deploy the application on localhost.
To install either needed python dependencies, clone the project and run pip install -r requirements.txt
To get the project running locally, first to clone the repo:
git clone https://github.com/dssg/bikeshare
cd bikeshare/
You will need a working PostgreSQL 9.x series install. Once you have that, run data/create_db.sql to create all the appropriate tables.
We use several scrapers to populate the data in the database. Inside scrapers there is more detailed install instructions and example crontabs. You will need a forecast.io API key. Historical data will be made avalible shortly.
To the run the flash web app, you'll need to create a new python virtual environment, install needed python modules using pip, and run the flask server:
cd bikeshare/web
virtualenv ./
. bin/activate
pip install -r requirements.text
python web/app.py
To deploy the webapp in a production environment, use Gunicorn & nginx web servers.

To get involved, please check the issue tracker.
To get in touch, email the team at [email protected].
Copyright (C) 2013 Data Science for Social Good Fellowship at the University of Chicago
Permission is hereby granted, free of charge, to any person obtaining a copy of this software and associated documentation files (the "Software"), to deal in the Software without restriction, including without limitation the rights to use, copy, modify, merge, publish, distribute, sublicense, and/or sell copies of the Software, and to permit persons to whom the Software is furnished to do so, subject to the following conditions:
The above copyright notice and this permission notice shall be included in all copies or substantial portions of the Software.
THE SOFTWARE IS PROVIDED "AS IS", WITHOUT WARRANTY OF ANY KIND, EXPRESS OR IMPLIED, INCLUDING BUT NOT LIMITED TO THE WARRANTIES OF MERCHANTABILITY, FITNESS FOR A PARTICULAR PURPOSE AND NONINFRINGEMENT. IN NO EVENT SHALL THE AUTHORS OR COPYRIGHT HOLDERS BE LIABLE FOR ANY CLAIM, DAMAGES OR OTHER LIABILITY, WHETHER IN AN ACTION OF CONTRACT, TORT OR OTHERWISE, ARISING FROM, OUT OF OR IN CONNECTION WITH THE SOFTWARE OR THE USE OR OTHER DEALINGS IN THE SOFTWARE.


