// 公共样式
var _COMMON_ = {
    // 标题
    title : {
        x:'center',
        y:'top',
        textStyle:{
            fontSize:16,
            color: '#FFF'
        },
        subtextStyle:{
            fontSize:13
        }
    },
    // 图示
    legend: {
        show: true,
        orient: 'vertical',
        x: 'left',
        y: 'top',
        textStyle: {
            color: '#FFF',
            fontSize: 13
        },
    },
    // 提示框
    tooltip: {
        trigger: 'axis',
    }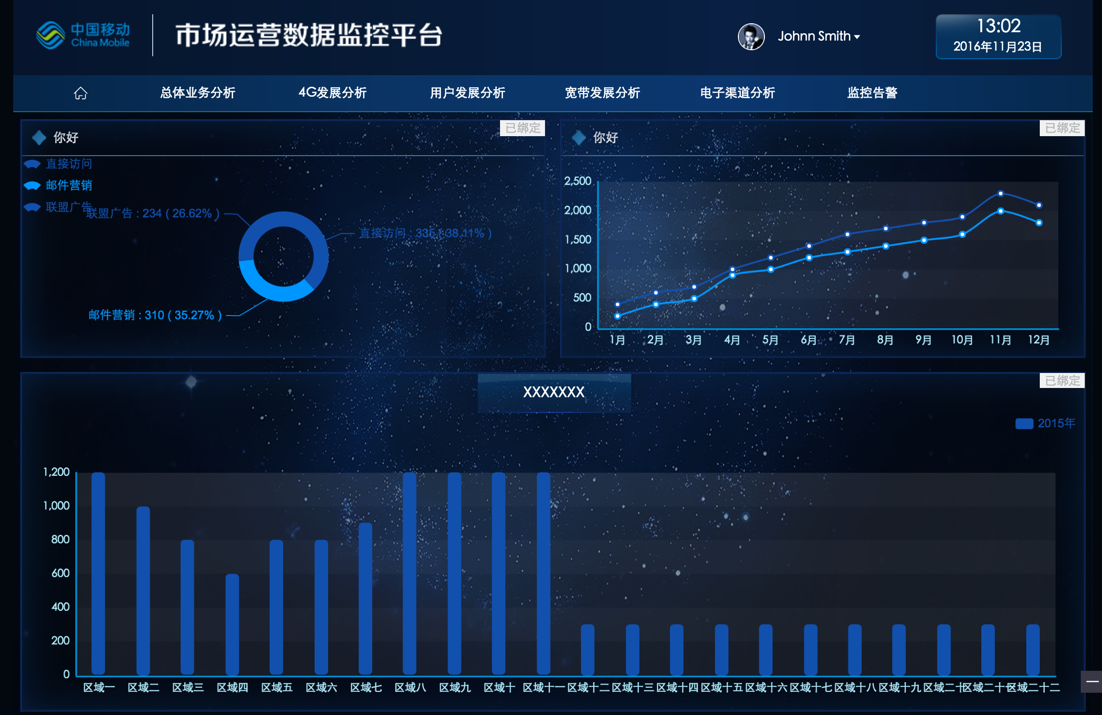
}// 饼图
{
title : {
text: '组件配置测试版本',
subtext: '作者:强大大',
},
legend: {
data: ['直接访问', '邮件营销', '联盟广告']
},
series: [
{
name: '访问来源',
type: 'pie',
center: ['50%', '50%'],
radius: ['30%', '45%'],
itemStyle: {
normal: {
label: {
formatter: "{b}" + " : " + "{c} ( {d}% )",
},
labelLine: {
show: true
}
}
},
// 数据源
data: [
{
value: 335,
name: '直接访问'
},
{
value: 310,
name: '邮件营销'
},
{
value: 234,
name: '联盟广告'
},
]
}
]
};
// 折线图
{
tooltip: {
show: true
},
title: {
text: '折线图配置',
subtext: '作者:强大大'
},
legend: {
data: ['2015迁徙人数', '2016迁徙人数']
},
grid: {
x: 56,
y: 60,
x2: 60,
y2: 33,
},
xAxis: [{
type: 'category',
axisTick: {
show: false
},
splitLine: false,
data: ['1月', '2月', '3月', '4月', '5月', '6月', '7月', '8月', '9月', '10月', '11月', '12月'],
axisLabel: {
textStyle: {
color: '#b4effe',
fontSize: '10px',
margin: "15px"
}
}
}],
yAxis: [{
type: 'value',
splitLine: false,
axisLabel: {
textStyle: {
color: '#b4effe',
fontSize: '10px',
margin: "15px"
}
}
}],
series: [
{
name: '2015迁徙人数',
type: 'line',
data: [400, 600, 700, 1000, 1200, 1400, 1600, 1700, 1800, 1900, 2300, 2100]
},{
name: '2016迁徙人数',
type: 'line',
data: [200, 400, 500, 900, 1000, 1200, 1300, 1400, 1500, 1600, 2000, 1800]
}
]
}// 文字数据集合卡片
option = {
type: 'textCard',
data: {
headerlines: '静安区八号店',
maintitle: [
'小营业厅',
'小小营业厅'
],
subtitle: [
'TX',
'XTX'
],
times:{
startTime : '09:00',
endTime : '18:00'
}
}
}
// 一级标题
option = {
type: 'titleContent',
common:'1',
data: {
title:'2016年8月20日区域三4G发展量',
innerData:['Jason','Stencen','Steven']
}
}
// 基本表格按钮
option = {
type :'button',
data: {
name:'Hello',
style:'btn-primary btn-lg'
}
}
// 表格
option = {
type :'table',
data:{
tableHead:['标题1','标题二','标题三','标题四'],
buttonIndex:['0','1','2'],
option:[
['Hello7','World0','Wellcom0','Js0'],
['Hello1','World1','Wellcom1','Js1'],
['Hello2','World2','Wellcom2','Js2'],
['Hello3','World3','Wellcom3','Js3']
]
}
}var _MYCHART_ = _MYCHART_ || "" // echarts绘图对象
, _OPTIONS_ = _OPTIONS_ || {}; // 存储echarts数据全局对象
;(function($,doc,win){
var EC = function(obj,opt){
this.obj = obj;
this.setting = {
echartObj: "", // 绘图对象
option : null // 绘图数据
};
$.extend(this.setting, opt);
// 初始化
this.init(this.setting);
};
EC.prototype = {
echarts : function(opt){
var self = this;
// 环境依赖
require.config({
paths:{
'echarts' : './js/echarts/echarts'
}
});
require([
'echarts'
],function(ec) {
_MYCHART_ = ec.init(document.getElementById(opt.echartObj));
_MYCHART_.setOption(opt.option);
});
}
};
EC.prototype.init = function(opt){
this.echarts(opt);
}
window.EC = EC;
})(jQuery,document,window);new EC($('#echartController'), {
echartObj: objID,
option: option
});var title = option.title || {}
, legend = option.legend || {}
, tooltip = option.tooltip || {};
$.extend(title, _COMMON_.title);
$.extend(legend, _COMMON_.legend);
$.extend(tooltip, _COMMON_.tooltip);
option.title = title;
option.legend = legend;
option.tooltip = tooltip;// 定义全局对象params 做一个状态判定
var params = {
left: 0, // 左偏移值,默认为0
top: 0, // 右偏移值,默认为0
currentX: 0, // 当前X轴坐标,默认为0
currentY: 0, // 当前Y轴坐标,默认为0
flag: false // 是否可拖拽,默认为false
};
// 组件加载的判定实现
var flag = false;
for (var i=0; i<$(el).length; i++){
if ($(el).eq(i).find(el).length>0){
continue;
}
var zoom = $('#echartController').css('zoom')
, left = $obj.eq(i).offset().left * zoom
, top = $obj.eq(i).offset().top * zoom
, scroT = $(document).scrollTop()
, zoomW = $obj.eq(i).width() * zoom
, zoomH = $obj.eq(i).height() * zoom;
if (d>left && d<left+zoomW && c+scroT>top && c+scroT<top+zoomH) {
flag = true;
$(el).removeClass('add-active');
$(el).eq(i).addClass('add-active');
} else if (!flag && params.flag){
$(el).removeClass('add-active');
}
objID = $(el+'.add-active').attr('id');
}