I am no longer maintaining penguins.
I mostly used this as a tool for my own papers and my PhD thesis, and it served me admirably.
However, I'm no longer working in chemistry and so I don't use this any more.
If you run into bugs, consider them features :)
![]()

penguins is a Python 3 package intended mainly for generating publication-quality plots of NMR spectra in a programmatic, reproducible fashion.
It also performs a very small number of processing and analysis of NMR spectra, namely integration as well as generation of projections/slices.
python -m pip install penguins
(It's a good idea to use a virtual environment.)
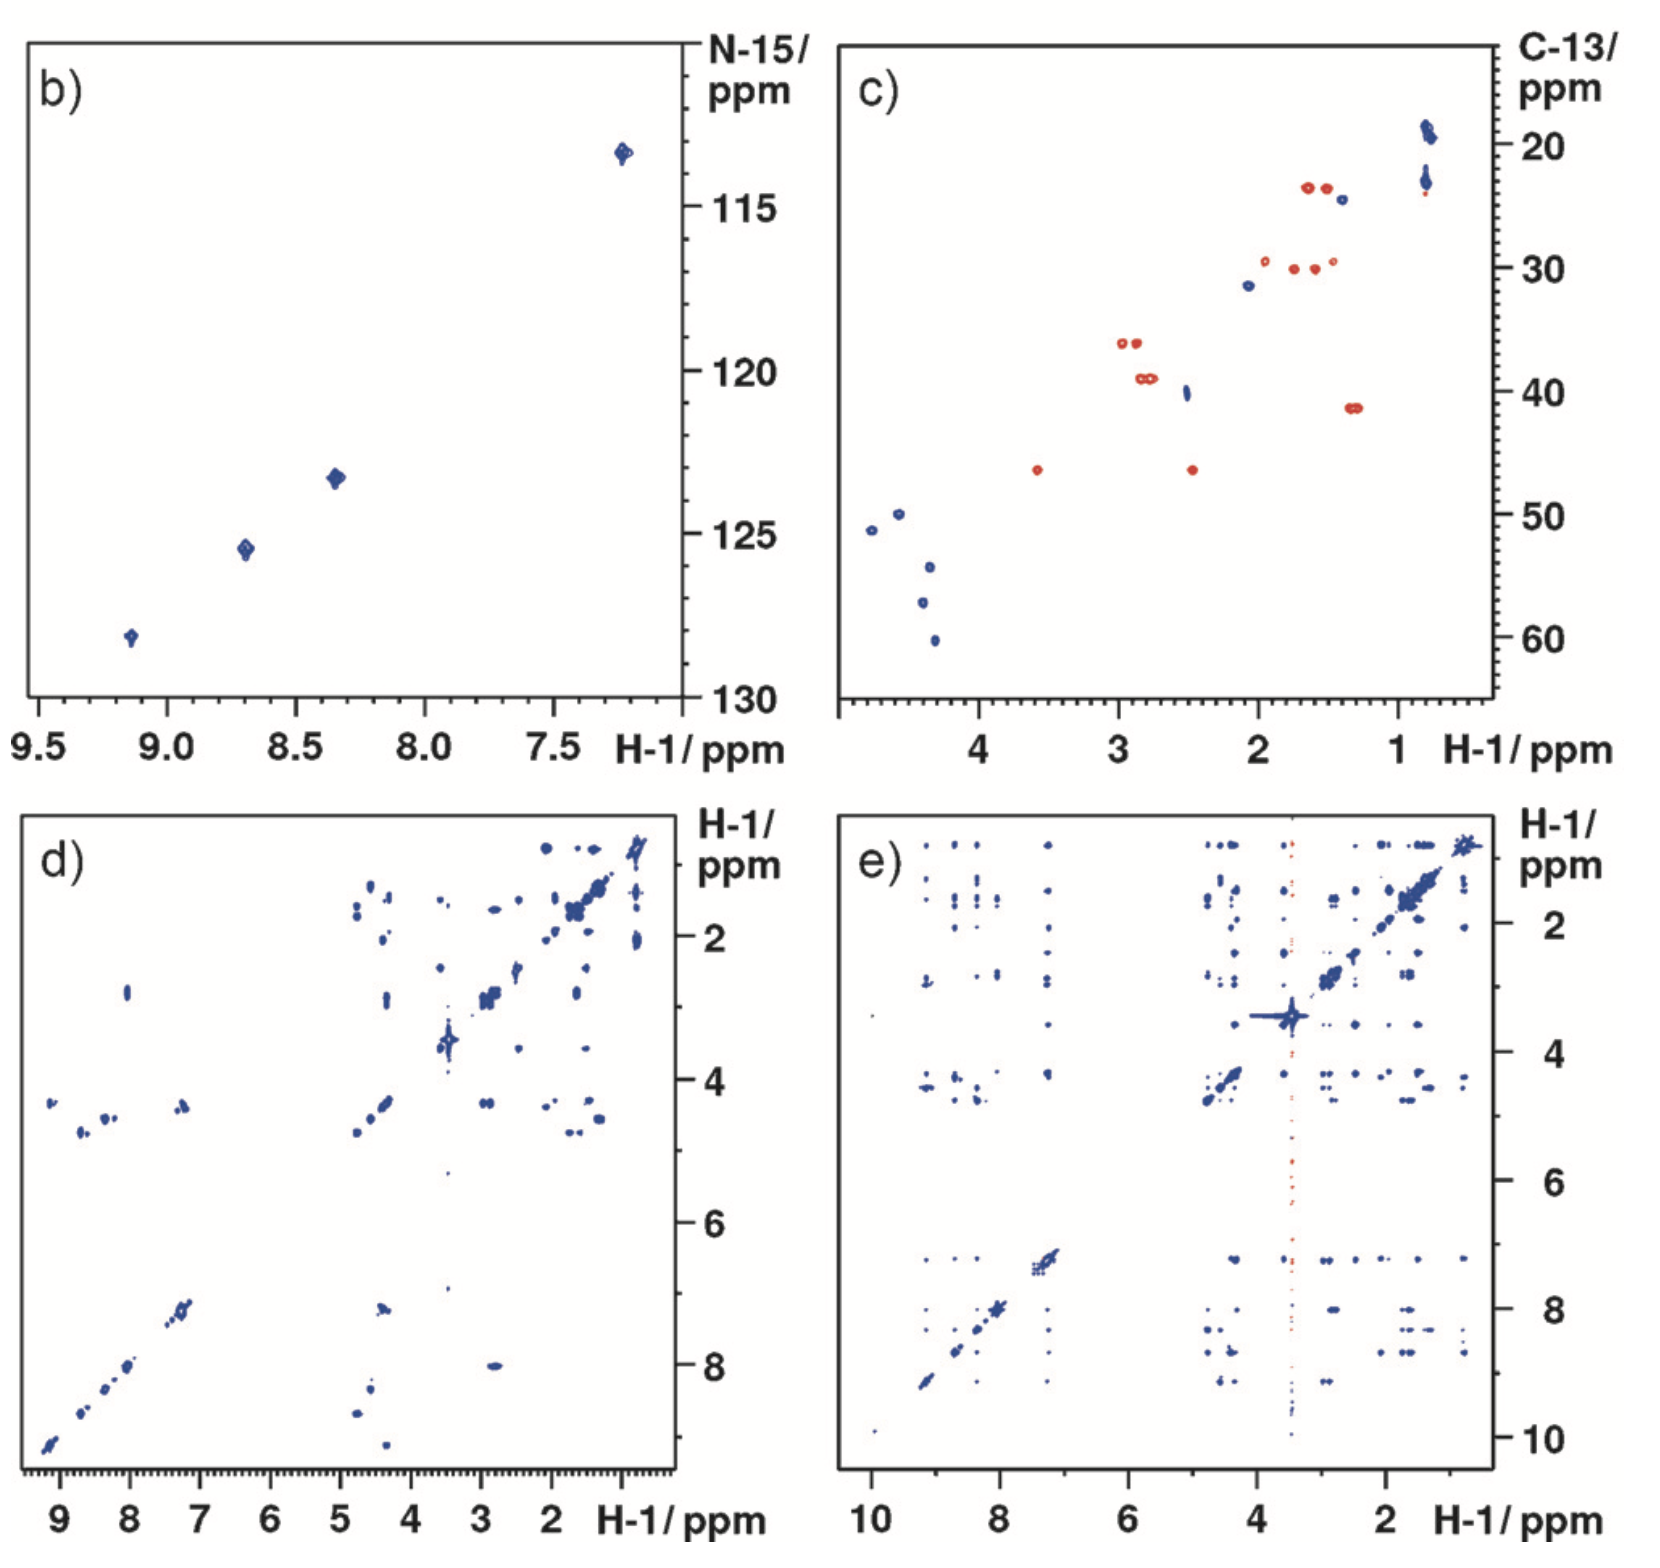
As an example of the output, here's Figure 2 from Angew. Chem. Int. Ed. 2017, 56 (39), 11779–11783:
And here's a similar plot that can be done in under 20 lines of PEP8-compliant code using penguins (it's the same compound, but not the same data):
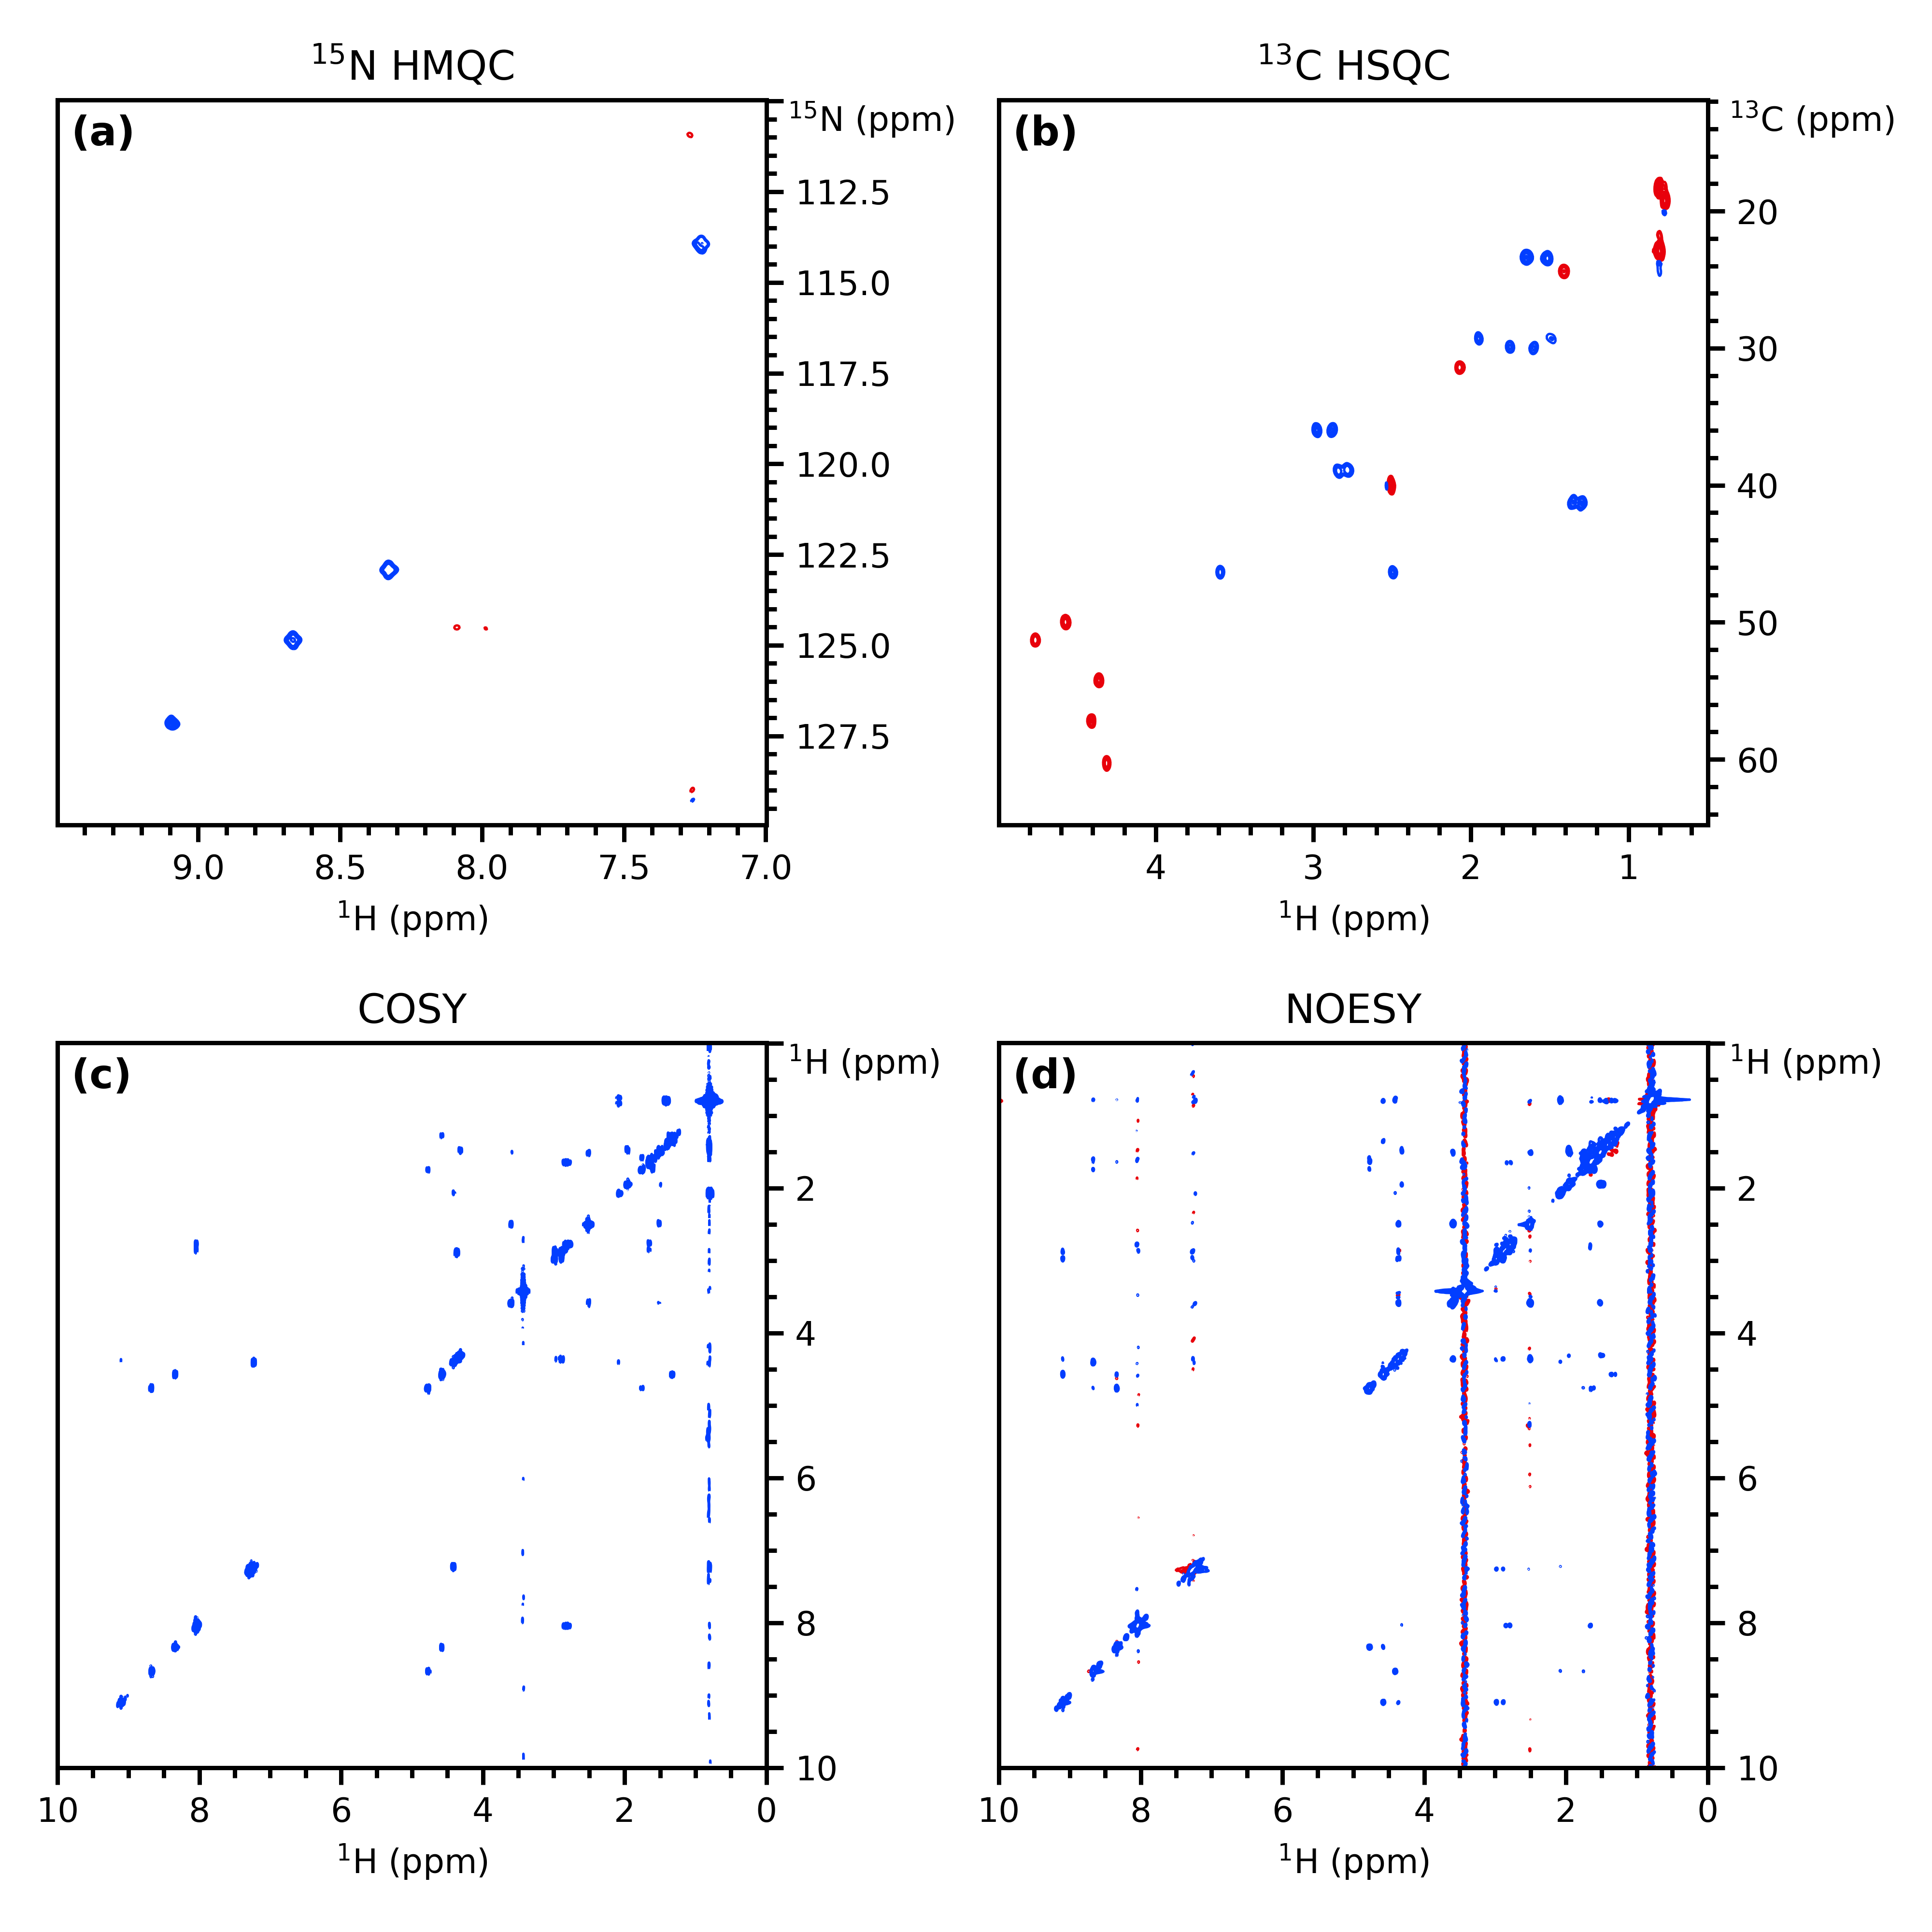
import penguins as pg

hmqc, hsqc, cosy, noesy = pg.read("penguins-testdata", range(22001, 22005))

fig, axs = pg.subplots2d(2, 2)
hmqc.stage(axs[0, 0], levels=7e3, f1_bounds="110..130", f2_bounds="7..9.5")
hsqc.stage(axs[0, 1], levels=4e4, f1_bounds="12..65", f2_bounds="0.5..5")
cosy.stage(axs[1, 0], levels=8e5)
noesy.stage(axs[1, 1], levels=1e5)

titles = [r"$^{15}$N HMQC", r"$^{13}$C HSQC", "COSY", "NOESY"]
for ax, title in zip(axs.flat, titles):
    pg.mkplot(ax, title=title)
    pg.ymove(ax, pos="topright")

pg.label_axes(axs, fstr="({})", fontweight="semibold", fontsize=12)
pg.cleanup_axes()
pg.show()Documentation can be found at https://yongrenjie.github.io/penguins. There are tutorial-type articles intended for entirely new users; I'm working on documentation beyond that, but it's not my main job, so it's a little slow.
Note that penguins is still in development, so the interface should not be assumed to be (too) stable. For now, I am working directly on the master branch, and rebasing/force pushing may occur without warning.
NOTE: You may want to silence type checking. There are plenty of issues with this which I have yet to fix. I have chosen to design penguins to provide Pythonic, friendly syntax, which unfortunately makes it very difficult to correctly specify types.


