wwrechard / pydlm Goto Github PK
View Code? Open in Web Editor NEWA python library for Bayesian time series modeling
License: BSD 3-Clause "New" or "Revised" License
A python library for Bayesian time series modeling
License: BSD 3-Clause "New" or "Revised" License


first, I just want to thank you for building this awesome library. Very impressive and extremely useful.
I'm running into a bug where I cannot append new data to a DLM that has an AutoReg component. If I build the model without the AutoReg component, everything works. Here is an example of the problem:
dlm = pydlm.dlm(data['gross_revenue'].values)
dlm += pydlm.seasonality(period=7, w=0.95)
dlm += pydlm.autoReg(degree=2, discount=0.95)
dlm += pydlm.dynamic(features=[[x[0],x[1],x[2]] for x in features_matrix.values[:,:]], name='dau', discount=0.99)
dlm.fit() #so far so good at this point.
dlm.append([new_data['gross_revenue']], component='main') #this line yields the following error:
AttributeError: 'autoReg' object has no attribute 'appendNewData'
Perhaps I'm not implementing the update correctly? If I remove the AutoReg component, everything works. Any advice is greatly appreciated.
Hi great work here! I'm trying to make this work for categorical data.
I've 3 columns:

I'm trying to predict the "function" column given time and "ROI" BUT Func and ROI are dependent on each other.. Each 'ROI' has some set of functions(one-to-many). Any idea how to proceed with this? (sorry I'm new to this topic).
I am trying to fit the following model (local level model) using pydlm package in Python-
Yt = θt + vt, vt ∼ N(0, Vt),
θt = θt−1 + wt, wt ∼ N(0,Wt) …….(1)
I have simulated the above model in python with the following values for Vt and Wt-
sigma2_v = 0.5 ………..(2)
sigma2_w = 0.25 ……….(3)
x0 = 0
t = 500
t_burn = 100
t_tot = t + t_burn
y_tot = np.zeros(t_tot)
x_tot = np.zeros(t_tot)
v = np.random.normal(0, sqrt(sigma2_v), t_tot)
w = np.random.normal(0, sqrt(sigma2_w), t_tot)
x_tot[0] = x0 + w[0]
y_tot[0] = x_tot[0] + v[0]
for i in range(1,t_tot):
x_tot[i] = x_tot[i - 1] + w[i]
y_tot[i] = x_tot[i] + v[i]
I am using the following argument to fit model (1) in pydlm
myDLM1 = dlm(y_tot)
trend1 = trend(degree=0, discount=0.99, name = 'trend')
myDLM1 = myDLM1 + trend1
myDLM1.tune(maxit = 100)
myDLM1.fit()
Below are my values for Vt and Wt-
var_v = myDLM1.getVar(filterType='forwardFilter')
var_v
0.996619
0.771301
1.183684
0.910351
0.774972
.. ...
1.003247
1.003131
1.001465
0.999822
0.999866
var_w = myDLM1.getVar(filterType='forwardFilter', name = 'trend')
var_w
0.496571
0.285149
0.370662
0.257496
0.205303
.. ...
0.231519
0.231492
0.231107
0.230728
0.230738
Questions-
Which are very close to the original sigma2_v and sigma2_w from which the y series has been simulated.
I am unable to recover the similar values using pydlm.
Can you please help me out with this problem?
Hello
where does regressor10 come from?
thank you
When running
simple_dlm = dlm(data) + autoReg(degree=3, data=data, name='ar3', w=1.0)
simple_dlm.fit()
I get
Traceback (most recent call last):
  File "final.py", line 81, in <module>
    simple_dlm.plotPredictN(date=780, N=51)
  File "/Users/gcgibson/anaconda/lib/python2.7/site-packages/pydlm/dlm.py", line 1139, in plotPredictN
    N=N, date=date, featureDict=featureDict)
  File "/Users/gcgibson/anaconda/lib/python2.7/site-packages/pydlm/dlm.py", line 379, in predictN
    (obs, var) = self.continuePredict(featureDict=featureDictOneDay)
  File "/Users/gcgibson/anaconda/lib/python2.7/site-packages/pydlm/dlm.py", line 328, in continuePredict
    return self._continuePredict(featureDict=featureDict)
  File "/Users/gcgibson/anaconda/lib/python2.7/site-packages/pydlm/func/_dlm.py", line 441, in _continuePredict
    extra = comp.d - len(self.predictStatus[2])
AttributeError: dlm instance has no attribute 'predictStatus'
however, setting ar=1 seems to work fine.
I generated a dlm model using pydlm method. How can I apply this model to do the prediction of a new dataset?
from pydlm import dlm, trend, seasonality, dynamic, autoReg, longSeason
myDLM = dlm(dataset1)
myDLM.add(trend(degree=0, discount=0.99, name='trend2'))
filter = myDLM.predict (new dataset) ??
Thank you!
I know this issue can be muted. But I am wondering if there is a plan to replace numpy.matrix with numpy.ndarray. Thanks!
When I run pydlm on my data with daily collection and seasonality of 365. it is very very slow
Hello,
I'm attempting to using binary data in the PYDLM algorithm, similar to BSTS (R). The model fits, but it returns "nan" for predicted values. Does PyDLM not accept binary data?
my data is in the form:
y = [0,1,0,0,0,1,0,01,0,1,0,1,0,1....]
(predictMean, predictVar) = mydlm.predictN(N=3, date=mydlm.n-1)
Is there any plan to extend the module to allow for dynamic factor models where latent states are fewer than observed time series?
Hi,
Amazing work here! I am reading Bayesian Forecasting and Dynamic Models (Harrison and West, 1997) and try to use your module to construct an univariate DLM model as follows.

It seems the components that I need to put into the model are just trends, dynamic and autoreg, but I am wondering how to mix them so that I can get such a model.
Is there a way to do so? Because I can not find any similar example in the documentation.
Thanks!
Hi,
Is there any technical reason to store the whole time series used to create a model, besides plotting? If a model is grown by appending new data it can be a huge limitation to store all the values in memory, since it will eventually be too slow to save and load from disk. Besides, as far as I understand it, the model only needs a handful of parameters in order to perform the forward filtering and compute new predictions. Thus, it would be great if we could have the option to create a "minimal" dlm object, that only stores the information strictly necessary to compute basic operations such as appending, fitting and predicting.
Thank you in advance
Hey, thanks for the nice lib! I was wondering if you'd be able to increment and release an up-to-date version to PyPi. If not, do you have any sense of when a new version will be released?
Hi,
Thanks for offering such a great DLM module. It is a very nice tool to have in Python.
I'm wondering if I can find the regression residual time series anywhere. I want to do some analysis on the residuals of the DLM, so that I can better understand the performance of the model. Thanks!
I want to learn the parameters of a DLM by EM algorithm. I am wondering how I can specify the evaluation matrix, evaluation covariance, transition matrix, transition covariance and initial latent state mean and covariance by the result I get from EM algorithm. Is it possible in the current version?
Looks like an easy fix. Want a PR?
/pydlm/modeler/dynamic.py:18: DeprecationWarning: Using or importing the ABCs from 'collections' instead of from 'collections.abc' is deprecated since Python 3.3, and in 3.9 it will stop working
from collections import MutableSequence
Hello! I am wondering how you run your test modules in the "tests" directory. When I run the python scripts in "tests" directly, an ImportEerror will be raised because the python interpreter cannot find the modules in "base", "modeler" and "func". Did you come across the same problem?
If I move the test script to pydlm directory, then it works without error. Could you please tell me how do you set your enveronment ? Much obliged.
I get different results in an extremely simple dynamic linear model, using dlm package in R and pydlm.
In particular, I create a random walk + noise dlm (that is dlm with just a trend of degree 0 or 1, depending on the version of the pydlm package). I fix the discount factor to be 1, that is W_t = 0 for all t (that is, the variance of the noise of the state evolution equation is null). The noisePrior is 1.0 by default. I fix the prior variance to be 2.0. I include just one observation: 1.70. With this I build the dlm:
Here the code:
from pydlm import *
d = dlm([1.70])
t = trend(degree = 0, discount=1, w = 2)
d = d + t
d.fitForwardFilter()
print(d.getLatentState())
[[1.1333333333333333]]
print(d.getLatentCov())
[matrix([[ 0.65444444]])]
Doing the same in R, I obtain the same latent state, but different state covariance. Particularly I obtain 0.666666.
In fact, performing the calculations by hand, I obtain the same as in R. This is quite easy to reproduce, following the formulas in page 53 of this book: Dynamic Linear Models with R, Giovanni Petris, Sonia Petrone, Patrizia Campagnoli.
Am I misunderstanding the meaning of some parameter?
I obtained the following warning when using this package. Will there be any update to address this issue? Thank you!!
DeprecationWarning: Using or importing the ABCs from 'collections' instead of from 'collections.abc' is deprecated since Python 3.3, and in 3.9 it will stop working from collections import MutableSequence.
Facing this issue when trying to make two points ahead prediction(for one point ahead prediction it works fine). Looked into the code, it appears that somehow continue prediction module is not getting the first forecasts's AR component which is required for second forecast. I use following model:
data_pydlm = data.set_index('date', drop=True)
myDLM_pred = dlm(data_pydlm.y)
myDLM_pred = myDLM_pred + trend(degree=trend_degree, name='trend', w=trend_w)
myDLM_pred = myDLM_pred + seasonality(12, name='12month', w=seasonality_w)
myDLM_pred = myDLM_pred + autoReg(degree=ar_degree, data=prod_pydlm.y, name='ar', w = ar_w)

myDLM_pred.fit()
Error:
print(myDLM_pred.predictN(N=2, date=myDLM_pred.n - 1))
File "C:\Anaconda\Anaconda3\lib\site-packages\pydlm\dlm.py", line 379, in predictN
(obs, var) = self.continuePredict(featureDict=featureDictOneDay)
File "C:\Anaconda\Anaconda3\lib\site-packages\pydlm\dlm.py", line 328, in continuePredict
return self._continuePredict(featureDict=featureDict)
File "C:\Anaconda\Anaconda3\lib\site-packages\pydlm\func_dlm.py", line 441, in _continuePredict
extra = comp.d - len(self.predictStatus[2])
AttributeError: 'dlm' object has no attribute 'predictStatus'
I would appreciate any help with this
hi Samuel,
DLM is really great works for time series analysis. while I have some troubles in predict, codes are as following, where I want to predict mean and variance at the 11th day:
#use 10 days data to predict mean and variance at the 11th day
from pydlm import dlm, trend, seasonality, dynamic, autoReg, longSeason
y=[1,2,3,4,5,6,7,8,9,10]
myDLM=dlm(np.array(y))
myDLM=myDLM+trend(1,discount=0.9)+seasonality(period=4)
myDLM.fit()
(temp_obser, temp_var)=myDLM.predict(date=10)
A 'NameError' always raised as 'Prediction can only be made right after the filtered date' ,
while it works for data=0, i am wondering whether date=9 can be used to predict the 11th day?
Another bothering,
how to use myDLM.getMean(filterType='predict'), the results as following:
[0.0,
0.5141700157557093,
1.0505510107948781,
1.6023862753925242,
2.167438960958558,
2.7443287976659794,
3.3319788291099885,
3.9294677809751066,
4.535975127609981,
5.150754959923865]
while (temp_mean, temp_var)=myDLM.predict(date=9), the temp_mean is 5.773, which is different with the last data 5.150754959923865 in getMean? I wondering is getMean(filterType='predict') can get the predict mean as myDLM.predict? thanks for your kind help.
Jianju
Hi,
I was searching for an alternative for bsts(R) in Python and stumbled on this gem.
As far as I understand there is no difference between bsts and pydlm, except for the fact that bsts uses a Spike and Slab prior in its regressor(to induce sparsity)
Is there any plan to include an option to use a spike and slab prior in pydlm?
I'm trying to plot individual components of a fit model using model.plot(component_name), and am getting a TypeError that arises from incorrect usage of map in Python 3. In Python 2, map produces a list that you can index into, but that is not the case in Python 3. Here's the full traceback:
---------------------------------------------------------------------------
TypeError                                 Traceback (most recent call last)
<ipython-input-23-9e7922b7c508> in <module>()
----> 1 model.plot('linear_trend')

~/.pyenv/versions/3.6.0/lib/python3.6/site-packages/pydlm/dlm.py in plot(self, name)
   1035                                   data=data,
   1036                                   result=self.result,
-> 1037                                   options=self.options)
   1038         dlmPlot.plotout()
   1039

~/.pyenv/versions/3.6.0/lib/python3.6/site-packages/pydlm/plot/dlmPlot.py in plotComponent(time, data, result, options)
    352             upper, lower = getInterval(data['filteredMean'],
    353                                        map(abs, data['filteredVar']),
--> 354                                        p=options.confidence)
    355
    356             plotInterval(time=time[start:end],

~/.pyenv/versions/3.6.0/lib/python3.6/site-packages/pydlm/base/tools.py in getInterval(means, var, p)
     73     lower = [0] * len(means)
     74     for i in range(0, len(means)):
---> 75         upper[i] = means[i] + alpha * math.sqrt(var[i])
     76         lower[i] = means[i] - alpha * math.sqrt(var[i])
     77

TypeError: 'map' object is not subscriptable
And here's a minimal code example to clarify what's going wrong:
>>> map(abs, [-1,2,-3,4])[0]
---------------------------------------------------------------------------
TypeError                                 Traceback (most recent call last)
<ipython-input-25-22af85735bae> in <module>()
----> 1 map(abs, [-1,2,-3,4])[0]

TypeError: 'map' object is not subscriptable
Wrapping those arguments in list() calls would probably fix it, but maybe there's a better way.
Hi everyone.
I've used pydlm since version 0.1.1.7 and in fact, in one of my laptops I'm still using it.
I've downloaded the newest version 0.1.1.9 in another lap top and I've checked that results in both versions are totally different (same data, same model).
I've even used the Google unemployed data to check the results in both versions and they'r totally different also. It happens since the model.fit() function and obviously the predict function gives very very strange results in version 0.1.1.9.
I've noticed that version 0.1.1.7 shows results that seem more realistic.
Why does it happen? Did something change in the way modelling data between both versions?
Hi,
Is there any way to get separate components for future prediction, let's say I just want to get trend component of future predictions.
Hi There,
Bayesian time series models typically return a 2d array of the forecast for every draw and every timestamp that is predicted. I skimmed through the documentation and I was not able to find a class method to get that info from my Pydlm model. Is there any way to retrieve this array from pydlm?
Thanks
I have a simple model with one data point for each hour, I have a daily season (24 hours) and a weekly season 7 periods a 24 hours.
        data = df["avg"] # just a column of a pandas DataFrame
        bsts = dlm(data)
        # A linear trend
        bsts = bsts + trend(degree=1, discount=0.95, name='linear_trend', w=10)
        bsts = bsts + seasonality(period=24, discount=0.99, name='seasonal24', w=10)
        bsts = bsts + longSeason(data=data, period=7, stay=24, discount=0.99, name='seasonal7', w=100)
which produces the following error:
Initializing models...
Traceback (most recent call last):
  File "bsts.py", line 121, in <module>
    group_by_test()
  File "bsts.py", line 54, in group_by_test
    bsts.fit()
  File "/Applications/anaconda3/lib/python3.7/site-packages/pydlm/dlm.py", line 283, in fit
    self.fitForwardFilter()
  File "/Applications/anaconda3/lib/python3.7/site-packages/pydlm/dlm.py", line 185, in fitForwardFilter
    self._initialize()
  File "/Applications/anaconda3/lib/python3.7/site-packages/pydlm/func/_dlm.py", line 150, in _initialize
    self.builder.initialize(noise=self.options.noise, data=self.padded_data)
  File "/Applications/anaconda3/lib/python3.7/site-packages/pydlm/modeler/builder.py", line 277, in initialize
    comp.updateEvaluation(0, data)
TypeError: updateEvaluation() takes 2 positional arguments but 3 were given
Am I using longSeason correctly?
Is it possible to forecast with regressors such as in the Google example? I first split the data into a train and valid set. I fit the train set. Then I conform the valid set regressors into a dictionary as such:
new_dict = {k:list(df[k].unique()) for k in df.columns}
However, I am seeing a NameError: The step is out of range error.
Hi.
I want to fit a time serie with biweekly frequency.
I'm wondering if there's a way to set the biweekly frequency in seasonal parameter.
I know that for daily data, frequency = 7, monthly = 12, quarterly = 4...but I can't figure out how to set biweekly data...maybe 52 / 2 = 26 ???
Thanks a lot.
Hello,
I've used this package with some success to model hundreds of time series so thanks for the effort !
I'd like to use it in production but I've run into some issues related to the size of the model. One model currently takes 300mb with the maximum compression using joblib ! This would take more than 150Gb to save all the models which isn't tractable.
Do you have any tricks to reduce the disk footprint ?
Hi,
Does the package account for any feature normalization when variables of different scales are passed into the model? Square root matrix normalization or something similar? If not, is it preferable for the user to pass in normalized variables for the model to make sense?
Thank you
I have some hourly data where there is a daily seasonality which I am modeling with a 24 hour seasonality component, but there is also a weekly seasonality that I would like to model. I believe that longSeason is the correct choice here, with a period of 7 and stay of 24. Here is my model:
import pydlm as dlm
the_dlm   = dlm.dlm(oc1819_tr.total)
the_ar    = dlm.autoReg(degree=5, discount=0.99, name='ar_5', w=1e7)
the_trend = dlm.trend  (degree=1, discount=0.995, name='trend1', w=1e7)
the_daily = dlm.seasonality(period=24, discount=0.99, name='seasonal_daily', w=1e7)
the_weekly = dlm.longSeason(data=oc1819_tr.total, period=7, stay=24, name='seasonal_weekly', w=1e7, discount=0.99 )
dlm_model = the_dlm + the_ar + the_daily + the_trend + the_weekly
However, this causes a TypeError in the fit function which does not seem to be a configuration error:
TypeError                                 Traceback (most recent call last)
<ipython-input-148-c0cf1bf753dd> in <module>
      1 import timeit
      2 i = timeit.default_timer()
----> 3 dlm_model.fit()
      4 timeit.default_timer()-i

~/anaconda3/lib/python3.7/site-packages/pydlm/dlm.py in fit(self)
    281
    282         """
--> 283         self.fitForwardFilter()
    284         self.fitBackwardSmoother()
    285

~/anaconda3/lib/python3.7/site-packages/pydlm/dlm.py in fitForwardFilter(self, useRollingWindow, windowLength)
    183         # see if the model has been initialized
    184         if not self.initialized:
--> 185             self._initialize()
    186
    187         if self._printInfo:

~/anaconda3/lib/python3.7/site-packages/pydlm/func/_dlm.py in _initialize(self)
    148         """
    149         self._autoNoise()
--> 150         self.builder.initialize(noise=self.options.noise, data=self.padded_data)
    151         self.Filter = kalmanFilter(discount=self.builder.discount,
    152                                    updateInnovation=self.options.innovationType,

~/anaconda3/lib/python3.7/site-packages/pydlm/modeler/builder.py in initialize(self, data, noise)
    275             for i in self.automaticComponents:
    276                 comp = self.automaticComponents[i]
--> 277                 comp.updateEvaluation(0, data)
    278                 transition = mt.matrixAddInDiag(transition, comp.transition)
    279                 evaluation = mt.matrixAddByCol(evaluation,

TypeError: updateEvaluation() takes 2 positional arguments but 3 were given
Could this be related to the fact that all components except longSeason no longer take a data argument?
Example in docs at https://pydlm.github.io/# suggests this hello world example, however the getFilteredObs method is seemingly no longer in use
myDLM = dlm([]) + trend(1) + seasonality(7)
for t in range(0, len(data)):
...     myDLM.append([data[t]])
...     myDLM.fitForwardFilter()
filteredObs = myDLM.getFilteredObs()
I think this should be replaced by a call to model.predict() inside the loop, as per https://github.com/microprediction/timeseries-notebooks/blob/main/pydlm_hello.ipynb ?
Thank you for your great method and implementation.
May I kindly ask you, how to save the result of plotPredictN as a png image?
First of all thank you for the library. I find that when i fit a model in root Python (-v 3.6.10) it runs way faster than venv version. Can you please mention, if any of the pydlm dependency causes this or there is something more that needs to be taken into account.
Hi all,
The steps to reproduce my problem are:
I would expect the prediction in step 3 and the last prediction in step 4 to be the same. However, it seems that somehow predictN is changing the dlm object, which does not make sense to me. What am I missing? Installed versions:
I attach the code to reproduce the problem below:
# coding: utf-8

import pandas as pd
from pydlm import dlm, trend

ts = [
 0.5429682543922109,
 0.5296058346035057,
 0.5403294585554494,
 0.542441925561093,
 0.5435209708555084,
 0.5430676782288945,
 0.5429877208796179,
 0.5429721282202071,
 0.5429690254184671,
 0.5449758960859548,
 0.5457612294317765,
 0.5434065016617284,
 0.5430519745276086,
 0.5436459000038072,
 0.5437794184525637]

## Version 1
model = dlm([]) + trend(degree=2, discount=0.95, name='trend1')

d = {}
for idx, el in enumerate(ts):
    model.append([el], component='main')
    model.fitForwardFilter()

mean, var = model.predictN(N=1, date=model.n-1)
d[idx] = mean

df1 = pd.DataFrame.from_dict(d, orient="index")


## Version 2
model = dlm([]) + trend(degree=2, discount=0.95, name='trend1')

d = {}
for idx, el in enumerate(ts):
    model.append([el], component='main')
    model.fitForwardFilter()
    mean, var = model.predictN(N=1, date=model.n-1)
    d[idx] = mean

df2 = pd.DataFrame.from_dict(d, orient="index")

print(df1)
print(df2)
Thanks in advance
Line 729 of dlm.py reads:
if len(self.builder.dynamicComponents) > 0:
print('Remember to append the new features for the' +
' dynamic components as well')
I'm going to suggest allowing suppression of this, as there isn't a way to add the data to 'main' and also dynamic at the same time - so this message will always be displayed, often in an inner loop.
Hi,
can you consider splitting the core functionality and the plotting? I (and probably others) want to run pydlm in the server environment where plotting is not required. In some environments the space is tight and installing matplotlib may be a problem. In particular I am going to run pydlm on AWS Lambda, where I need to prepare a stripped down version of pydlm with plotting (or at least the matplotlib dependency) removed.
It would be easier to just have this in two separate packages.
All my plots with plotpredictN seems to start with the first predicted point above or below the point selected by date= .
To clarify what I mean, I think the line in dml.py for the function plotPredictN :
predictedTimeRange = range(date, date + N)
should be
predictedTimeRange = range(date + 1, date + N +1)
I want to create a Time Varying Linear model like this:
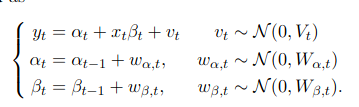
How should I proceed with the same? You documentations lacks some notations, adding which would be really beneficial. But nice work. Its really useful in my research
Team
I get this error
cannot import name 'trend' from 'pydlm' (unknown location)
Would you consider replacing list with numpy arrays? It would be easier and maybe faster for the current data processing pipeline using pandas.
Hi, I'm trying to retrieve the raw data used in plotCoef.
I'm in the idea that the red line is taken via
.getLatentState(filterType='backwardSmoother', name='x')
but my issue is that I haven't found what are the values taken to plot the probability bands for such latent state
I thought that using
.getLatentCov(filterType='backwardSmoother', name='x')
would give me such numbers (by adding and substracting them from the Latent State) but such numbers are not the same as those that were plotted.
Am I doing and / or interpreting something wrong?
Thanks in advance
hi Samuel,
Sorry for bothering again, I want to use ignore and tune method in myDLM, while it is error when run following code:
from pydlm import dlm, trend, seasonality, dynamic, autoReg, longSeason
y=[1,2,3,4,5,6,7,8,9,10]
myDLM=dlm(np.array(y))
myDLM=myDLM+trend(1,discount=0.9)+seasonality(period=4)
myDLM.fit()
(temp_obser, temp_var)=myDLM.predict(date=9)
myDLM.ignore(2)
myTuner=modelTuner(method='gradient_descent',loss='mse')
bankDLM=myTuner.tune(myDLM, maxit=100)
tuned_discounts=myTuner.getDiscounts()
myDLM.fit()
TypeError: unsupported operand type(s) for -: 'NoneType' and 'float'
If we comment 'myDLM.ignore(2)', then the codes will run successfully. I wonder whether tune method can't accept missing data?
Another question, where is it appropriate to place myDLM.ignore(2), before myDLM.fit()
or after myDLM.fit()?To be on the safe side, i add fit both before and after myDLM.ignore(2). thanks.
Hey, I'm experimenting with a timeseries that has hourly resolution with both daily and weekly seasonality, in addition to a slowly varying linear trend. I've been running into errors — LinAlgError: SVD did not converge — and am wondering if using a "long-seasonality" component for the weekly would be better and/or address the numerical issue. However, based on the docs, I'm having a hard time figuring out how to specify such a longSeason component.
I think including a full example in the docs would be hugely helpful! Or, if you could sketch out the expected code here, I might be able to put together a documentation example myself. Thanks in advance for your help!
In the file basemodle.py, the defined variable evalution and evaluation are appeared alternately, which make me confused. I am wondering whether it is a typo in your code.
It's clear for me why .fit() time complexity (execution time) depends on time series length. Probably O(N^2). But why it's true for predictN(n=1) as I found out ? It looks like dependence is O(N^2)..O(N^3)
Thx
A declarative, efficient, and flexible JavaScript library for building user interfaces.
🖖 Vue.js is a progressive, incrementally-adoptable JavaScript framework for building UI on the web.
TypeScript is a superset of JavaScript that compiles to clean JavaScript output.
An Open Source Machine Learning Framework for Everyone
The Web framework for perfectionists with deadlines.
A PHP framework for web artisans
Bring data to life with SVG, Canvas and HTML. 📊📈🎉
JavaScript (JS) is a lightweight interpreted programming language with first-class functions.
Some thing interesting about web. New door for the world.
A server is a program made to process requests and deliver data to clients.
Machine learning is a way of modeling and interpreting data that allows a piece of software to respond intelligently.
Some thing interesting about visualization, use data art
Some thing interesting about game, make everyone happy.
We are working to build community through open source technology. NB: members must have two-factor auth.
Open source projects and samples from Microsoft.
Google ❤️ Open Source for everyone.
Alibaba Open Source for everyone
Data-Driven Documents codes.
China tencent open source team.