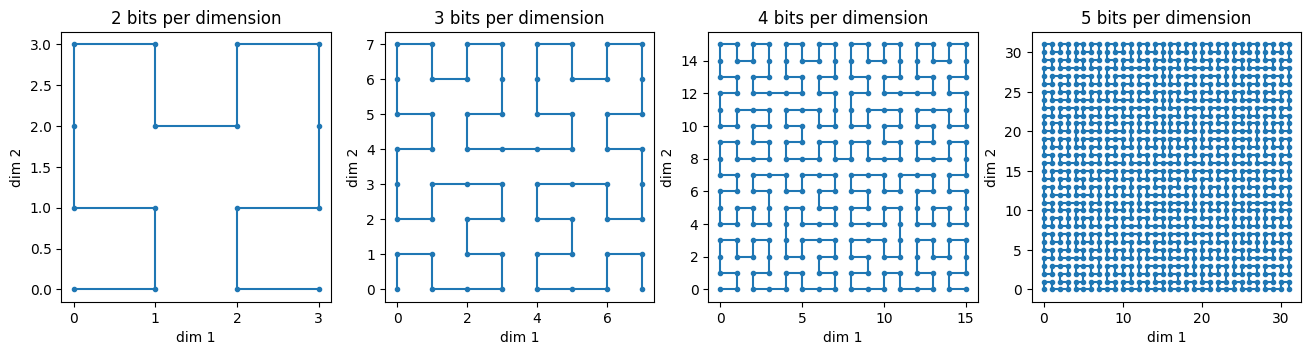
This is a numpy-based implementation of Hilbert curves, for up to a few tens of dimensions. A Hilbert curve is a continuous space-filling curve that lets you map from a single dimension into multiple dimensions. In two dimensions, you get curves that look like this:
In three dimensions, you get curves that look like this:
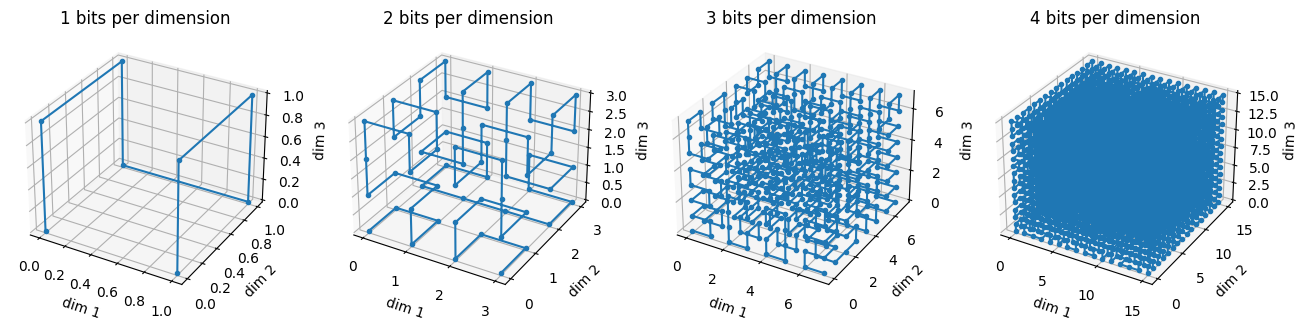
This is working entirely in terms of integers, so the size of the (hyper-) cube reflects the number of bits per dimension. You could normalize this to put it into the unit hypercube with floating point numbers.
The mechanics of the implementation rely on the Gray-code "correction" procedure presented in
Skilling, J. (2004, April). Programming the Hilbert curve. In AIP Conference Proceedings (Vol. 707, No. 1, pp. 381-387). American Institute of Physics.
This paper does a lot of bit twiddling in C. I replicate this with "bool-twiddling" in numpy, but of course numpy represents a bool value with 8 bits, so don't expect it to really have the same performance as the equivalent C code. However, my goal here (rather than write it in Cython) was to make it easy to integrate with code you're already writing in Python with numpy.
You can install this via PyPI:
$ pip install numpy-hilbert-curve
The basic usage looks like this:
import numpy as np
from hilbert import decode, encode

# Turn an ndarray of Hilber integers into locations.
# 2 is the number of dimensions, 3 is the number of bits per dimension
locs = decode(np.array([1,2,3]), 2, 3)

print(locs)
# prints [[0 1]
#         [1 1]
#         [1 0]]

# You can go the other way also, of course.
H = encode(locs, 2, 3)

print(H)
# prints array([1, 2, 3], dtype=uint64)
The reason things like Hilbert curves are interesting is because they preserve some amount of locality. In this figure, I'm gradually changing the color in the Hilbert integers, using the "copper" colormap:

In this picture, I'm doing the same thing in 3d: