This is the skeleton code for the Fall 2022 ECE408 / CS483 course project.
In this final project, you will be implementing and optimizing the forward-pass of a convolutional layer using CUDA. Convolutional layers are the primary building blocks of convolutional neural networks (CNNs), which are used in many machine learning tasks like image classification, object detection, natural language processing, and recommendation systems. In general, CNNs work well on tasks where the data/input features have some level of spatial relationship.
You will be working with a modified version of the LeNet-5 architecture shown below.
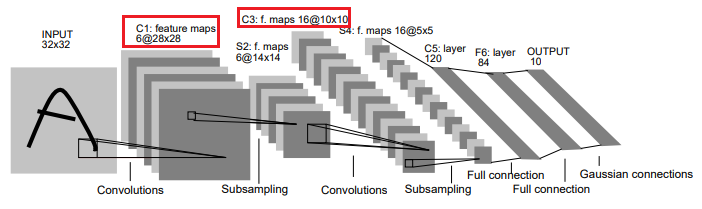
Source: http://yann.lecun.com/exdb/publis/pdf/lecun-01a.pdf
Your optimized CUDA implementation of the convolutional layer will be used to perform inference for layers C1 and C3 (shown in red) in the figure above. We will be leveraging the mini-dnn-cpp (Mini-DNN) framework for implementing the modified LeNet-5.
We will be using the Fashion MNIST dataset, where the inputs to the network will be a batch of 10,000 single channel images, each with dimensions of 86 x 86 pixels. The output layer consists of 10 nodes, where each node represents the likelihood of the input belonging to one of the 10 classes (T-shirt, dress, sneaker, boot etc.)
The overall learning objectives for this project are:
- Demonstrating command of CUDA and optimization approaches by designing and implementing an optimized neural-network convolutional layer forward pass
- Obtaining practical experience in analyzing and fine tuning CUDA kernels through the use of profiling tools like Nsight Systems (
nsys) and Nsight-Compute (nv-nsight-cu)
You will be working on this project individually. We will release the code for project milestones one at a time.
You are expected to adhere to University of Illinois academic integrity standards. Do not attempt to subvert any of the performance-measurement aspects of the final project. If you are unsure about whether something does not meet those guidelines, ask a member of the teaching staff.
- Milestone 1: Rai Installation, CPU Convolution, Profiling
- Milestone 2: Baseline Convolutional Kernel
- Milestone 3: GPU Convolution Kernel Optimizations
- Optimizations
- Rubric
- Final Competition
- Appendix
Deadline: 8 PM, Oct. 14, 2022
For each milestone, you will also need to complete a report on Canvas. The table below contains all of the deliverables.
| Deliverables |
|---|
| Create a CPU convolution implementation |
Profile your implementation with gprof |
| Complete your report on Canvas: https://canvas.illinois.edu/courses/30068/quizzes/250868 |
Use rai -p <project folder> --submit=m1 to mark your job for grading |
Run the default Mini-DNN forward pass using rai without any CPU/GPU implementation.
Use RAI to run a batch forward pass on some test data.
rai -p <project-folder>
This will upload your project directory to rai and move it to /src, where the execution specified in rai_build.yml will occur.
Understanding rai_build.yml
The image: key specifies the environment that the rest of the execution will occur in.
This environment includes the Mini-DNN framework as well as the model definition and pre-trained weights that will be used to do inference. (Do not modify this entry)
The resources: key specifies what computation resources will be available to the execution. (Do not modify this entry)
The commands: key specifies the recipe that rai will execute. First, the project files are copied to the /build/student_code directory so that we have a record of your code along with your performance.
Then the files in custom are copied to /ece408/project/src/layer/custom in the Mini-DNN source tree and the pretrained weights are copied to /build. Finally, Mini-DNN is recompiled with your custom code.
./m1 100 runs the code specified in m1.cc program for a batch of 100 input images.
You should see the following output:
✱ Running /bin/bash -c "./m1 100"
Test batch size: 100
Loading fashion-mnist data...Done
Loading model...Done
Conv-CPU==
Op Time: 0.000655 ms
Conv-CPU==
Op Time: 0.000246 ms
Test Accuracy: 0.08
It is okay for the accuracy is low here since you haven't implemented the convolutional layers yet.
Modify rai_build.yml to use time to measure the elapsed time of the whole program.
- /bin/bash -c "time ./m1 100"
See the description of the skeleton code for a brief overview of what each file does.
Modify custom/cpu-new-forward.cc to implement the forward convolution described in Chapter 16 of the textbook.
The performance of the CPU convolution is not part of the project evaluation. We only evaluate for correctness.
The algorithm is also below, for your convenience
for b = 0 .. Batch                     // for each image in the batch
    for m = 0 .. Map_out               // for each output feature maps
        for h = 0 .. Height_out        // for each output element
            for w = 0 .. Width_out
            {
                output[b][m][h][w] = 0;
                for c = 0 .. Channel   // sum over all input feature maps
                    for p = 0 .. K // KxK filter
                        for q = 0 .. K
                            output[b][m][h][w] += input[b][c][h + p][w + q] * k[m][c][p][q]
            }
Unlike the convolutions described in the class, note that this one is not centered on the input image. There is no padding and the strides are 1. The following illustration may help you visualize this better.
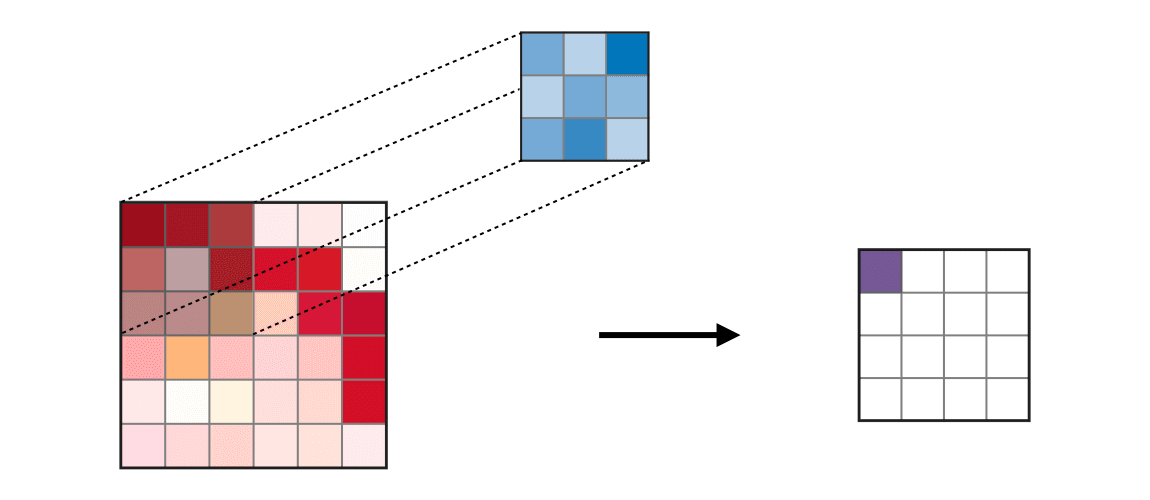
Source: https://stanford.edu/~shervine/teaching/cs-230/cheatsheet-convolutional-neural-networks#layer
Modify rai_build.yml to invoke
- /bin/bash -c "./m1"
Please be patient as the CPU implementation is slow and will take several minutes to run. (For instance, a correct implementation with 10k images may take 13+ mins to run). If you want to iterate quickly when developing code using smaller batch sizes, see Specifying Batch Size. When your implementation is correct, you should see output like this:
Test batch size: 1000
Loading fashion-mnist data...Done
Loading model...Done
Conv-CPU==
Op Time: 7425.3 ms
Conv-CPU==
Op Time: 21371.4 ms
Test Accuracy: 0.886
Every time your layer is invoked, it will print the "Op Time," the time spent working on that layer.
Since the network has two convolutional layers, two times will be printed.
You can time the whole program execution by modifying rai_build.yml with
- /bin/bash -c "time ./m1"
./m1, ./m2, ./m3 and ./final all take one optional argument: the dataset size.
If the correctness for each possible batch size is as below, you can be reasonably confident your implementation is right. The correctness does depend on the data size.
For example, to check your accuracy on the full data size of 10,000, you could modify rai_build.yml to run
- /bin/bash -c "./m1 10000"
| Number of Images | Accuracy |
|---|---|
| 100 | 0.86 |
| 1000 | 0.886 |
| 10000 | 0.8714 |
Note: Due to the limited capacity of our RAI servers, in order to ensure RAI job submissions take a reasonable amount of time, we are only requiring you to run and profile your CPU implementation with a batch size of 1000 images for this milestone.
You will use gprof to profile the execution of your CPU forward convolution implementation.
We compile and link your cpu-new-forward.cc with the -pg flag, which creates a gmon.out artifact containing profile information when the binary m1 is executed. To analyze this information in human readable form, modify rai_build.yml and modify the line to redirect gprof output as outfile.
- /bin/bash -c "./m1 1000 && gprof -Q m1 gmon.out > outfile"
By default, gprof prints both a flat profile and a call graph (see "Interpreting gprof's Output" in the GNU gprof Documentation). With the -Q flag, we only print the flat profile. The information you need can be found near the beginning of gprof's output. You can download your build folder and process the output outfile with grep (with your function's name) or head. You can also open it with text editor if you want to examine the complete output.
The provided m1.cc is identical to the one used by --submit=m1.
| Report Questions |
|---|
| Show output of rai running Mini-DNN on the CPU (CPU convolution implemented) for batch size of 1k images |
| List Op Times (CPU convolution implemented) for batch size of 1k images |
| List whole program execution time (CPU convolution implemented) for batch size of 1k images |
Show percentage of total execution time of your program spent in your forward pass function with gprof |
Use
rai -p <project folder> --submit=m1
to mark your submission for grading. Make sure to complete your report on Canvas (https://canvas.illinois.edu/courses/30068/quizzes/250868). Make sure you include all items listed above for this milestone.
Deadline: 8 PM, Nov. 4, 2022
| Deliverables |
|---|
| Everything from Milestone 1 |
| Implement a basic GPU Convolution kernel from Lecture 12 |
| Correctness and timing with 3 different dataset sizes |
| Complete your report on Canvas: https://canvas.illinois.edu/courses/30068/quizzes/251854 |
Use rai -p <project folder> --submit=m2 to mark your job for grading |
Modify custom/new-forward.cu to create GPU implementation of the forward convolution. In your template, the host code is separated in 3 parts. conv_forward_gpu_prolog allocates memory and copies data from host to device (Note: the device pointers given to you in this function are double pointers). conv_forward_gpu computes kernel dimensions and invokes kernel. conv_forward_gpu_epilog copies output back to host and free the device memory. You should implement your kernel code from Lecture 12 in conv_forward_kernel.
Modify rai_build.yml to run with batch_size=10000. Run
- /bin/bash -c "./m2"
to use your GPU implementation.
If your implementation is correct, it will show the same correctness as Milestone 1.
The sum of OP times on batch_size=10000 should be approximately 170ms if you implement the basic kernel from Lecture 12 correctly. You must have correct accuracies and total OP time less than 340ms to earn full credits on the coding part. To quicken development time, m2.cc takes one optional argument: the dataset size. See Specifying Batch Size.
Before you do any profiling, make sure your implementation achieves desired accuracy. Also make sure you do not have any memory errors by running cuda-memcheck. See Checking for Errors on how to run this.
To ensure accurate profiling results, we have created an exclusive queue for you. To submit profiling job on the exclusive queue, run:
rai --queue rai_amd64_exclusive -p <project-folder>
Please only use the exclusive queue for the profiling purpose. Use the default queue to test your code.
Since profiling takes a while, the exclusive queue may get backed up when the deadline approaches. So we encourage you to start early on this Milestone. You can query the number of pending jobs on the exclusive queue by the following command:
rai -p . --queue=rai_amd64_exclusive queued
System level profiling using Nsight-Systems
We will learn how to use nsys (Nsight Systems) to profile the execution at the application level.
Once you've gotten the appropriate accuracy results, generate a profile using nsys. Make sure rai_build.yml is configured for a GPU run.
You have to remove -DCMAKE_CXX_FLAGS=-pg in cmake and make line of your rai_build.yml:
- /bin/bash -c "cmake /ece408/project/ && make -j8"
Then, modify rai_build.yml to generate a profile instead of just executing the code.
- /bin/bash -c "nsys profile --stats=true ./m2"
You should see something that looks like the following (but not identical):
Collecting data...
Test batch size: 10000
Loading fashion-mnist data...Done
Loading model...Done
...
Generating CUDA API Statistics...
CUDA API Statistics (nanoseconds)

Time(%)  Total Time  Calls      Average   Minimum    Maximum  Name
-------  ----------  -----  -----------  --------  ---------  ----------------
   72.3   294859478      2  147429739.0    675112  294184366  cudaMalloc
   22.8    92865680      2   46432840.0  44841150   48024530  cudaMemcpy
    4.5    18405301      2    9202650.5     25789   18379512  cudaLaunchKernel
    0.4     1467989      2     733994.5    473054     994935  cudaFree
Generating CUDA Kernel Statistics...

Generating CUDA Memory Operation Statistics...
CUDA Kernel Statistics (nanoseconds)

Time(%)  Total Time   Instances  Average  Minimum    Maximum  Name
-------  ----------  ----------  -------  -------  ---------  --------------------
  100.0        3360           2   1680.0     1664       1696  conv_forward_kernel


CUDA Memory Operation Statistics (nanoseconds)

Time(%)  Total Time  Operations     Average   Minimum   Maximum  Name
-------  ----------  ----------  ----------  --------  --------  ------------------
  100.0    89602913           2  44801456.5  41565528  48037385  [CUDA memcpy HtoD]


CUDA Memory Operation Statistics (KiB)

   Total  Operations   Average     Minimum   Maximum  Name
--------  ----------  --------  ----------  --------  ------------------
538906.0           2  269453.0  250000.000  288906.0  [CUDA memcpy HtoD]
The CUDA API Statistics section shows the CUDA API calls that are executed. The CUDA Kernel Statistics lists all the kernels that were executed during the profiling session. There are also more details on the CUDA memory operations (CudaMemcpy) listed.
There are columns corresponding to percentage of time consumed, total time, number of calls, and average/min/max time of those calls. Use your nsys profiling output corresponding to the section above to answer the questions for your report.
Think about the distinction between a CUDA API call and a kernel launch, and describe it briefly in your report. The CUDA documentation describes kernels and the programming interface.
You can find more information about nsys in the Nsight Systems Documentation
Kernel level profiling using Nsight-Compute
Nsight-Systems does not give you detailed kernel level performance metrics. For that, we will need to use nv-nsight-cu-cli (Nsight-Compute).
Modify rai_build.yml to use nv-nsight-cu-cli to save some timeline and analysis information, as described in profiling.
Use the NVIDIA Nsight Compute GUI to find the execution of your kernel, and show a screen shot of the GPU SOL utilization in your report. You will see performance metrics for two kernel launches, one for each layer.
The Nsight Compute installation section describes how to install Nsight-Compute GUI on your personal machine. Note that you do not need CUDA to be installed.
| Report |
|---|
| Show output of rai running your GPU implementation of convolution (including the OpTimes) |
Demonstrate nsys profiling the GPU execution |
Include a list of all kernels that cumulatively consume more than 90% of the program time (listing from the top of your nsys results until the cumulative Time is greater than 90%) |
| Include a list of all CUDA API calls that cumulatively consume more than 90% of the program time |
| Include an explanation of the difference between kernels and API calls |
| Screenshot of the GPU SOL utilization in Nsight-Compute GUI for your kernel profiling data (for the first kernel launch of the two convolution kernels). On the upper right corner, you have a drop-down option "Save as image". The default selection is "Copy as image". Use this image as your screenshot. |
Use
rai -p <project folder> --submit=m2
to mark your submission for grading. Make sure to complete your report on Canvas (https://canvas.illinois.edu/courses/30068/quizzes/251854). Double check you include all items listed in the Deliverables for this milestone.
Deadline: December 2nd, 8 PM CST
| Deliverables |
|---|
| Implement multiple GPU optimizations |
| Write your report and upload PDF to Canvas: https://canvas.illinois.edu/courses/30068/quizzes/253930 |
Use rai -p <project folder> --submit=m3 to mark your job for grading |
You should attempt to implement at least 10 points of GPU optimizations (as seen in optimizations). You can implement these optimizations separately from each other or stack each optimization in order to maximize performance. If you implement your optimization separately, you must still include the code for each optimization in your submission even if it is unused in the final result. In this case it is recommended to create different methods and kernels to clarify what sections of the code apply to each optimization.
You must also make sure to clarify which baseline is used when analyzing the performance for a new optimization. If you are analyzing a result with a single optimization implemented, you should compare against your basic convolution kernel in Milestone 2. If you begin to stack multiple optimizations, for each optimization you add should be compared against the previous version without said optimization. This way you can most efficently analyse the effects of adding the given optimization.
It is fine if an optimization is not improving the performance against the baseline,
but you have to provide your implementation in your code and sufficient profiling results in your report. Also please remember when profiling your optimizations to use the --queue rai_amd64_exclusive flag to run your code on the exclusive server so that it doesn't contest with other students submissions and you can have the most accurate timing results.
Part of the grade for this milestone is whether or not you can achieve a reasonable overall performance, which we will measure as the sum of the first and second layer OP Times. If you have done milestone 2 correctly, for a batch size of 10000, the sum between the first and second layer OP Times (on the exclusive queue) should equal about 170ms. If this is not the case, you may want to examine your milestone 2 code. In order to achieve full credit for the performace grade this milestone, we ask that you bring the sum of the first and second layer OP Times down to 70ms or less for a batch size of 10000. Any submissions between 70ms and 170ms will be given a performance grade linearly extrapolated from the performance relative to these two values. Any submission slower than 170ms will recieve no credit for the performance grade.
If you have correctly implemented 10 points of optimizations, additional optimization points will count towards extra credits. Each additional optimization point worths 2.5%. You can earn 5% maximum towards your project grade. Make sure you implement 10 optimization points for this milestone first before considering extra credits. If you implement some optimizations incorrectly, we will consider extra points as part of your PM3 until you have 10 correct optimization points, since each point worths 4% in PM3.
You will see two types of times reported per layer as follows
✱ Running bash -c "./m3 1000"   \\ Output will appear after run is complete.
Test batch size: 1000
Loading fashion-mnist data...Done
Loading model...Done
Conv-GPU==
Layer Time: 61.1231 ms
Op Time: 4.82135 ms
Conv-GPU==
Layer Time: 55.4437 ms
Op Time: 16.6154 ms

Test Accuracy: 0.886
- "Op Time" - This is time between the last cudaMemcpy call before your first kernel call and the first cudaMemcpy after your last kernel call (i.e. just
new-forward.cu -> conv_forward_gpu()). It does not include the cudaMemcpy times. - "Layer Time" - This is the total time taken to perform the convolution layer (C1 or C3). It includes the times for all kernel and CUDA API calls (i.e. the total time of all three
new-forward.cu -> conv_forward_gpu*functions).
Use the NVIDIA Nsight-Systems(nsys) and Nsight-Compute(nv-nsight-cu-cli) and your analysis information to describe the effect that your optimizations had on the performance of your convolution.
If possible, you should try to separate the effect of each optimization in your analysis.
For this milestone, edit the responses in the given m3_report_template.docx file, export the report as a PDF, and name the PDF as report.pdf. Describe in detail each optimization you implement, including how and why you choose to implement that specific optimization, why you thought the optimization may be fruitful, the actual results of the optimization and whether it was fruitful (use quantitative data from nsys and nv-nsight-cu to justify your explanation), and include any external references used during identification or development of the optimization.
| Report |
|---|
| Describe the optimizations as specified |
Use data from nsys and/or nv-nsight-cu-cli to analyze your optimizations and justify the effects of your optimizations |
Use m3_report_template.docx to complete your report |
Use
rai -p <project folder> --submit=m3
to submit your project folder. Make sure to upload your report.pdf on Canvas: https://canvas.illinois.edu/courses/30068/quizzes/253930. Make sure you answer all items listed above for this milestone, and include your name, NetID, and class section.
These are the list of optimizations we will consider valid for Milestone 3. You should implement 10 points worth of optimizations in order to recieve full credit for Milestone 3. If you would like to impelement a potential optimization that is not on this list, please consult a TA or instructor beforehand to verify that the optimization is valid and to assign it a point value.
- Tiled shared memory convolution (2 points)
- Shared memory matrix multiplication and input matrix unrolling (3 points)
- Kernel fusion for unrolling and matrix-multiplication (requires previous optimization) (2 points)
- Weight matrix (kernel values) in constant memory (1 point)
- Tuning with restrict and loop unrolling (considered as one optimization only if you do both) (3 points)
- Sweeping various parameters to find best values (block sizes, amount of thread coarsening) (1 point)
- Multiple kernel implementations for different layer sizes (1 point)
- Input channel reduction: tree (3 point)
- Input channel reduction: atomics (2 point)
- Fixed point (FP16) arithmetic. (note this can modify model accuracy slightly) (4 points)
- Using Streams to overlap computation with data transfer (4 points)
- An advanced matrix multiplication algorithm (register-tiled, for example) (5 points)
- Using Tensor Cores to speed up matrix multiplication (5 points)
- Overlap-Add method for FFT-based convolution (note this is very hard, and may not yield a large performace increase due to mask size) (8 points)
The overall project score will be computed as follows. We will release rubic details of later milestones based on the class schedule.
So please always do git pull to update the project instructions.
- Milestone 1 ( 20% )
- Correctness ( 15% )
- Report ( 5% )
- Milestone 2 ( 30% )
- Correctness ( 20% )
- Report( 10% )
- Milestone 3 ( 50% )
- Overall Performance ( 10% )
- Correctness ( 2% for each optimization point, 20% maximum )
- Report ( 2% for each optimization point, 20% maximum )
- Extra Credit ( up to +5% maximum, +2.5% per additional optimization point. You can have maximum 2 additional optimization points )
- Correctness ( 1.5% for each additional optimization point )
- Report ( 1% for each additional optimization point )
Deadline: December 9th, 8 PM CST
For the week after PM3 is due,
you can compete performance of your convolution kernel with other students.
We will award extra credits to top performers in this competition.
The metric used for this competition will be the sum of OP Times, and you can see the current standings using the rai -p <project_directory> ranking command. Note that the only submissions that will be counted towards the ranking are ones that run the network with a batch size of 10000 (no profiling). Using the --submit=m3 flag will also count the submission towards the rankings.
Since we want you to focus on kernel optimizations, host side optimizations like steams overlap will have little effect. The leaderboard is quite dynamic since it's updated upon each valid submission. We will finalize standing of each participant by taking average of mulitple runs. Note that it is also possible that some participants develop in private and submit their ranking in the last minute. So don't be suprised if you fall out of certain bracket in the end.
- Top 20 on leaderboard ( 1% towards final grade )
- Top 50 on leaderboard ( 0.6% towards final grade )
- Top 80 on leaderboard ( 0.2% towards final grade )
custom/cpu-new-forward.cc and custom/new-forward.cu containes skeleton implementations for the CPU and GPU convolutions respectively. You can complete the project by modifying these two files only. custom/cpu-new-forward.h and custom/gpu-new-forward.h are the respective header files. You need not modify these files unless you need to declare your own functions.
The code in m1.cc, m2.cc, m3.cc and final.cc are the top level files that are executed for each milestone. You should not be modifying these files.
Within custom/new-forward.cu, you can use the predefined error handling code to catch CUDA errors or, you can define a macro/function similar to wbCheck used in WebGPU.
To catch memory errors, prepend your command with cuda-memcheck.
Assume we want to check memory errors on Milestone3 binary,
in your rai_build.yml, run
- /bin/bash -c "cuda-memcheck ./m3"
You can gather system level performance information using nsys.
For detailed kernel level GPU profiling, use nv-nsight-cu-cli and view that information with nv-nsight-cu. To enable profiling with these tools,
you have to remove -DCMAKE_CXX_FLAGS=-pg in cmake and make line of your rai_build.yml:
- /bin/bash -c "cmake /ece408/project/ && make -j8"
You can see some simple information like so (as we did in milestone 2):
- /bin/bash -c "nsys profile --stats=true <your command here>"
You can additionally gather some detailed kernel level performance metrics.
- /bin/bash -c "nv-nsight-cu-cli --section '.*' -o analysis_file <your command here>"
This will generate analysis_file.ncu-rep.
--section '.*' may significantly slow the run time since it is profiling all the metrics. You may wish to modify the command to run on smaller datasets during this profiling.
You will need to follow the link rai prints after the execution to retrieve these files.
You can use the NVIDIA Nsight Compute GUI (nv-nsight-cu) to import those files.
You will need to install NVIDIA NSight Compute on your own machine. It can be downloaded as a standalone application. See instructions here
To import the files:
- Launch the GUI
/usr/local/NVIDIA-Nsight-Compute/nv-nsight-cu(or from wherever you installed it) - Close the intial Quick Launch menu
- Go to File > Open File and select the
.ncu-repfile from the\buildfolder you downloaded from rai (note that the downloaded file is aTARfile, not aTAR.GZas the name implies).
OR
- Directly launch from the terminal
/usr/local/NVIDIA-Nsight-Compute/nv-nsight-cu <filename>.ncu-rep
For a high-level overview of the Nsight software, visit here.
Nsight-Compute can be installed as a standalone application. You do not need CUDA to be installed. You can download the installer from NVIDIA's website
NCSA/UIUC © 2020 Carl Pearson
- Carl Pearson
- Vikram Mailthody
- Andrew Schuh
- Abdul Dakkak
- Zaid Qureshi
- Rui Lan
- Zhicun Wan
- Ben Schreiber
- James Cyriac
- Jonathan Nativ
