Giter Club home page Giter Club logo

aialpha's Introduction

AIAlpha: Multilayer neural network architecture for stock return prediction

forthebadge made-with-python

GitHub license PRs Welcome

This project is meant to be an advanced implementation of stacked neural networks to predict the return of stocks. My goal for the viewer is to understand the core principles that go behind the development of such a multilayer model and the nuances of training the individual components for optimal predictive ability. Once the core principles are understood, the various components of the model can be replaced with the state of the art models available at time of usage.

The workflow is similar to the approach in the excellent text Advances in Financial Machine Learning by Marcos Lopez de Prado, which I recommend to anyone who wants to learn about applying machine learning techniques to financial data. The data that was used for this project is not in the repository due to size constraints in GitHub, but the raw data was open sourced from Tick Data LLC, but now I believe is not available.

In essense, we will be making bars (tick, volume or dollar) based on the tick data, apply feature engineering, reduce the dimensions using an autoencoder and finally use a machine learing model to make predictions. I have implemented both a LSTM regression model and a Random Forest classification model to classify the direction of the move.

This model is not meant to be used to live trade without modifications. However, an extended version of this model can very well be profitable with the right strategies.

I truly hope you find this project informative and useful in developing your own trading strategies or machine learning models.

This project illustrates how to use machine learning to predict the future prices of stocks. In order to efficiently allocate the capital to those stocks, check out OptimalPortfolio

Disclaimer, this is purely an educational project. Any backtesting performance do not guarentee live trading results. Trade at your own risk. This is only a guide on the usage of the model. If you want to delve into the reasoning behind the model and the theory, please check out my blog: Engineer Quant

Contents

Overview

Those who have done some form of machine learning would know that the workflow follows this format: acquire data, preprocess, train, test, monitor model. However, given the complexity of this task, the workflow has been modified to the following:

  1. Acquire the tick data - this is the primary data for our model.
  2. Preprocess the data - we need to sample the data using some method. Subsequently, we make the train-test splits.
  3. Train the stacked autoencoder - this will give us our feature extractor.
  4. Process the data - this will give us the features of our model, along with train, test datasets.
  5. Use the neural network/random forest to learn from the training data.
  6. Test the model with the testing set - this gives us a gauge of how good our model is.

Now let me elaborate the various parts of the pipeline.

Quickstart

For those who just want to see the model work, run the following code (make sure you are on Python 3 to prevent any bugs or errors):

pip install -r requirements.txt
python run.py

Note: Due to GitHub file size restrictions, I have only uploaded part of the data (1 million rows), so the model results may vary from the one shown below.

Bar Sampling

Running machine learning algorithms, or any other statistical models, directly on tick level data often leads to poor results, due to the high level of noise caused by the bid-ask bounce, and the high nonlinearity in the nature of the data. Therefore, we need to sample the data at some interval (which can be decided depending on the frequency of the predictive model). The sampling that we are used to seeing is time sampled (we get bars every 1min), but this is known to exhibit non stationarities and the returns are not normally distributed. So, as explained in Advances in Financial Machine Learning, we are going to sample it according to the number of ticks, or the amount of volume or the amount of dollars traded. These bars show better statistical properties and are preferable for machine learning applications.

Feature Engineering

Given our OHLCV data from our sampling procedure, we can go ahead and create features that we feel might add information to the forecast. I have constructed a set of features that are based on moving averages and rolling volatilities of the various prices and volumes. This set of features can be extended accordingly.

Stacked Autoencoder

Given our features, we notice that the dimension of the dataset is huge (185 for my configuration). This can pose a lot of problems when we run machine learning algorithms due to the curse of dimensionality. However, we can attempt to overcome this by using neural networks that are able to decompress the data given into smaller number of neurons than the input number. When we train such a neural network, it becomes able to extract the 'important sections' of the data so to speak. Hence, this compressed version of the data can be considered as features. Although this method is useful, the downside is that we do not know what the various compressed data points mean and hence cannot extract methods to achieve them in differnt datasets.

Neural Network Model

Using neural networks for the prediction of time series has become widespread and the power of neural networks is well known. I have used a LSTM model for its memory property. However, an issue I faced with the training of the neural network model is that there was a tendency for the model to fit to a constant, as it turned out to be a local minima for the loss function. One way to overcome this is using different initialisations for the weights, and tuning the hyperparameters.

Random Forest Model

Sometimes, it might be better to use a simpler model as apposed to a sophisticated neural network. This is especially true when the amount of data available is not enough for deep models. Even though I used tick level data, the dataset was only around 5 million rows. After sampling, the number of rows drops and it is not enough for deep learning models to learn effectively from. So, I wanted to use a random forest classification model that classified the direction of the next bar.

Results

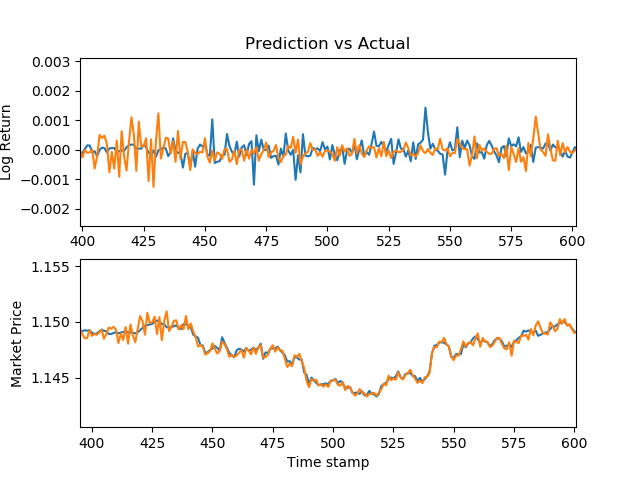
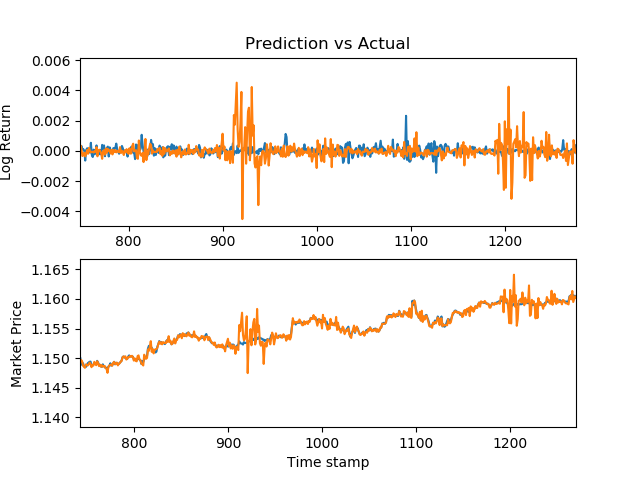
Using this stacked neural network model, I was able to achieve decent results. The following are graphs of my predictions vs the actual market prices for various securities.

EURUSD

alt text

EURUSD prices - R^2: 0.90

alt text

For the random forest classification model, the results were better. I used tick bars for this simulation.

The base case used is merely predicting no moves in the market. The out of sample results were:

Tick bars:
    Model log loss: 2.78
    Base log loss: 4.81

Volume bars:
    Model log loss: 1.69
    Base log loss: 5.06

Dollar bars:
    Model log loss: 2.56
    Base log loss: 2.94

It is also useful to understand how much of an impact the autoencoders made, so I ran the model without autoencoders and the results were:

Tick bars:
    Model log loss: 5.12
    Base log loss: 4.81

Volume bars:
    Model log loss: 3.25
    Base log loss: 5.06

Dollar bars:
    Model log loss: 3.62
    Base log loss: 2.94

Online Learning

The training normally stops after the model has trained on historic data and merely predicts future data. However, I believe that it might be a waste of data if the model does not also learn from the predictions. This is done by training the model on the new (prediction, actual) pairs to continually improve the model.

What's next?

The beauty of this model is the once the construction is understood, the individual models can be swapped out for the best model there is. So over time the actual models used here will be different but the core framework will still be the same. I am also working on improving the current model with ideas from Advanced in Financial Machine Learning, such as adding sample weights, cross-validation and ensemble techniques.

Contributing

I am always grateful for feedback and modifications that would help!

Hope you have enjoyed that! To see more content like this, please visit: Engineer Quant

aialpha's People

Contributors

andreybicalho avatar vivekpa avatar

Stargazers

 avatar  avatar  avatar  avatar  avatar  avatar  avatar  avatar  avatar  avatar  avatar  avatar  avatar  avatar  avatar  avatar  avatar  avatar  avatar  avatar  avatar  avatar  avatar  avatar  avatar  avatar  avatar  avatar  avatar  avatar  avatar  avatar  avatar  avatar  avatar  avatar  avatar  avatar  avatar  avatar  avatar  avatar  avatar  avatar  avatar  avatar  avatar  avatar  avatar  avatar  avatar  avatar  avatar  avatar  avatar  avatar  avatar  avatar  avatar  avatar  avatar  avatar  avatar  avatar  avatar  avatar  avatar  avatar  avatar  avatar  avatar  avatar  avatar  avatar  avatar  avatar  avatar  avatar  avatar  avatar  avatar  avatar  avatar  avatar  avatar  avatar  avatar  avatar  avatar  avatar  avatar  avatar  avatar  avatar  avatar  avatar  avatar  avatar  avatar  avatar

Watchers

 avatar  avatar  avatar  avatar  avatar  avatar  avatar  avatar  avatar  avatar  avatar  avatar  avatar  avatar  avatar  avatar  avatar  avatar  avatar  avatar  avatar  avatar  avatar  avatar  avatar  avatar  avatar  avatar  avatar  avatar  avatar  avatar  avatar  avatar  avatar  avatar  avatar  avatar  avatar  avatar  avatar  avatar  avatar  avatar  avatar  avatar  avatar  avatar  avatar  avatar  avatar  avatar  avatar  avatar  avatar  avatar  avatar  avatar  avatar  avatar  avatar  avatar  avatar  avatar  avatar  avatar  avatar  avatar  avatar  avatar  avatar  avatar  avatar  avatar  avatar  avatar  avatar  avatar  avatar  avatar  avatar  avatar  avatar  avatar  avatar  avatar  avatar  avatar  avatar  avatar  avatar  avatar  avatar  avatar  avatar  avatar  avatar  avatar  avatar  avatar

aialpha's Issues

Seems not working neural network

Model.py creates stock price:
stock_price = np.exp(np.reshape(prediction, (1,)))*stock_data_test[i]

Stock price (from testing list) always multiplied with same constant coming from prediction. That's why predicted stock graph always matches original values. Neural network predictor returning always same value for any time value.

Please fix the code.

requirements.txt file is missing

In the Readme, it is mentioned that one needs to do pip install -r requirements.txt, but the file is missing in the repository.

Yahoo data

I saw in your medium article you said you were using
stock_data = pdr.get_data_yahoo(self.ticker, self.start, self.end)
for data acquisition
yet in your sample data you had a time col which yahoo doesn't provide
is there a way can I use this for daily prices?
Thank you

FileNotFoundError

I'm having some issues, getting these errors:

C:\Windows\System32> C:\Users\kanzl\Downloads\AIAlpha-master\AIAlpha-master\run.py install
Using TensorFlow backend.
Creating tick bars...
Reading data in batches of 20000000
Traceback (most recent call last):
File "C:\Users\kanzl\Downloads\AIAlpha-master\AIAlpha-master\run.py", line 14, in
base.batch_run()
File "C:\Users\kanzl\Downloads\AIAlpha-master\AIAlpha-master\data_processor\base_bars.py", line 23, in batch_run
for batch in pd.read_csv(self.file_path, chunksize=self.batch_size, index_col=0):
File "C:\Users\kanzl\AppData\Local\Programs\Python\Python38\lib\site-packages\pandas\io\parsers.py", line 676, in parser_f
return _read(filepath_or_buffer, kwds)
File "C:\Users\kanzl\AppData\Local\Programs\Python\Python38\lib\site-packages\pandas\io\parsers.py", line 448, in _read
parser = TextFileReader(fp_or_buf, **kwds)
File "C:\Users\kanzl\AppData\Local\Programs\Python\Python38\lib\site-packages\pandas\io\parsers.py", line 880, in init
self._make_engine(self.engine)
File "C:\Users\kanzl\AppData\Local\Programs\Python\Python38\lib\site-packages\pandas\io\parsers.py", line 1114, in _make_engine
self._engine = CParserWrapper(self.f, **self.options)
File "C:\Users\kanzl\AppData\Local\Programs\Python\Python38\lib\site-packages\pandas\io\parsers.py", line 1891, in init
self._reader = parsers.TextReader(src, **kwds)
File "pandas_libs\parsers.pyx", line 374, in pandas._libs.parsers.TextReader.cinit
File "pandas_libs\parsers.pyx", line 674, in pandas._libs.parsers.TextReader._setup_parser_source
FileNotFoundError: [Errno 2] File sample_data/raw_data/price_vol.csv does not exist: 'sample_data/raw_data/price_vol.csv'

If you could help I would appreciate

What's the state of the project?

Hi, I really like some ideas of the project but when I look into the code, everything is deactivated and only reforest with minimax scaler is used.
Is the rest working that badly?

In your medium post, you present graphs with price and predicted price. Is there also an evaluation of a trading strategy with an equity curve?

Thank you very much for publishing your progress!

Best

CSV not found error?

Hi Champs:

I'm in the last miles to get it done.
May you guide me how to solve the CSV not found error?
Thanks.

BR Rio

rio@ubuntu:/opt/tensorflow/tensorflow/models/research$ python3 AIAlpha/run.py
Using TensorFlow backend.
Traceback (most recent call last):
File "AIAlpha/run.py", line 8, in
dataset, average, std = nnmodel(500, 0.01, 0.01)
File "/opt/tensorflow/tensorflow/models/research/AIAlpha/model_20_encoded.py", line 13, in nnmodel
train_data = np.array(pd.read_csv("60_return_forex/encoded_return_train_data.csv", index_col=0))
File "/usr/local/lib/python3.6/dist-packages/pandas/io/parsers.py", line 702, in parser_f
return _read(filepath_or_buffer, kwds)
File "/usr/local/lib/python3.6/dist-packages/pandas/io/parsers.py", line 429, in _read
parser = TextFileReader(filepath_or_buffer, **kwds)
File "/usr/local/lib/python3.6/dist-packages/pandas/io/parsers.py", line 895, in init
self._make_engine(self.engine)
File "/usr/local/lib/python3.6/dist-packages/pandas/io/parsers.py", line 1122, in _make_engine
self._engine = CParserWrapper(self.f, **self.options)
File "/usr/local/lib/python3.6/dist-packages/pandas/io/parsers.py", line 1853, in init
self._reader = parsers.TextReader(src, **kwds)
File "pandas/_libs/parsers.pyx", line 387, in pandas._libs.parsers.TextReader.cinit
File "pandas/_libs/parsers.pyx", line 705, in pandas._libs.parsers.TextReader._setup_parser_source
FileNotFoundError: [Errno 2] File b'60_return_forex/encoded_return_train_data.csv' does not exist: b'60_return_forex/encoded_return_train_data.csv'
rio@ubuntu:/opt/tensorflow/tensorflow/models/research$ find . -name "*data.csv"
./AIAlpha/60_return_forex/encoded_return_train_data.csv
./AIAlpha/60_return_forex/return_train_data.csv
./AIAlpha/60_return_forex/return_test_data.csv
./AIAlpha/60_return_forex/encoded_return_test_data.csv
./AIAlpha/features/autoencoded_corrected_data.csv
./AIAlpha/features/autoencoded_data.csv
./AIAlpha/features/autoencoded_train_data.csv
./AIAlpha/features/autoencoded_test_data.csv
./AIAlpha/preprocessing/test_data.csv
./AIAlpha/data_folder/train_data.csv
./AIAlpha/data_folder/training_data.csv
rio@ubuntu:/opt/tensorflow/tensorflow/models/research$

统计特征问题

您好,您在文中提到‘The sampling that we are used to seeing is time sampled (we get bars every 1min), but this is known to exhibit non stationarities and the returns are not normally distributed. So, as explained in Advances in Financial Machine Learning, we are going to sample it according to the number of ticks, or the amount of volume or the amount of dollars traded’,这段是否有文献支撑呢?我尝试了按number of ticks, or the amount of volume or the amount of dollars traded这几种方式进行sampling并画出统计图,但是并没有呈现出任何统计特征出来。

download() missing 1 required positional argument: 'tickers'

Traceback (most recent call last):
File "run.py", line 1, in
from get_data import GetData
File "/root/DeepMarket/Numerical/AIAlpha/get_data.py", line 3, in
fix.pdr_override()
TypeError: download() missing 1 required positional argument: 'tickers'

Why not consider Volume as input?

When I interviewed several professional traders, none of them would ignore the Volume information before making any decision. When they refer to a market signal, they will define it in both Price and Volume.

And if one is a high-frequent trader, Level 2 information is mandatory too.

So maybe you can add those to your model, hopefully that will increase the accuracy.

Some comments

Hi, Thanks for the very nice work! I am reading through your code and I am having problems understanding some of the steps taken. I'd suggest adding more comments in your code. Nonetheless, your explanations in the README are very useful!

In preprocessing.py: What do you mean with features split? Also, the sequence of steps in make_wavelet_train is not clear: why you used part of the original signal (macd = np.mean(x[5:] - np.mean(x))? And why you created the indicators.csv set?

You called your autoencoder a stacked autoencoder, while your approach does not construct the autoencoder model in a stacked manner: you do not train your layers in turns, but all 3 at once. Reference: http://ufldl.stanford.edu/wiki/index.php/Stacked_Autoencoders

Unsupported operand type(s) for /: 'str' and 'float'

Hi,

I cloned the repo, installed the required packages in a new conda environment and runned run.py without any changes to the code.

Getting an error in data_processing line 18; "unsupported operand type(s) for /: 'str' and 'float'"

python version 3.6.9
conda 4.7.11
windows 10 professional

Evaluate the return prediction, not the price prediction

I only went through the readme. The aim stated there is to predict stock returns, so why evaluate the algorithm using stock prices?

Predicting prices with great accuracy is very easy: predict that tomorrow's price will be today's price. The prediction will be correct up to a few percents at most. But that's useless. The analysis in the readme file doesn't make it obvious that the model does better.

I would suggest computing the f1 score or the return-weighted accuracy of a classifier predicting the sign of the returns.

Run fails on a clean freshly downloaded project

Hi,

First, thanks for posting this code.

The project has been downloaded as a zip file. At the beginning of the run it exits with an error about a missing dollar_bars.csv
Searching dollar_bars.csv finds 3 references. 2 in run.py/run_full.py sources, that immediately read it via some function, and fail. And 1 in bar_sample.py. But running bar_sample.py fails, since price_vol.csv is missing.

Searching price_vol.csv finds 3 read references from bar_sample.py itself, 1 read reference in test.py, and 1 write reference in test.py, BUT it relies on reading the file first. So no actual write references that create this file.

Hence, a dead end.
Is there a flow I am missing?
When you download it yourself to a clean directory (without the data already there), does it work as is at your end?

Again, thanks for your contribution.

let's connect for further improvment

"I am currently working on using Reinforcement Learning to make a trading agent that will learn the trading strategy to maximise the portfolio."
this line will drag me here. your article is really awesome sir. same time i am also working on reinforcement learning trading. can we connect...! for discussion and exchange ideas?

processed_data/price_bars/dollar_bars.csv missing

I downloaded the project from Git on 7/31/2019.
run.py has df = preprocess.make_features(file_path=f"sample_data/processed_data/price_bars/dollar_bars.csv", window=20,
csv_path="sample_data/processed_data/autoencoder_data", save_csv=True)
C:_AI\AIAlpha-master\sample_data\processed_data\price_bars only has test

can you help me?

New complementary tool

My name is Luis, I'm a big-data machine-learning developer, I'm a fan of your work, and I usually check your updates.

I was afraid that my savings would be eaten by inflation. I have created a powerful tool that based on past technical patterns (volatility, moving averages, statistics, trends, candlesticks, support and resistance, stock index indicators).
All the ones you know (RSI, MACD, STOCH, Bolinger Bands, SMA, DEMARK, Japanese candlesticks, ichimoku, fibonacci, williansR, balance of power, murrey math, etc) and more than 200 others.

The tool creates prediction models of correct trading points (buy signal and sell signal, every stock is good traded in time and direction).
For this I have used big data tools like pandas python, stock market libraries like: tablib, TAcharts ,pandas_ta... For data collection and calculation.
And powerful machine-learning libraries such as: Sklearn.RandomForest , Sklearn.GradientBoosting, XGBoost, Google TensorFlow and Google TensorFlow LSTM.

With the models trained with the selection of the best technical indicators, the tool is able to predict trading points (where to buy, where to sell) and send real-time alerts to Telegram or Mail. The points are calculated based on the learning of the correct trading points of the last 2 years (including the change to bear market after the rate hike).

I think it could be useful to you, to improve, I would like to give it to you, and if you are interested in improving and collaborating I am also willing, and if not I would like to file it in the drawer.

Missing directories and symbolic links

With a clean git clone of this, run.py errors out quickly because of path errors. It should be addressed internally but with this at the top of run.py, it will run

import os
aialpha_home=os.getcwd()
datadir = aialpha_home + '/data/processed_data'
os.makedirs(datadir, exist_ok=True)
os.chdir(datadir)
sampledata = aialpha_home + '/sample_data/'
if not os.path.exists('sample_data') :
os.symlink(sampledata, 'sample_data')

autoencodedata = aialpha_home + '/sample_data/processed_data/autoencoder_data'
if not os.path.exists('rf_data'):
os.symlink(autoencodedata, 'rf_data')

os.chdir(aialpha_home)

Recommend Projects

  • React photo React

    A declarative, efficient, and flexible JavaScript library for building user interfaces.

  • Vue.js photo Vue.js

    🖖 Vue.js is a progressive, incrementally-adoptable JavaScript framework for building UI on the web.

  • Typescript photo Typescript

    TypeScript is a superset of JavaScript that compiles to clean JavaScript output.

  • TensorFlow photo TensorFlow

    An Open Source Machine Learning Framework for Everyone

  • Django photo Django

    The Web framework for perfectionists with deadlines.

  • D3 photo D3

    Bring data to life with SVG, Canvas and HTML. 📊📈🎉

Recommend Topics

  • javascript

    JavaScript (JS) is a lightweight interpreted programming language with first-class functions.

  • web

    Some thing interesting about web. New door for the world.

  • server

    A server is a program made to process requests and deliver data to clients.

  • Machine learning

    Machine learning is a way of modeling and interpreting data that allows a piece of software to respond intelligently.

  • Game

    Some thing interesting about game, make everyone happy.

Recommend Org

  • Facebook photo Facebook

    We are working to build community through open source technology. NB: members must have two-factor auth.

  • Microsoft photo Microsoft

    Open source projects and samples from Microsoft.

  • Google photo Google

    Google ❤️ Open Source for everyone.

  • D3 photo D3

    Data-Driven Documents codes.