Giter Club home page Giter Club logo

vmind's Introduction

VMind

Not just automatic, but also fantastic.Open-source solution for intelligent visualization.

IntroductionDemoTutorialAPIOpenApi

npm Version npm Download PRs Welcome

license

English | 简体中文

Introduction

@visactor/vmind is an intelligent chart component based on LLM provided by VisActor, including dialog-based chart generation and editing capabilities. It provides a natural language interaction interface, allowing you to easily create chart narrative works with @visactor/VMind with just one sentence, and edit them through continuous dialogue, greatly improving your efficiency in creating data visualization works.

The main features of @visactor/vmind include:

  • Easy to use: Just provide the data you want to display and a sentence describing the information you want to display, and @visactor/vmind will automatically generate the chart for you. Based on the existing chart, describe the modifications you want to make to the chart in one sentence, and @visactor/VMind will help you achieve the desired effect.
  • Strong scalability: The components of @visactor/VMind can be easily extended and customized, and new functions and features can be added as needed. By default, the OpenAI GPT model is used, and you can easily replace it with any LLM service.
  • Easy narrative: Based on the powerful chart narrative ability of @visactor/vchart, @visactor/VMind supports the generation of various types of charts, including line charts, bar charts, pie charts, etc., and can also generate dynamic bar charts and other dynamic charts, making it easy for you to narrate data. More chart types are being added. You can also use the dialog-based editing function to easily modify chart styles and animation effects, making it easy for you to create narratives.
  • One-click export: @visactor/VMind comes with a chart export module, and you can export the created chart narrative as a video or GIF for display.

Development Guide

Docs Page

Enter the VMind repository and execute:

# Install dependencies
$ rush update
# Start the demo page
$ rush docs

Start the Development Page

Enter the VMind repository and execute:

# Install dependencies
$ rush update
# Start the VMind development page
$ rush vmind

You can start the vmind development page. You need to set your LLM service URL and API key to use it normally. You can modify the headers when calling the LLM in packages/vmind/__tests__/browser/src/pages/DataInput.tsx. You can create a new .env.local file in the packages/vmind folder and write in it:

VITE_SKYLARK_URL="Your service url of skylark model"
VITE_GPT_URL="Your service url of gpt model"
VITE_SKYLARK_KEY="Your api-key of skylark model"
VITE_GPT_KEY="Your api-key of gpt model"
VITE_PROXY_CONFIG="Your Vite proxy config for forwarding requests. Must be in JSON string format and is optional. Example: {"proxy": {"/v1": {"target": "https://api.openai.com/","changeOrigin": true},"/openapi": {"target": "https://api.openai.com/","changeOrigin": true}}}"

These configurations will be automatically loaded when starting the development environment.

Project Structure

  • __tests__: Playground for development
  • src/common: Common data processing, chart recommendation methods, chart generation pipelines
  • src/gpt: Code related to gpt intelligent chart generation
  • src/skylark: Code related to skylark intelligent chart generation
  • src/chart-to-video: Code related to exporting videos, GIFs

Instructions for use

📦 Installation

# npm
$ npm install @visactor/vmind

# yarn
$ yarn add @visactor/vmind

📊 Usage Example

Intelligent Chart Generation

First, we need to install VMind in the project:

# Install with npm

npm install @visactor/vmind

# Install with yarn

yarn add @visactor/vmind

Next, import VMind at the top of the JavaScript file

import VMind from '@visactor/vmind';

VMind currently supports OpenAI GPT-3.5, GPT-4 models and skylark-pro series models. Users can specify the model type to be called when initializing the VMind object, and pass in the URL of the LLM service. Next, we initialize a VMind instance and pass in the model type and model url:

import { Model } from '@visactor/vmind';

const vmind = new VMind({
  url: LLM_SERVICE_URL, //URL of the LLM service
  model: Model.SKYLARK, //Currently supports gpt-3.5, gpt-4, skylark pro models. The specified model will be called in subsequent chart generation
  headers: {
    'api-key': LLM_API_KEY
  } //headers will be used directly as the request header in the LLM request. You can put the model api key in the header
});

Here is a list of supported models:

//models that VMind support
//more models are under development
export enum Model {
  GPT3_5 = 'gpt-3.5-turbo',
  GPT4 = 'gpt-4',
  SKYLARK = 'skylark-pro',
  SKYLARK2 = 'skylark2-pro-4k'
}

VMind supports datasets in both CSV and JSON formats.

To use CSV data in subsequent processes, you need to call the data processing method to extract field information and convert it into a structured dataset. VMind provides a rule-based method parseCSVData to obtain field information:

// Pass in the CSV string to obtain the fieldInfo and the JSON-structured dataset
const { fieldInfo, dataset } = vmind.parseCSVData(csv);

We can also call the getFieldInfo method to obtain the fieldInfo by passing in a JSON-formatted dataset:

// Pass in a JSON-formatted dataset to obtain the fieldInfo
const dataset=[
{
"Product name": "Coke",
"region": "south",
"Sales": 2350
},
{
"Product name": "Coke",
"region": "east",
"Sales": 1027
},
{
"Product name": "Coke",
"region": "west",
"Sales": 1027
},
{
"Product name": "Coke",
"region": "north",
"Sales": 1027
}
]
const fieldInfo = vmind.getFieldInfo(dataset);

We want to show "the changes in sales rankings of various car brands". Call the generateChart method and pass the data and display content description directly to VMind:

const userPrompt = 'show me the changes in sales rankings of various car brand';
//Call the chart generation interface to get spec and chart animation duration
const { spec, time } = await vmind.generateChart(userPrompt, fieldInfo, dataset);

In this way, we get the VChart spec of the corresponding dynamic chart. We can render the chart based on this spec:

import VChart from '@visactor/vchart';

<body>
<!-- Prepare a DOM with size (width and height) for vchart, of course you can also specify it in the spec configuration -->
<div id="chart" style="width: 600px;height:400px;"></div>
</body>

// Create a vchart instance
const vchart = new VChart(spec, { dom: 'chart' });
// Draw
vchart.renderAsync();

Thanks to the capabilities of the large language model, users can describe more requirements in natural language and "customize" dishes. Users can specify different theme styles (currently only gpt chart generation supports this feature). For example, users can specify to generate a tech-style chart:

//userPrompt can be in both Chinese and English
//Specify to generate a tech-style chart
const userPrompt = 'show me the changes in sales rankings of various car brand,tech style';
const { spec, time } = await vmind.generateChart(userPrompt, fieldInfo, dataset);

You can also specify the chart type, field mapping, etc. supported by VMind. For example:

//Specify to generate a line chart, with car manufacturers as the x-axis
const userPrompt =
  'show me the changes in sales rankings of various car brands,tech style.Using a line chart, Manufacturer makes the x-axis';
const { spec, time } = await vmind.generateChart(userPrompt, fieldInfo, dataset);

Customizing LLM Request Method

Pass parameters when initializing the VMind object:

import VMind from '@visactor/vmind';
const vmind = new VMind(openAIKey:string, params:{
url?: string;//URL of the LLM service
/** gpt request header, which has higher priority */
headers?: Record<string, string> ;//request headers
method?: string;//request method POST GET
model?: string;//model name
max_tokens?: number;
temperature?: number;//recommended to set to 0
})

Specify your LLM service url in url (default is https://api.openai.com/v1/chat/completions) In subsequent calls, VMind will use the parameters in params to request the LLM service url.

Data Aggregation

📢 Note: The data aggregation function only supports GPT series models, more models will come soon.

When using the chart library to draw bar charts, line charts, etc., if the data is not aggregated, it will affect the visualization effect. At the same time, because no filtering and sorting of fields has been done, some visualization intentions cannot be met, for example: show me the top 10 departments with the most cost, show me the sales of various products in the north, etc.

VMind supports intelligent data aggregation since version 1.2.2. This function uses the data input by the user as a data table, uses a LLM to generate SQL queries according to the user's command, queries data from the data table, and uses GROUP BY and SQL aggregation methods to group, aggregate, sort, and filter data. Supported SQL statements include: SELECT, GROUP BY, WHERE, HAVING, ORDER BY, LIMIT. Supported aggregation methods are: MAX(), MIN(), SUM(), COUNT(), AVG(). Complex SQL operations such as subqueries, JOIN, and conditional statements are not supported.

Use the dataQuery function of the VMind object to aggregate data. This method has three parameters:

  • userInput: user input. You can use the same input as generateChart
  • fieldInfo: Dataset field information. The same as generateChart, it can be obtained by parseCSVData, or built by the user.
  • dataset: Dataset. The same as generateChart, it can be obtained by parseCSVData, or built by the user.
const { fieldInfo, dataset } = await vmind?.dataQuery(userInput, fieldInfo, dataset);

The fieldInfo and dataset returned by this method are the field information and dataset after data aggregation, which can be used for chart generation. By default, the generateChart function will perform a data aggregation using the same user input before generating the chart. You can disable data aggregation by passing in the fourth parameter:

const userInput = 'show me the changes in sales rankings of various car brand';
const { spec, time } = await vmind.generateChart(userInput, fieldInfo, dataset, false); //pass false as the forth parameter to disable data aggregation before generating a chart.

Dialog-based editing

Under development, stay tuned

Effect display

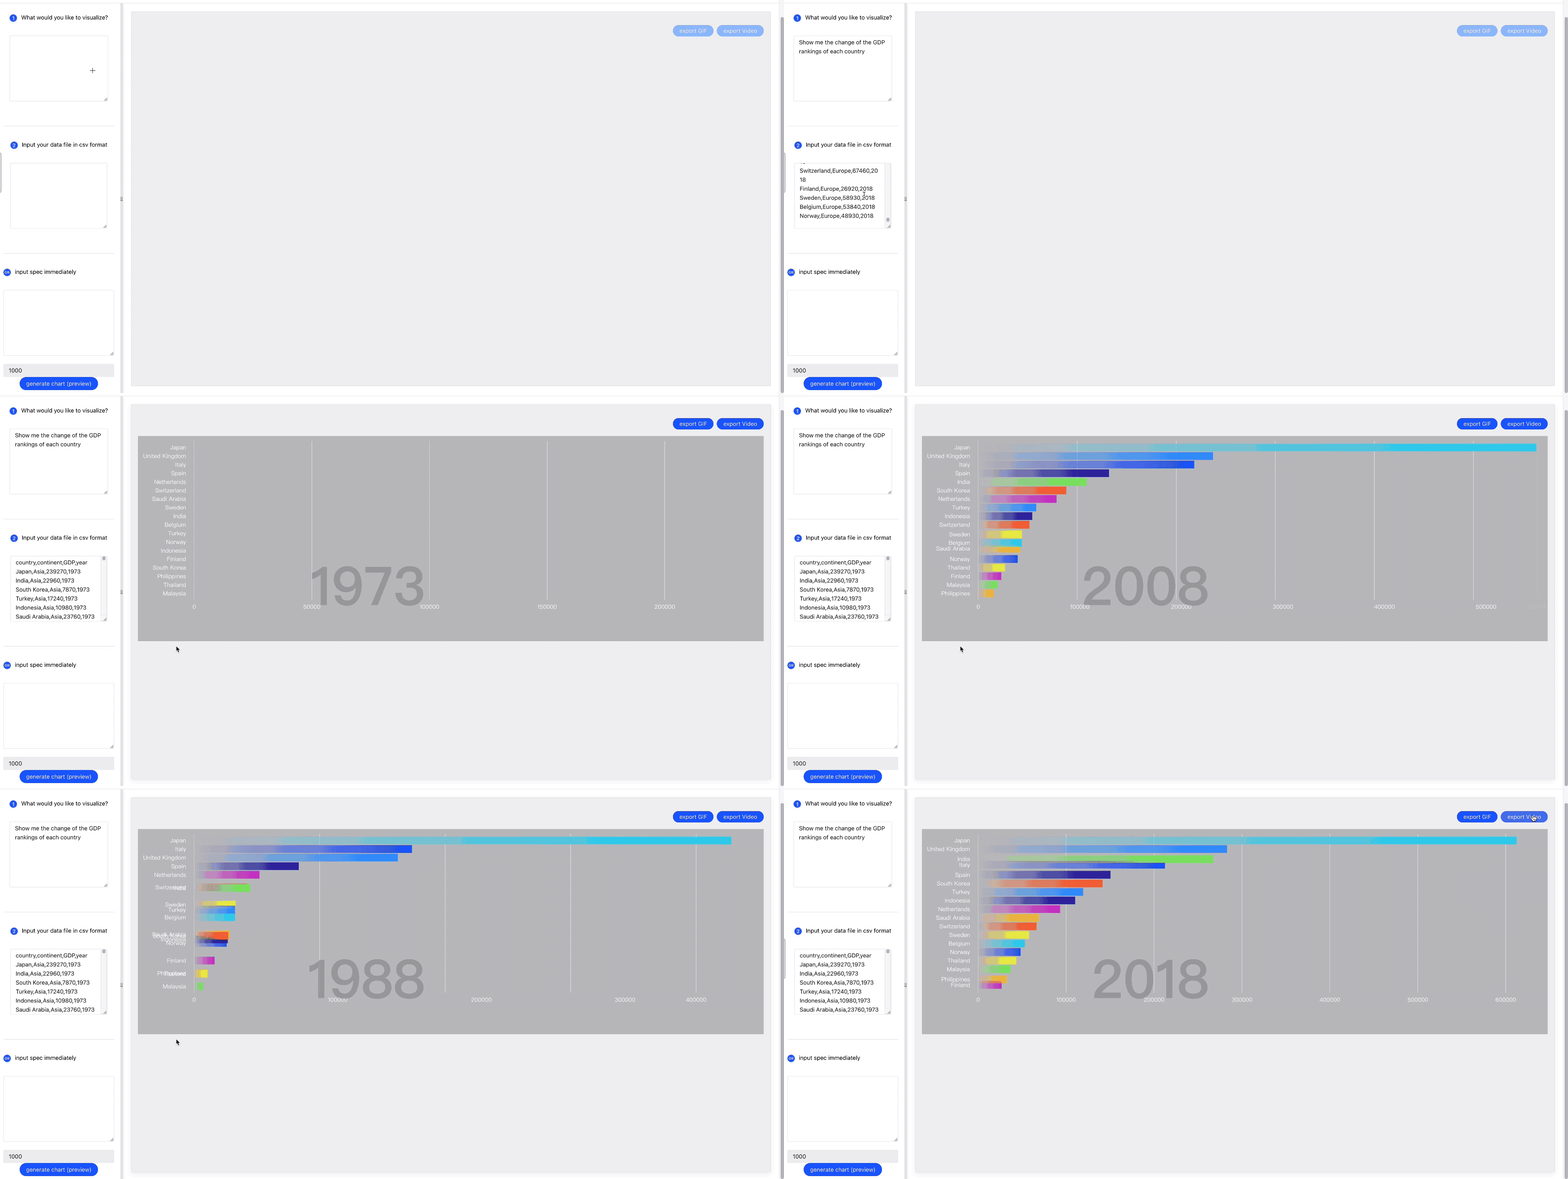
Dynamic bar chart

Alt text

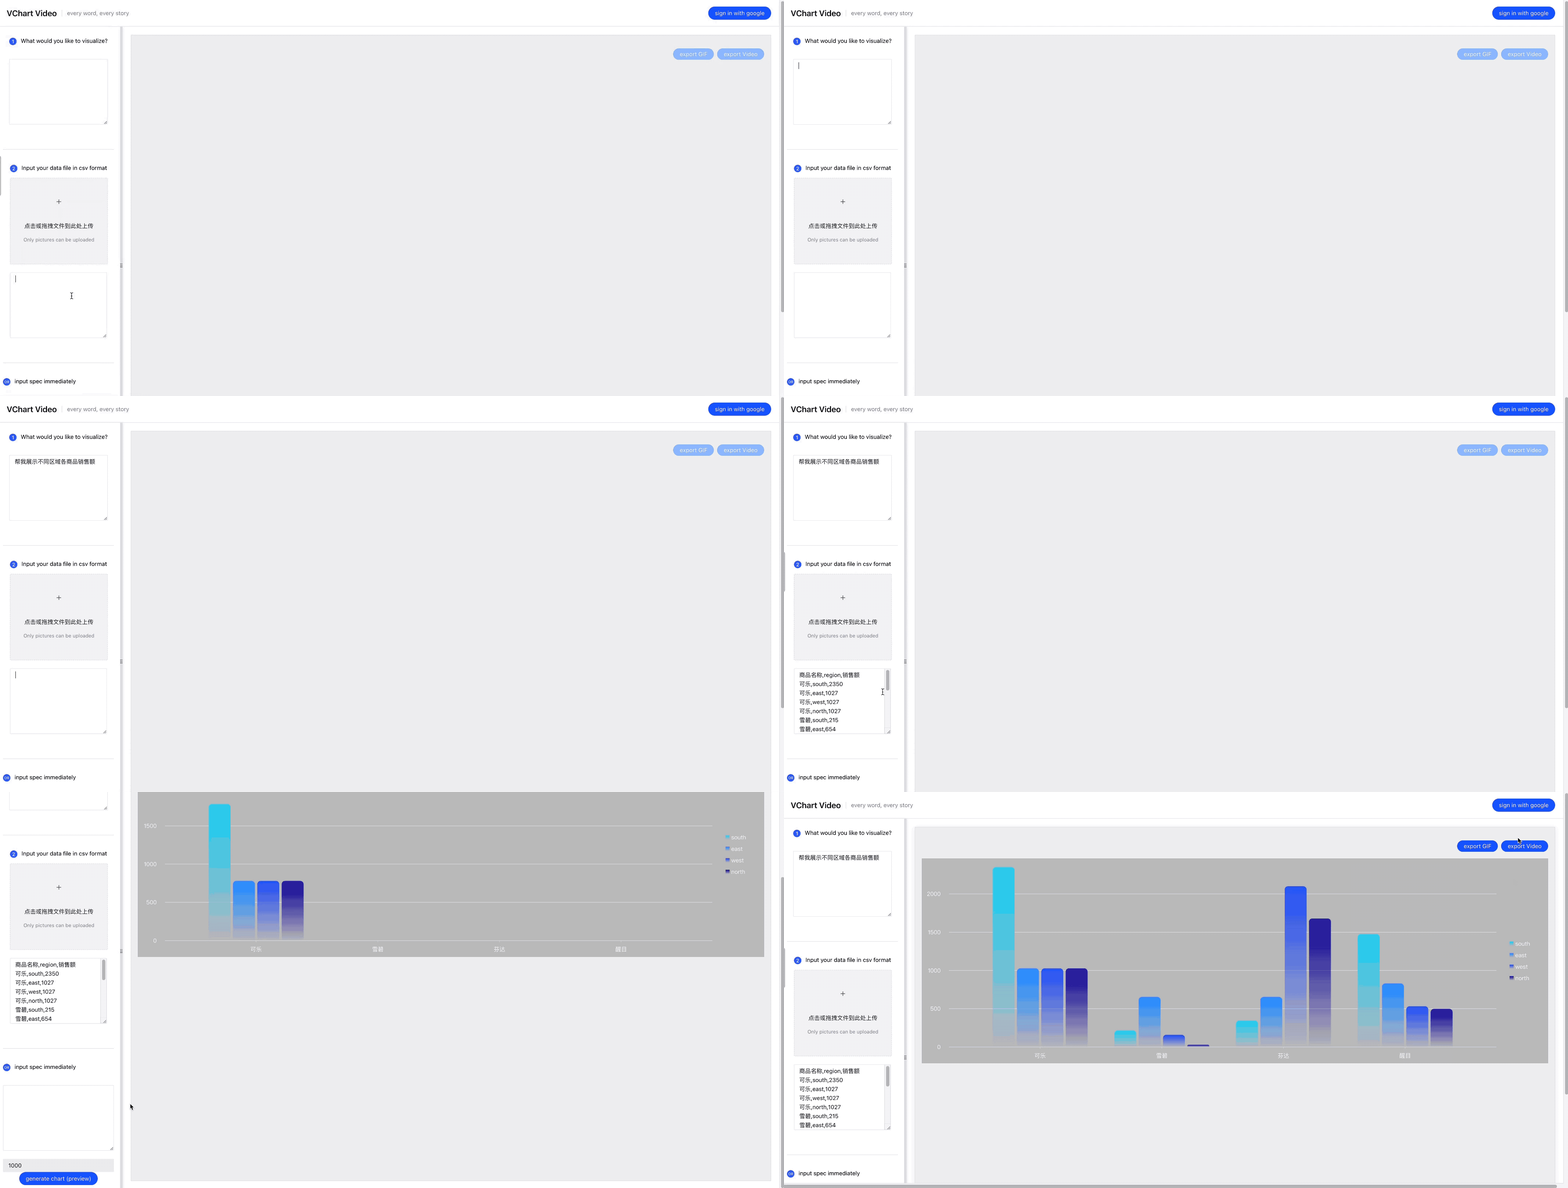
Bar chart

Alt text

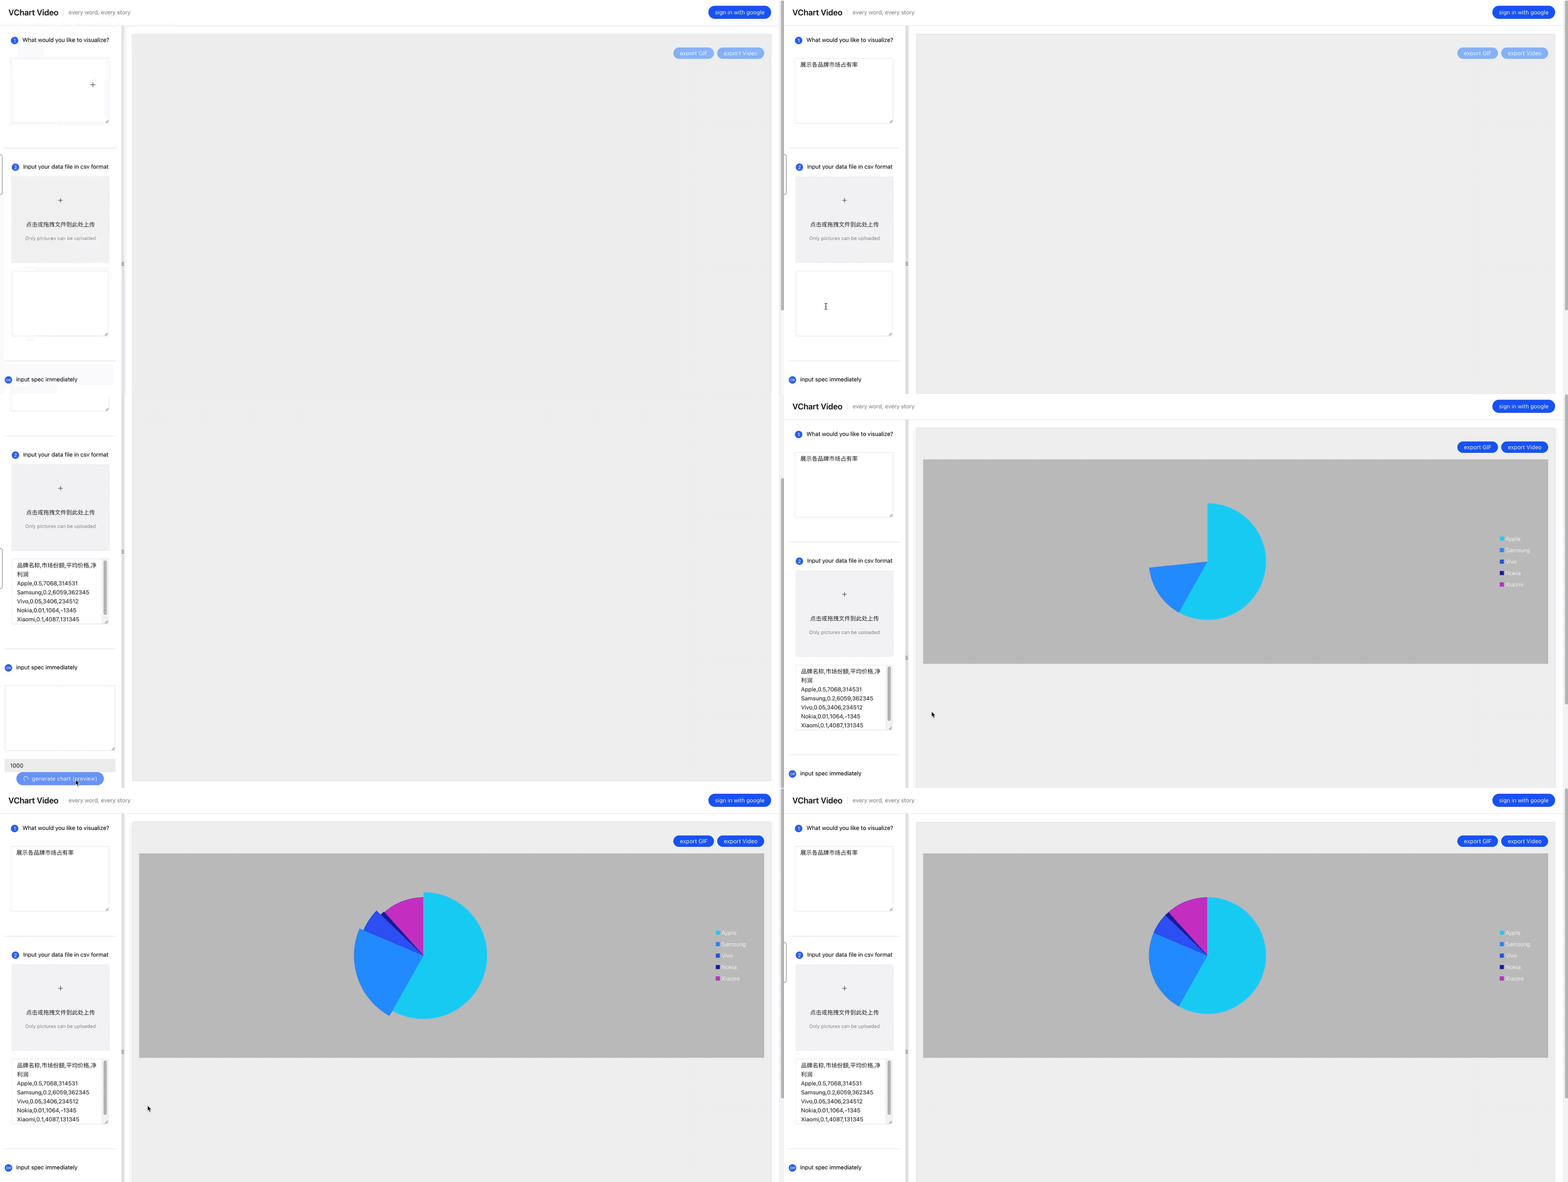
Pie chart

Alt text

vmind's People

Contributors

bestony avatar da730 avatar github-actions[bot] avatar kkxxkk2019 avatar lucaschang95 avatar neuqzxy avatar pairone avatar purpose233 avatar skie1997 avatar ssfxz avatar xiaoluohe avatar xile611 avatar xuanhun avatar zamhown avatar zthxxx avatar

Stargazers

 avatar  avatar  avatar  avatar  avatar  avatar  avatar  avatar  avatar  avatar  avatar  avatar  avatar  avatar  avatar  avatar  avatar  avatar  avatar  avatar  avatar  avatar  avatar  avatar  avatar  avatar  avatar  avatar  avatar  avatar  avatar  avatar  avatar  avatar  avatar  avatar

Watchers

 avatar  avatar  avatar  avatar  avatar  avatar  avatar  avatar  avatar  avatar

vmind's Issues

optimize patch pipelines

response of LLM need to be patched. We can divide this prgress into pipelines to make it more clear and improve maintainability

missing a field in data

--data-raw '{"csvData":"filter_r,a_type_label,prr_tags,app_id,abtest_versions,r_reasons,r_tags,channel_id,region,uid,vid_int,timestamp,trace_id\r\n,,,1233,,,,112,US,7092296493822592046,,1708445808150,2024022016164529A8B0CD0A1AEBED59C1\r\n,,,1233,,,,57,US,7092296493822592046,,1708445389846,202402201609497136D67B0F97D0E072E4\r\n,,,1233,,,,81,US,7092296493822592046,,1708525298858,20240221142138A866F61C2102DE076789\r\n,,,1233,,,,112,US,7092296493822592046,,1708867031297,20240225131710A436704DA937A7C72C7E\r\n,,,1233,,,,112,US,7092296493822592046,,1708610066492,202402221354256D11E714CFF5812E5944\r\n,,,1233,,,,112,US,7092296493822592046,,1708867539587,20240225132539E1B41CFDC4CA6C7D6B23\r\n,,,1233,,,,112,US,7092296493822592046,,1708525412066,202402211423318BAA53BC0648780C1A50\r\n,,,1233,,,,112,US,7092296493822592046,,1708867378664,2024022513225849549B50310E70CCBCB0\r\n,,,1233,,,,112,US,7092296493822592046,,1708867413105,20240225132332AA2CFEF9F4DDAFC645F6\r\n,,,1233,,,,112,US,7092296493822592046,,1708867493206,20240225132452B1C06A032A58CDBE709D\r\n,,,1233,,,,81,US,7092296493822592046,,1708778690534,20240224124450B7DD2AF1F6456415B9D4\r\n,,,1233,,,,199,US,7092296493822592046,,1708446088298,20240220162127028C9A44474E820AD6D8\r\n,,,1233,,,,112,US,7092296493822592046,,1708525477107,202402211424363EB0AAE89450ADD82476\r\n,,,1233,,,,81,US,7092296493822592046,,1708866956971,20240225131556726A95F72884A245C786\r\n,,,1233,,,,81,US,7092296493822592046,,1708445383055,202402201609424EB937059B320908E945\r\n,,,1233,,,,81,US,7092296493822592046,,1708866955521,2024022513155557DCB3F6E16D834367BB\r\n,,,1233,,,,112,US,7092296493822592046,,1708866921143,20240225131520A834042EBFBFE69DEB8D\r\n,,,1233,,,,81,US,7092296493822592046,,1708445387314,20240220160947B7E58F06F01A600A1D89\r\n,,,1233,,,,57,US,7092296493822592046,,1708866705920,20240225131145BF96E65D2170CE9EDD74\r\n,,,1233,,,,81,US,7092296493822592046,,1708696269252,20240223135109AD8C4B063FF90E11DE4A\r\n,,,1233,,,,81,US,7092296493822592046,,1708525300274,202402211421406DA69D0D4B109907247B\r\n,,,1233,,,,112,US,7092296493822592046,,1708696316767,20240223135156C054F110E2DCEF2A17FF\r\n,,,1233,,,,57,US,7092296493822592046,,1708780057459,20240224130737AD1422BAA86115E48421\r\n,,,1233,,,,81,US,7092296493822592046,,1708778691908,2024022412445168962D3FED452616CBC8\r\n,,,1233,,,,112,US,7092296493822592046,,1708867293249,20240225132132E7A7B63D8806E7B2669C\r\n,,,1233,,,,57,US,7092296493822592046,,1708830915190,20240225031514DA8D786AF956F3B3151E\r\n,,,1233,,,,199,US,7092296493822592046,,1708867020337,20240225131700BA96658227C3263D9FFB\r\n,,,1233,,,,112,US,7092296493822592046,,1708610183381,202402221356226A7787CFFCB3B3114B59\r\n,,,1233,,,,112,US,7092296493822592046,,1708445377163,20240220160936953B3302117F81C114EC\r\n,,,1233,,,,112,US,7092296493822592046,,1708445576957,20240220161256D50449D1328057A6BD06\r\n,,,1233,,,,112,US,7092296493822592046,,1708829558775,20240225025237CBDEFBA79C617EBD9D1C\r\n,,,1233,,,,112,US,7092296493822592046,,1708445743592,20240220161542266C6CB4CBA382E968C2\r\n,,,1233,,,,112,US,7092296493822592046,,1708445805356,2024022016164529A8B0CD0A1AEBED59C1\r\n,,,1233,,,,112,US,7092296493822592046,,1708829643717,20240225025403D1FC6676586CB0905BA4\r\n,,,1233,,,,112,US,7092296493822592046,,1708867458566,20240225132418AA2CFEF9F4DDAFC64C08\r\n,,,1233,,,,57,US,7092296493822592046,,1708829561662,20240225025241AD1DEF6A5E605EB09A41\r\n,,,1233,,,,199,US,7092296493822592046,,1708446060872,2024022016210090140F31FA12220A7D07\r\n,,,1233,,,,57,US,7092296493822592046,,1708866924109,202402251315234A814EC71071DF0BD7BA\r\n,,,1233,,,,112,US,7092296493822592046,,1708696468585,2024022313542700D9ED5E8EF761717DB0\r\n,,,1233,,,,112,US,7092296493822592046,,1708696711378,202402231358302CEAD44D98039B2DD7F7\r\n,,,1233,,,,112,US,7092296493822592046,,1708696888515,202402231401289ACBCA53809D603CB427\r\n,,,1233,,,,112,US,7092296493822592046,,1708697684980,20240223141444F63C2904943A35394266\r\n,,,1233,,,,112,US,7092296493822592046,,1708696523386,2024022313552333351F9918D7AEFBC917\r\n,,,1233,,,,112,US,7092296493822592046,,1708778718828,20240224124518678C6C73CA659783014F\r\n,,,1233,,,,199,US,7092296493822592046,,1708867002606,202402251316421204BD6B6E8A1543DF6D\r\n,,,1233,,,,81,US,7092296493822592046,,1708610072970,20240222135432AAB3121782186419DC89\r\n,,,1233,,,,36,US,7092296493822592046,,1708615362521,20240222152241EF0B669DEEE0E496F96F\r\n,,,1233,,,,112,US,7092296493822592046,,1708778675358,2024022412443493EB0DEC9C052B74105B\r\n,,,1233,,,,81,US,7092296493822592046,,1708610087681,202402221354477146569C78F80D18EA96\r\n,,,1233,,,,112,US,7092296493822592046,,1708697729569,2024022314152925857C95174C5170FFE1\r\n,,,1233,,,,112,US,7092296493822592046,,1708830914020,20240225031512773AB90FAACEEAAB0EC3\r\n,,,1233,,,,57,US,7092296493822592046,,1708525297721,2024022114213712CCCD5815C1AD2EC79C\r\n,,,1233,,,,112,US,7092296493822592046,,1708696389687,2024022313530844B7446267116F43B927\r\n,,,1233,,,,112,US,7092296493822592046,,1708696778238,20240223135937AE668F844C9E674014AA\r\n,,,1233,,,,112,US,7092296493822592046,,1708778853424,202402241247320E708EB8477261C354EC\r\n,,,1233,,,,57,US,7092296493822592046,,1708612888542,202402221441278D67B0C690E5271CF702\r\n,,,1233,,,,112,US,7092296493822592046,,1708525497626,202402211424572C71AF81DF15F3D58A12\r\n,,,1233,,,,112,US,7092296493822592046,,1708696264074,202402231351039FE818735839B051969E\r\n,,,1233,,,,112,US,7092296493822592046,,1708696837646,202402231400365EC5C2DC236F465D4E58\r\n,,,1233,,,,112,US,7092296493822592046,,1708866686273,202402251311254A6702F97C70EFB028C9\r\n,,,1233,,,,81,US,7092296493822592046,,1708696270906,202402231351101A6B548FA0EF34105774\r\n,,,1233,,,,112,US,7092296493822592046,,1708612905678,202402221441452F5FE2073237C10F57E7\r\n,,,1233,,,,199,US,7092296493822592046,,1708446029499,20240220162029CC9A407970F27F0A4877\r\n,,,1233,,,,112,US,7092296493822592046,,1708867137922,20240225131856472BE356E5350FABC73D\r\n,,,1233,,,,112,US,7092296493822592046,,1708610245415,2024022213572577901A133CFB2CCC0B92\r\n,,,1233,,,,57,US,7092296493822592046,,1708696266988,20240223135106160FFA6ADCFEDF73CA64\r\n,,,1233,,,,112,US,7092296493822592046,,1708615460784,202402221524199564A8038AF9AA36444C\r\n,,,1233,,,,57,US,7092296493822592046,,1708778687975,20240224124447386C3BC31D8413A29048\r\n,,,1233,,,,81,US,7092296493822592046,,1708778691688,20240224124451E04E8393FD062E163F63\r\n,,,1233,,,,112,US,7092296493822592046,,1708780055058,2024022413073490F4C59A20694E5BAB87\r\n,,,1233,,,,112,US,7092296493822592046,,1708866728857,202402251312084C2A820F878915C26092\r\n,,,1233,,,,57,US,7092296493822592046,,1708610081294,202402221354413A683CB601C0DB53ED1C\r\n,,,1233,,,,112,US,7092296493822592046,,1708525451364,2024022114241123B931A468FC56D27B6C","prompt":"show me the distribution","model":"gpt-3.5-turbo"}'

[Bug] data aggregation failed

Version

1.2.4

Link to Minimal Reproduction

null

Steps to Reproduce

Key,BP,Count\nJIRA-27358,BP1.4.1,1\nJIRA-27356,BP1.4.1,1\nJIRA-27350,BP1.5.0,1\nJIRA-27349,BP1.4.1,1\nJIRA-27348,BP1.4.1,1\nJIRA-27347,BP1.4.1,1\nJIRA-27344,BP1.5.0,1\nJIRA-27343,BP1.4.1,1\nJIRA-27339,BP1.4.1,1\nJIRA-27338,BP1.4.1,1\nJIRA-27336,BP1.4.1,1\nJIRA-27335,BP1.4.1,1\nJIRA-27334,BP1.4.1,1\nJIRA-27333,BP1.5.0,1\nJIRA-27331,BP1.4.1,1\nJIRA-27330,BP1.4.1,1\nJIRA-27322,BP1.4.1,1\nJIRA-27321,BP1.4.1,1\nJIRA-27320,BP1.4.0,1\nJIRA-27319,BP1.4.0,1\nJIRA-27316,BP1.4.0,1\nJIRA-27315,BP1.4.1,1\nJIRA-27314,BP1.5.0,1\nJIRA-27311,BP1.4.1,1\nJIRA-27310,BP1.4.1,1\nJIRA-27309,BP1.4.1,1\nJIRA-27308,BP1.4.1,1\nJIRA-27307,BP1.4.1,1\nJIRA-27306,BP1.4.1,1\nJIRA-27305,BP1.4.1,1\nJIRA-27304,BP1.4.1,1\nJIRA-27303,BP1.4.1,1\nJIRA-27302,BP1.4.1,1\nJIRA-27301,BP1.4.1,1\nJIRA-27300,BP1.4.1,1\nJIRA-27299,BP1.4.1,1\nJIRA-27297,BP1.4.1,1\nJIRA-27296,BP1.4.1,1\nJIRA-27295,BP1.4.1,1\nJIRA-27294,BP1.4.1,1\nJIRA-27293,BP1.4.1,1\nJIRA-27292,BP1.4.1,1\nJIRA-27291,BP1.4.1,1\nJIRA-27290,BP1.5.0,1\nJIRA-27289,BP1.4.1,1\nJIRA-27281,BP1.4.1,1\nJIRA-27279,BP1.4.0,1\nJIRA-27278,BP1.4.1,1\nJIRA-27277,BP1.4.0,1\nJIRA-27276,BP1.4.0,1

按照bp分类统计count之和,绘制柱状堆叠图

Current Behavior

img_v3_029i_feeb1eb4-7483-453c-aa62-5bbf60911fdg

Expected Behavior

使用聚合后的数据生成图表

Environment

- OS:
- Browser:
- Framework:

Any additional comments?

No response

[Bug] measure value is 0 when use fieldInfo from parseCSVDataWithLLM

Version

1.2.3

Link to Minimal Reproduction

null

Steps to Reproduce

帮我展示不同区域各商品销售额
商品名称,region,销售额
可乐,south,2350
可乐,east,1027
可乐,west,1027
可乐,north,1027
雪碧,south,215
雪碧,east,654
雪碧,west,159
雪碧,north,28
芬达,south,345
芬达,east,654
芬达,west,2100
芬达,north,1679
醒目,south,1476
醒目,east,830
醒目,west,532
醒目,north,498

const { fieldInfo, dataset } = await vmind.current.parseCSVData(csvData, describe);
      const { spec, time } = await vmind.current.generateChart(
        describe,
        fieldInfo,
        dataset,
      );

Current Behavior

{
"sql": "SELECT Product name, region, SUM(Sales) AS total_sales FROM dataSource GROUP BY Product name, region",
"fieldInfo": [
{
"fieldName": "Product name",
"description": "Represents the name of the product."
},
{
"fieldName": "region",
"description": "Represents the region where the product is sold."
},
{
"fieldName": "total_sales",
"description": "An aggregated field representing the total sales amount of each product in each region. It is generated by summing up the sales values for each product in each region."
}
]
}
and the aggregated measure value is all 0

Expected Behavior

aggregate normally

Environment

- OS:
- Browser:
- Framework:

Any additional comments?

No response

[Bug] YAML has : and throw an error in chart generation using skylark

Version

1.1.0

Link to Minimal Reproduction

null

Steps to Reproduce

userPrompt: 请推荐最佳的数据可视化展现方式
GPT 3.5 and skylark2 pro all throw an error.
image

Current Behavior

image Both the yaml.load and chartAdvisor throw an error: image

Expected Behavior

generate chart normally

Environment

- OS:
- Browser:
- Framework:

Any additional comments?

No response

[Bug] Order by does not work on dataAggregation.

Version

1.2.3

Link to Minimal Reproduction

null

Steps to Reproduce

帮我展示north区域排名前三的商品销售额

商品名称,region,销售额
可乐,south,2350
可乐,east,1027
可乐,west,1027
可乐,north,1027
雪碧,south,215
雪碧,east,654
雪碧,west,159
雪碧,north,28
芬达,south,345
芬达,east,654
芬达,west,2100
芬达,north,1679
醒目,south,1476
醒目,east,830
醒目,west,532
醒目,north,498

Current Behavior

[
{
"商品名称": "可乐",
"total_sales": 1027
},
{
"商品名称": "雪碧",
"total_sales": 28
},
{
"商品名称": "芬达",
"total_sales": 1679
}
]

Expected Behavior

dataset sort by total_sales

Environment

- OS:
- Browser:
- Framework:

Any additional comments?

No response

[Feature] add domain of dimensions in fieldInfo to make LLM use values from domain while generating SQL

What problem does this feature solve?

user must specify dimension value in their prompt, such as "帮我展示north区域排名前三的商品销售额" because LLM doesn't know dimension values when generating sql. If we add domain of dimensions in fieldInfo, user can use "帮我展示北方排名前三的商品销售额"

What does the proposed API look like?

[
{
"fieldName": "商品名称",
"type": "string",
"role": "dimension",
domain:['可乐', '雪碧', '芬达', '醒目']
},
{
"fieldName": "region",
"type": "string",
"role": "dimension",
domain:['north', 'south', 'west', 'east']
},
{
"fieldName": "销售额",
"type": "int",
"role": "measure"
}
]

[Feature] use vector database to query examples and fill in chart generation prompt.

What problem does this feature solve?

to increase the accuracy of chart generation, use vector database to query exapmles according to user's input and fill the result in chart generation prompt. This can be done when VMind has collected enough chart generation examples.

What does the proposed API look like?

queryExamples(userInput)

[Bug] gif size error when export gif twice.

Version

1.2.4-alpha.5

Link to Minimal Reproduction

null

Steps to Reproduce

see feat/node-support branch.

Current Behavior

gif size error:
vmind-wordcloud-1707376254884

Expected Behavior

gif has the same size as jpg:
vmind-wordcloud-1707376254884

Environment

- OS:
- Browser:
- Framework:

Any additional comments?

No response

Recommend Projects

  • React photo React

    A declarative, efficient, and flexible JavaScript library for building user interfaces.

  • Vue.js photo Vue.js

    🖖 Vue.js is a progressive, incrementally-adoptable JavaScript framework for building UI on the web.

  • Typescript photo Typescript

    TypeScript is a superset of JavaScript that compiles to clean JavaScript output.

  • TensorFlow photo TensorFlow

    An Open Source Machine Learning Framework for Everyone

  • Django photo Django

    The Web framework for perfectionists with deadlines.

  • D3 photo D3

    Bring data to life with SVG, Canvas and HTML. 📊📈🎉

Recommend Topics

  • javascript

    JavaScript (JS) is a lightweight interpreted programming language with first-class functions.

  • web

    Some thing interesting about web. New door for the world.

  • server

    A server is a program made to process requests and deliver data to clients.

  • Machine learning

    Machine learning is a way of modeling and interpreting data that allows a piece of software to respond intelligently.

  • Game

    Some thing interesting about game, make everyone happy.

Recommend Org

  • Facebook photo Facebook

    We are working to build community through open source technology. NB: members must have two-factor auth.

  • Microsoft photo Microsoft

    Open source projects and samples from Microsoft.

  • Google photo Google

    Google ❤️ Open Source for everyone.

  • D3 photo D3

    Data-Driven Documents codes.