Giter Club home page Giter Club logo

vega-lite-api's Introduction

Vega-Lite API

npm version Build Status

Gallery Image

A JavaScript API for creating Vega-Lite JSON specifications. Vega-Lite is a high-level grammar for visual analysis that generates complete Vega specifications.

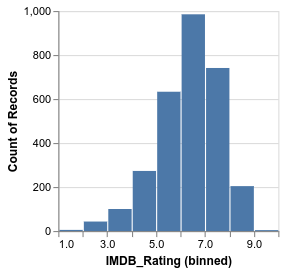
With the Vega-Lite API, you can write JavaScript code like this:

vl.markBar().data('data/movies.json').encode(
  vl.x().fieldQ('IMDB_Rating').bin(true),
  vl.y().count()
)

To produce Vega-Lite JSON like this:

{
  "mark": "bar",
  "data": {"url": "data/movies.json"},
  "encoding": {
    "x": {
      "bin": true,
      "field": "IMDB_Rating",
      "type": "quantitative"
    },
    "y": {
      "aggregate": "count",
      "type": "quantitative"
    }
  }
}

To get started with the Vega-Lite API, see these Observable notebooks:

Build Instructions

For a basic setup allowing you to build the API and run tests:

  • Clone https://github.com/vega/vega-lite-api.
  • Run yarn to install dependencies for all packages. If you don't have yarn installed, see https://yarnpkg.com/en/docs/install.
  • Once installation is complete, run yarn build to build the API generator and generate API source code in the src directory. Run yarn test to additionally run the test suite.

API Reference

See the Vega-Lite JavaScript API Reference.

vega-lite-api's People

Contributors

curran avatar dependabot-preview[bot] avatar dependabot[bot] avatar domoritz avatar jheer avatar kanitw avatar mhkeller avatar oluckyman avatar

Stargazers

 avatar  avatar  avatar  avatar  avatar  avatar  avatar  avatar  avatar  avatar  avatar  avatar  avatar  avatar  avatar  avatar  avatar  avatar  avatar  avatar  avatar  avatar  avatar  avatar  avatar  avatar  avatar  avatar  avatar  avatar  avatar  avatar  avatar  avatar  avatar  avatar  avatar  avatar  avatar  avatar  avatar  avatar  avatar  avatar  avatar  avatar  avatar  avatar  avatar  avatar  avatar  avatar  avatar  avatar  avatar  avatar  avatar  avatar  avatar  avatar  avatar  avatar  avatar  avatar  avatar  avatar  avatar  avatar  avatar  avatar  avatar  avatar  avatar  avatar  avatar  avatar  avatar  avatar  avatar  avatar  avatar  avatar  avatar  avatar  avatar  avatar  avatar  avatar  avatar  avatar  avatar  avatar  avatar  avatar  avatar  avatar  avatar  avatar  avatar  avatar

Watchers

 avatar  avatar  avatar  avatar  avatar  avatar  avatar  avatar

vega-lite-api's Issues

Issue with responsive chart

Hey folks, I tried making the vegalite chart responsive by using container in the width and height method calls to the vl object.

I'm using these versions:

<script src="https://cdn.jsdelivr.net/npm/vega"></script>
<script src="https://cdn.jsdelivr.net/npm/vega-lite"></script>
<script src="https://cdn.jsdelivr.net/npm/vega-lite-api"></script>
<script src="https://cdn.jsdelivr.net/npm/vega-tooltip"></script>

This is the relevant JS code:

vl.markBar()
        .data(simpleData)
        .width("container")
        .height("container")
        .encode(
          vl.x().fieldT("date").timeUnit("month"),
          vl.y().count(),
          vl.color().fieldN("category")
        )
        .render()
        .then((chart) => {
          document.getElementById("chart").appendChild(chart);
        });

And the chart is rendered into a div which is styled like this:

#chart {
        width: 100%;
        height: 80vh;
        background-color: lightcoral;
      }

Now by default the chart does not render, and when I manually resize the browser window I can see the chart coming up. I have hosted this code here too for reference - https://mr-nano.github.io/static-pages-etc/vegalite/responsive-layout-problem.html

This is the full html file as well:

<!DOCTYPE html>
<html lang="en">
  <head>
    <meta charset="UTF-8" />
    <meta http-equiv="X-UA-Compatible" content="IE=edge" />
    <meta name="viewport" content="width=device-width, initial-scale=1.0" />
    <title>Document</title>
    <script src="https://cdn.jsdelivr.net/npm/vega"></script>
    <script src="https://cdn.jsdelivr.net/npm/vega-lite"></script>
    <script src="https://cdn.jsdelivr.net/npm/vega-lite-api"></script>
    <script src="https://cdn.jsdelivr.net/npm/vega-tooltip"></script>
    <style>
      #chart {
        width: 100%;
        height: 80vh;
        background-color: lightcoral;
      }
      span {
          color: lightcoral;
      }
    </style>
  </head>
  <body>
    <h1>Vega lite responsive layout does not work well...</h1>
    <p>
      To make this work, drag the browser and vegalite chart will start
      coming... the <span>coral color div</span> is the div that will contain the vegalite container... but as you can see it does not work...
    </p>
    <div id="chart"></div>

    <script>
      const simpleData = [
        {
          date: "2021-01-01",
          category: "A",
          value: 10,
        },
        {
          date: "2021-01-01",
          category: "B",
          value: 100,
        },
        {
          date: "2021-02-01",
          category: "A",
          value: 20,
        },
        {
          date: "2021-02-01",
          category: "B",
          value: 5,
        },
      ];

      vl.register(vega, vegaLite, {});

      vl.markBar()
        .data(simpleData)
        .width("container")
        .height("container")
        .encode(
          vl.x().fieldT("date").timeUnit("month"),
          vl.y().count(),
          vl.color().fieldN("category")
        )
        .render()
        .then((chart) => {
          document.getElementById("chart").appendChild(chart);
        });
    </script>
  </body>
</html>

SVG export in Observable: error on opening the file

Don't know wether it is an Observable or Vega-Lite issue:

I go to https://observablehq.com/@vega/vega-lite-pyramid-pie?collection=@vega/vega-lite-api

I change the render option to svg:
.render({renderer:'svg'});

then try and export via the download SVG item in the Observable cell menu.
When i open the file (in a browser like Chrome or Edge) i get:

This page contains the following errors:
error on line 1 at column 226: Attribute xmlns redefined
Below is a rendering of the page up to the first error.

And indeed, this appears repeated in the svg root node:
xmlns="http://www.w3.org/2000/svg" xmlns:xlink="http://www.w3.org/1999/xlink"

How to avoid zero baseline?

Surprisingly, when specifying a visualization like this:

vl
  .markCircle()
  .data(data)
  .encode(
    vl.x().fieldQ('acceleration'),
    vl.y().fieldQ('horsepower'),
  );

the domain max is computed from the data max, but the domain min is zero.

I have searched all over the place in the Observable examples, and have not been able to find an example where the domain min is also computed from data. I have seen the domain manually specified, but is there a simple way to compute the min from the data as well?

image

Related (old) discussion Initializing interactive scatterplot with x/y max and min from data.

Vega-Lite API displaying (bounding) box instead of GeoJSON feature

First off, thanks for this wonderful piece of technology!

Today I had some trouble rendering some GeoJSON features using vega-lite:
The following GeoJSON polygon
image

Is displayed as a simple box using the following vega-lite-api code:

vl
  .markGeoshape()
  .data([feature])
  .encode(
    vl
      .color()
      .fieldN('properties.D_USE')
      .legend({ title: 'Land use type' })
  )
  .config({ view: { stroke: null } })
  .render()

image

The same code already worked on a similar dataset, where the vega-lite-api produced the desired results.

When looking for similar issues I found these two vega/vega-lite#4165, vega/vega#1405. While the first issue got closed in favour of the second, I highly suspect that they not really related as my input GeoJSON shape is both far from being rectangle shaped, as well as way too small to be affected by a reprojection distortion as described in vega/vega#1405.

Here is a small observable showcasing the issue:
https://observablehq.com/@chrispahm/vega-lite-api-displaying-bounding-box-instead-of-geojson-fe

Thanks a lot for having a look!
Best
Christoph

Use CHANNELS to drive the APIs

In https://github.com/vega/vega-lite-api/blob/master/api/API.js,

We could replace manual repetitions of channels

  // encoding channels
  color:           channel('color'),
  column:          channel('column'),
  detail:          channel('detail'),
   ...

with

import {CHANNELS} from 'vega-lite/build/src/channel';

...

  // encoding channels
...CHANNELS.reduce((m, c) => {
  m[c] = channel(c);
  return m;
}, {}); 

This way, we will always have this up to date when we add new channels in the future.

Same for marks and probably a few other things. :)

Missing markSymbol

I didn't see markSymbol() in the docs, as a workaround I tried

    vl.mark({
      "type": "symbol",
      "encode": {
        "enter": {
          "fill": {"value": "#939597"},
          "stroke": {"value": "#652c90"}
        },
        "update": {
          "x": {value: "openTime"},
          "y": {value: "openPrice"},
          "shape": {"value": "arrow"},
          "opacity": {"value": 1}
        }
      }
    })

but hit an error TypeError: Cannot read property 'filled' of undefined

{empty: false} on selection throws Error: Unrecognized signal name:

Adding .empty(false) to a selection throws "Error: Unrecognized signal name:"

See this example

{
  const highlight = vl.selectPoint("highlight").empty(false); //โŒ
  return vl
    .markRect({ strokeWidth: 2 })
    .select(highlight)
    .encode(
      vl.y().fieldN("actual"),
      vl.x().fieldN("predicted"),
      vl.fill().fieldQ("count"),
      vl.stroke().if(highlight, vl.value("black")).value(null)
    )
    .data(data)
    .config({
      scale: {
        bandPaddingInner: 0,
        bandPaddingOuter: 0
      },
      view: { step: 40 },
      range: {
        ramp: {
          scheme: "yellowgreenblue"
        }
      },
      axis: {
        domain: false
      }
    })
    .render();
}

With VegaLite API v4 one could use .empty("none") for setting the default value of the selection. I built an example for that which doesn't work with v5

Could be related to @arvind merge on Vega-Lite

Possible workaround: adding empty: false in the encoding and not in the selection definition, which was an idea I got reading this discussion between @kanitw and @domoritz. However, using the object there seems wrong...

{
  const highlight = vl.selectPoint("highlight");
  return vl
    .markRect({ strokeWidth: 2 })
    .select(highlight)
    .encode(
      vl.y().fieldN("actual"),
      vl.x().fieldN("predicted"),
      vl.fill().fieldQ("count"),
      vl
        .stroke()
        .condition({ param: "highlight", empty: false, value: "black" }) // โœ…
        .value(null)
    )
    .data(data)
    .config({
      scale: {
        bandPaddingInner: 0,
        bandPaddingOuter: 0
      },
      view: { step: 40 },
      range: {
        ramp: {
          scheme: "yellowgreenblue"
        }
      },
      axis: {
        domain: false
      }
    })
    .render();
}

The reference documentation for Vega-Lite-API suggests that one should be able to use .empty(false) regardless of the location...

Release a build for Vega Lite 5.2

I've been having a great time using these JS bindings! It's a huge DX improvement over writing JSON ๐Ÿ˜…

However, I just reached for a yOffset encoding only to learn that it was added in Vega Lite 5.2 and therefore not in vega-lite-api, which is for Vega Lite 5.0.0.

Maybe this is naive of me to think, but given that the 5.2 schema upgrade isn't a breaking change, it seems like releasing a 5.2 build would be as straightforward as bumping the Vega Lite dependency and rerunning the build script (๐Ÿคž)?

Would you welcome a PR for this?

Avoid browser global conflict with vega-lite

Currently, both vega-lite-api and vega-lite browser builds output the same global variable, namely vl. This is unfortunate, since it makes it difficult to work with vega-lite-api without using a build step or using a module loader like d3-require. To work around this conflict, I did the following:

<script src="https://unpkg.com/[email protected]/build/vega-lite.min.js"></script>
<script>
  // Workadound for conflicting global.
  const vegalite = vl;
</script>
<script src="https://unpkg.com/[email protected]/build/vega-lite-api.min.js"></script>

Related:

The only change required would be this Rollup configuration here: https://github.com/vega/vega-lite-api/blob/master/rollup.js#L39

Suggested name: vlAPI.

.lookup from selection and key and examples

Here goes another one:

Trying to replicate the indexed linechart

https://observablehq.com/@john-guerra/vega-lite-interactive-index-chart

I couldn't figure out how to generate this { lookup: "symbol", from: { selection: "index", key: "symbol" } }I manage to get to this, but couldn't figure out the from part vl.lookup("symbol").from({ selection: "index", key: "symbol" })

Reading the documentation for both vl and vl-api I could figure out that I needed a secondary dataset with a lookupData, but couldn't make it work with a selection. Having examples from the documentation for all of these functions in the same way you have them on vega-lite will be a great plus. I'm willing to provide as many as I can and link them to the proper pages if there is an easy way of doing it

Example with Tooltips

I'm having some trouble getting tooltips to work. It's unclear where to put the vl.tooltip invocation.

I checked all of the examples in Observable, and none of them have tooltips working.

Perhaps working tooltips could be rolled into #23

Trying to get API to work with embed

Hi Folks. Thanks for your great work! I'm trying to programmatically change the color encoding when a user clicks a button, but I've failed so far. I found https://vega.github.io/vega-lite-api/api/color , and what I've tried is this:

$('#color_num_rows').click(function (e) {
    vl.color.field('# rows');
    vl.color(vl.fieldQ('# rows'));
    vl.color().fieldQ('# rows');
});

At the bottom I've inlcluded the <script> that my server generates. It is the encoding.color.field and .type that I want to change on the click.

It would be awesome if you could tell me how to do this.

    <script type="text/javascript">
        vegaEmbed('#vis', {
    "$schema": "https://vega.github.io/schema/vega-lite/v4.json",
    "data": {
        "values": [
            {
                "model": "Auquan-SEIR",
                "timezero": "2020-05-04",
                "forecast_url": "/forecast/10348",
                "PNBSQ counts": [6579, 0, 0, 0, 0],
                "# rows": 6579,
                "# units": 51,
                "# targets": 129
            },
            // many more...
        ]
    },
    "mark": {"type": "rect"},
    "width": "container",
    "config": {
        "view": {"step": 10},
        "axis": {"grid": false},
        "legend": {"disable": false, "titleOrient": "right"}
    },
    "encoding": {
        "x": {
            "field": "timezero",
            "timeUnit": "yearmonthdate",
            "type": "temporal",
            "title": null,
            "axis": {"orient": "top", "format": "%Y-%m-%d"}},
        "y": {
            "field": "model",
            "type": "nominal",
            "title": null},
        "href": {"field": "forecast_url"},
        "tooltip": [
            {"field": "model"},
            {"field": "timezero", "type": "temporal", "format": "%Y-%m-%d"},
            {"field": "forecast_url"},
            {"field": "PNBSQ counts"},
            {"field": "# rows"},
            {"field": "# units"},
            {"field": "# targets"}
        ],
        "color": {"field": "# targets", "type": "quantitative"}
    }
});
    </script>

use the same syntax as altair ?

sorry, just a business users here with non programming background, just a thought is there a technical reason not to use the same syntax as python altair, it is very friendly and easy to code.

Ability to re-render the graph using "data enter-exit" pattern

Hi vega-lite-api authors,

The flexibility of the API is amazing, thank you. However, I am having a hard time figuring out how to update the already rendered graph with new data (with a subset, superset, or completely new data).

What would be the correct way of creating a changest and then applying it to the current state of a graph?

Ability to customize tick format

It would be nice to be able to define a function that formats tick values.

Not sure this is the right place in the stack to file the issue (perhaps better as an issue in vega-lite or vega), but from the JS API is definitely where I'd love to be able to define and pass in a tick formatting function.

For example (from Ordinal Scatter Plot):

  const xAxisTickFormat = number =>
    d3.format('.3s')(number)
      .replace('G', 'B');

Related:

image

/cc @mbostock @domoritz

This particular issue feels like a symptom of something greater that's missing in the Vega ecosystem - there's a formidable "Wall of abstraction" that seems impenetrable. Setting the background color feels like a similar symptom. If only there were some way to add JavaScript hooks into Vega itself, maybe we could bash some holes in the wall. It would be a departure from the pure JSON spec idea, but possible worth pursuing.

What if the Vega spec object could have JS functions attached to it?

Another idea: Use the SVG renderer and do post-processing of the ticks DOM.

README Example Out of Date?

The primary example in the README does not match reality. The code in the README amounts to this:

const vl = require('vega-lite-api');
const x = vl.markBar().data('data/movies.json').encode(
  vl.x().bin('IMDB_Rating'),
  vl.y().count()
);
console.log(x.toString());

And the README advertises that it produces the following JSON:

{
  "mark": "bar",
  "data": {"url": "data/movies.json"},
  "encoding": {
    "x": {"bin": true, "field": "IMDB_Rating", "type": "quantitative"},
    "y": {"aggregate": "count", "type": "quantitative"}
  }
}

But that code actually renders the following JSON:

{
  "$schema": "https://vega.github.io/schema/vega-lite/v3.json",
  "mark": {"type": "bar"},
  "data": {"url": "data/movies.json"},
  "encoding": {
    "x": {"bin": "IMDB_Rating"},
    "y": {"type": "quantitative", "aggregate": "count"}
  }
}

In the Vega Editor the advertised specification renders the following chart:
image
But the actual specification renders the following chart:
image
Through a bit of experimentation and guess work, I modified the README example as follows:

const vl = require('vega-lite-api');
const x = vl.markBar().data('data/movies.json')
.encode(
  vl.x().fieldQ('IMDB_Rating').bin(true),
  vl.y().count()
);

Which generates the following specification:

{
  "$schema": "https://vega.github.io/schema/vega-lite/v3.json",
  "mark": {"type": "bar"},
  "data": {"url": "data/movies.json"},
  "encoding": {
    "x": {"field": "IMDB_Rating", "type": "quantitative", "bin": true},
    "y": {"type": "quantitative", "aggregate": "count"}
  }
}

And the following chart:
image

But to get there I had to be explicit in the code about using the fieldQ method instead of just field method and bin(true) instead of bin(fieldName). Whereas the README example lead me to believe that the bin(fieldName) method would perform some kind of inference on the data, but as illustrated above, in fact it did not.

I think either the README should be updated with my working example, or an explanation of what pre-requisites are unstated should be added. I'd be happy to issue a PR against the README if you the maintainers are in agreement with my assessment, or can please explain what I'm missing if the README is already adequate.

Rendering with maxbins when data have data points less than the number of bins themselves

I have a following data:

cdf_data = [
  { d_percentages: 0, student_percentages: 35 },
  { d_percentages: 10, student_percentages: 42 },
  { d_percentages: 20, student_percentages: 55 },
  { d_percentages: 30, student_percentages: 75 },
  { d_percentages: 40, student_percentages: 85 },
  { d_percentages: 50, student_percentages: 91 },
  { d_percentages: 60, student_percentages: 96 },
  { d_percentages: 70, student_percentages: 98 },
  { d_percentages: 80, student_percentages: 98 },
  { d_percentages: 90, student_percentages: 100 },
  { d_percentages: 100, student_percentages: 100 }
]

I created following visualization:

cdf_in_js_with_minbins = {
  const plot = vl.markBar()
    .data(cdf_data)
    .encode(
      vl.y()
        .fieldQ('student_percentages'),
      vl.x()
        .fieldQ('d_percentages')//.bin(true)
        .scale({ "domain": [0, 100] })
        .bin({ minbins: 10 })
    ).width(500).height(250);
  
  return plot.render();
}

This outputs:

image

Initially, before minbins: 10 above, I had tried maxbins: 30, and it rendered following:

image

This confused me a lot, especially because two bars in the range 90-100. Also, nowhere in cdf_data, it says 0-5 range has 35% of students and 5-10 range has 0% of students. I felt that, being "max" limit, it will end up showing just 10 bins as in case of first figure. Instead, it created 20 bins. Am I missing some understanding here or its a bug?

Here is the observablehq notebook rendering both plots.

Schema.json duplicated from vega-lite

It doesn't seem to make sense to duplicate a huge automatically generated file, schema.json between this repository and the vega-lite package. It may be best to instead import this file. This would save the additional step of running yarn schema when upgrading dependencies, and it would also prevent the Git repository from bloating over time from changes in this file. The downside of importing this instead of duplicating it is that you would not be able to track its changes in this repository.

$schema update to v4.json

I'm using this api all the time on observableHQ, but recently I found 'labelExpr' doesn't work at all. I debugged and found the spec this API generates still uses 'https://vega.github.io/schema/vega-lite/v3.json', which doesn't include 'labelExpr' and some later settings. currently I'm using 'toJSON' and manually change $schema and send to 'vega-lite' to render.

Just curious, is this api still being updated? I really like to use it.

Replicate examples from Vega-Lite site

Thanks for this library. It would be great as a quick reference to have the examples in the Vega-Lite gallery shown using this API.

It's a big lift, though, so one way to make it easy for folks to contribute would be to create a project scaffold with the output specs of each of those existing vega-lite examples. That way, people could fill in the JS api and the repo could run a test to validate the output against the spec. I'd be happy to help set that up if you're interested.

yOffset encoding is missing

I'm trying to recreate an existing Vega-Lite example using the Vega-Lite API in Observable, but I can't seem to find the yOffset encoding in the VL API. Here's the spec for the original example:

{
  "$schema": "https://vega.github.io/schema/vega-lite/v5.json",
  "description": "Shows the relationship between horsepower and the number of cylinders using point marks with random offset (jittering).",
  "data": {"url": "data/cars.json"},
  "transform": [{"calculate": "random()", "as": "random"}],
  "height": {"step": 50},
  "mark": "point",
  "encoding": {
    "x": {"field": "Horsepower", "type": "quantitative"},
    "y": {"field": "Cylinders", "type": "ordinal"},
    "yOffset": {"field": "random", "type": "quantitative"}
  }
}

The following code using the VL API works without yOffset specified:

vl.markPoint().data(cars)
.transform([
    vl.calculate("random()").as("random")
  ])
  .height({step: 50})
  .encode(
    vl.x().fieldQ('Horsepower'),
    vl.y().fieldO('Cylinders')
  ).render()

When I try to add a yOffset encoding, I run into an error:

vl.markPoint().data(cars)
.transform([
    vl.calculate("random()").as("random")
  ])
  .height({step: 50})
  .encode(
    vl.x().fieldQ('Horsepower'),
    vl.y().fieldO('Cylinders'),
    vl.yOffset().fieldQ('random')
  ).render()

I see this error in Observable: TypeError: vl.yOffset is not a function

Example in docs gives different output for `mark` field

The example in this repo's README says it will produce JSON with a "mark": "bar", field. When I run the example, however, this field outputs as:

"mark": {
   "type": "bar"
 }

Here's a reproduction: https://svelte.dev/repl/ff231e9d0f5f474082d5dbc73e040a64?version=3.57.0

Everything else seems correct. Here's the full output:

{
  "$schema": "https://vega.github.io/schema/vega-lite/v5.json",
  "mark": {
    "type": "bar"
  },
  "data": {
    "url": "data/movies.json"
  },
  "encoding": {
    "x": {
      "field": "IMDB_Rating",
      "type": "quantitative",
      "bin": true
    },
    "y": {
      "type": "quantitative",
      "aggregate": "count"
    }
  }
}

Vega-lite-api@5 breaks vl.tooltip with multiple fields

Encodings like:

  vl.tooltip([
    { field: 'totalMortality', format: '.2f', title: 'Total Martality' },
    { field: 'zoneName', title: 'Zone' },
    { field: 'crudeDeathRate', format: '.2%', title: 'Death Rate' },
    { field: 'morbidity', format: '.1f', title: 'Morbidity' }
  ]),

No longer works in Vega-lite-api@5, works fine in Vega-lite-api@4

Readme: Document functions like toView() and toSpec().

Seems that render(), toView(), toSpec() and toString() are not documented in README.md.

Also I have to write spec = vl.data().transform(...transforms) (forced to call data() before transform()) in order to use it with react-vega-lite as <VegaLite spec={spec} data={data} />.

References:

  • export async function render(opt) {
    opt = options({container: opt && opt.container || element()}, opt);
    const view = await createView(this, opt).runAsync(),
    div = view.container() || {};
    div.value = view;
    return div;
    }
    export function toView(opt) {
    return createView(this, options(opt));
    }
    export function toSpec() {
    return createSpec(this);
    }
    export function toString(space) {
    return JSON.stringify(createSpec(this), null, space);
    }
  • vega-lite-api/api/types.js

    Lines 396 to 401 in c84ccaf

    const callSpec = {
    render: {call: 'render', from: '__view__'},
    toView: {call: 'toView', from: '__view__'},
    toSpec: {call: 'toSpec', from: '__view__'},
    toString: {call: 'toString', from: '__view__'}
    };

why?

Introduction of this new vega-lite api is a bit confusing to me since we've explored this subject in deapth in other places.

Will it also include C# & java interfaces per my quick recon on that here:

https://github.com/RandomFractals/vega-lite-api

|| you are just rolling out your own again?

& what happened to us backing up Vizsla?

https://github.com/gjmcn/vizsla

Did you guys reach out to @gjmcn before you closed that long thread we had and created this new vega-lite js api repo?

Hmm... ๐Ÿค”

Confused by the predicate in `vl.color().condition()`

The docs for vl.color().condition() say:

A field definition or one or more value definition(s) with a parameter predicate.

I'm trying to replicate the point_invalid_color using Vega Lite API and based on the language in the doc I would have thought I would do:

vl.color().condition(
  'datum[\'IMDB Rating\'] === null || datum[\'Rotten Tomatoes Rating\'] === null',
  '#aaa'
)

That compiles to:

"color": {
  "condition": [
    "datum['IMDB Rating'] === null || datum['Rotten Tomatoes Rating'] === null"
    "#aaa"
  ]
}

I have to do this instead:

vl.color().condition({
  test: 'datum[\'IMDB Rating\'] === null || datum[\'Rotten Tomatoes Rating\'] === null',
  value: '#aaa'
})

Is this the desired API? If so, I would expect the docs to describe an object with keys of test and value.

Graphic-wide summarizing

Hello, I really appreciate all of your awesome work!

If I wanted to sum one of the fields in my data (or perform some other aggregate), and then add that sum to the text of my title, how would I do that using VL's API?

Currently, I'm importing d3-arrays and using it's methods to calculate these values outside the context of my marks. Which works fine.

Related question: Is it possible to access the datalib's methods via the VL API?

Thank you again.

.encode vs .encoding

Hi!

Not sure if this is an issue or not, but after working in the vl api for a while, and having failed to generate:

{ 
   encoding : { ... },
   layer: {...}
}

I just realize that you must do

vl
   .layer(...)
   .encoding(...)

This wasn't obvious to me because I was under the impression that in the vl-api one should use .encode() instead of .encoding(), because you use encode to define the encoding for marks.

Is there a reason for using .encoding for .layer instead of .encode ?

As context, I got into this by trying to translate the parallel coordinates example to the vl-api

https://observablehq.com/d/f41079165f8f8e8e

Also, it seems that for using .layer() and .encoding() you need to pass an object as in:

vl.layer(...)
   .encoding({ y: vl.y().value(0))

Leaving this here, in case someone else gets into this

Data transform before loading and getting dynamic data to display

Trying to get some dynamic server-side data to display. Currently 3-4000 records in JSON and CSV available. I started with:

https://observablehq.com/@vega/vega-lite-api#standalone_use

And tried getting things going.

Data says https://vega.github.io/vega-lite-api/api/data :

If the argument is a string, sets the url property.

I set datafile.json e.g. vl.data( 'datafile.json' ) - also tried with CSV. Same result.

Network shows that file is loaded. But graph still empty. Clues?

Also, CSV is ready for display - all columns named, but JSON data needs slight massage before processing. The key needs (re)naming.
Format is:

{
"162.243.136.184": {"lsf": 2733869240, "firstSeen": "2020-06-05T17:14:13.884582", "lastSeen": "2020-06-05T17:18:06.189240", "timesSeen": 6}, 
"66.229.102.180": {"lsf": 1122330292, "firstSeen": "2020-06-05T17:14:53.053523", "lastSeen": "2020-06-22T23:45:56.450999", "timesSeen": 8635},
...
}

CSV is like:

addr,lsf,firstSeen,lastSeen,timesSeen
193.254.245.162,3254711714,2020-08-27T22:10:56.918220,2020-08-27T22:20:44.575690,16
35.195.163.239,600024047,2020-08-27T23:01:52.380184,2020-08-27T23:33:04.532846,72
...

So I need to do something like:

return Object.entries(data).map((x) =>
  Object.assign({ ip: x[0] }, x[1]) )

Where would I most effectively place the above transform at load time to perform this? Is it currently possible? I tried other variants where I get a promise and do the transform in the vega.loader part of the options, but I could never get the data to load before render completes. Only after. ๐Ÿ˜ฆ

Some place to do deferred manipulation would be great, otherwise somewhere to name the columns in the data spec.

Here's what I have now using CSV, but graph shows no values. Just axes.

      vl.register(vega, vegaLite, options);
      vl.json( {type: "csv", url: "datafile.text"} )
      // now you can use the API!
      vl.markText({ tooltip: true , filled: true})
      .data( "datafile.text" )
      .encode(
        vl.y().fieldN('addr'),
        vl.x().fieldQ('timesSeen')
        )
        .render()
        .then(viewElement => {
          // render returns a promise to a DOM element containing the chart
          // viewElement.value contains the Vega View object instance
          document.getElementById('view').innerHTML = viewElement.innerHTML;
                  console.log('finished drawing');
        });
        console.log('loaded script body');

I realize now that I can supply a datasource name, e.g.
https://vega.github.io/vega-lite-api/api/csv
and later redraw, e.g. https://vega.github.io/vega-lite/tutorials/streaming.html but ... wanted to see what I can do with the API :)

use only parentheses in the API for everything, Curly braces are intimidating

just my first reaction reading some code from Observable
for example here

const axis = {
    domain: false,
    ticks: false,
    title: false,
    grid: true,
    gridColor: '#888',
    labelAngle: 0,
    labelPadding: 8,
    labelFontWeight: 'bold'
  };

can we use parentheses instead

same here

const lines = vl.markLine({
      strokeWidth: 1.5,
      opacity: 0.5
    })

and here
const domain = ['petalLength', 'petalWidth', 'sepalLength', 'sepalWidth'];

Using different fields for ordering and labeling

Hi,

My data looks like this:

[
 {'commit': 'a', 'timestamp': 1234, 'benchmark': 'b', 'value': 1}
 ...
]

I am trying to plot ordinal values on the x axis using a temporal scale (timestamps). This

  vl.markLine()
    .encode(
      vl.x()
        .fieldT('timestamp')
        .title("Commit")
        .axis({
          labelAngle: 90,
        }),
      vl.y().fieldQ('value').scale({ zero: false }).title("Run time (s)"),
      vl.color().fieldN('benchmark').title("Benchmark"),
      vl.tooltip().fieldN('commit')
    )

puts each point in its proper place. However the axis labels are the timestamps themselves. I would like to print the commit field instead, placed at the proper timestamp (thus possibly irregularly spaced). I have tried a few things such as defining a new scale for the axis and proving a list of values, or registering a new vega.expressionFunction and calling it from a labelExpr, without success. The labelExpr is passed objects with scaled values. The information loss prevents me from easily retrieving the proper label.

I am sure this can be done in vega/vega-lite as this sounds relatively trivial. However I could not figure it out by reading the docs or the examples.

Thanks!

Facet operator with repeat/layer

There seems to be a bug with the vega-lite-api. There doesn't seem to be a way of using the facet operator with a repeat/layer chart in its spec.

I want to make this facet then repeat-layer chart but using vega-lite-api:

{
  "data" : { "values": data } ,
  "facet" : { "field": "Ciudad", "type": "nominal" },  
  "spec" : {
    "repeat": {
      "layer": [ "Muertes No hacer nada", "Muertes Cuarentena" ]
    },
    "spec": {
      "mark": {
        "type": "line"
      },
      "encoding": {
        "x": { "field": "Fecha", "type": "temporal" },
        "y": { "field": { "repeat": "layer" }, "type": "quantitative" },
        "color": { "datum": { "repeat": "layer" }}
      }
    }
  }
}

So I'm trying with this:

vl.markLine()
    .encode(
    vl.x().fieldT("Fecha"),
    vl.y().fieldQ(vl.repeat("layer")),
    vl.color().datum(vl.repeat("layer")),
  )  
  .repeat({layer: ["Muertes No hacer nada", "Muertes Cuarentena"]})
  .facet(vl.fieldN("ciudad"))
  .data(data)
  .render()

And I get this error:

TypeError: vl.markLine(...).encode(...).repeat(...).facet is not a function

I have also tried switching the facet/repeat order but still can't get vega-lite-api to generate a spec that uses the facet operator.

More details with examples of the problem here:

https://observablehq.com/d/a4d527cf6b567011

Output Typescript Code

The code for generating the API could still be Javascript, since it only affects us.

However, a lot of people may want to use the output JS API in Typescript projects (which offer superior autocompletion than vanilla JS). Thus, it might be worth making sure that our output code is in TS.

cc: @domoritz

Example of how to use outside of Observable

I'm struggling a bit to figure out how to assemble a standard HTML page that uses vega-lite-api. The only examples I can find are inside Observable. It would be useful to have a minimal page that shows how this library could be used, outside of Observable.

This is the closest thing I have found: Vega-Lite Bl.ocks example. Even here, there's use of an additional library vega-embed that seems like it should not be needed.

Also, with a bit of work, this setup could be ported out of Observable I think: https://observablehq.com/@vega/vega-lite-api

How to use .projection method

I'm running into an issue trying to recreate the point_angle_windvector example here. I get the error:

 .markPoint({ shape: 'wedge', filled: true })
                 ^

TypeError: vl.projection(...).markPoint is not a function

This example shows a .project method instead of .projection but if I try that, I get an error. Any guidance on how to recreate this in Vega Lite API?

Recommend Projects

  • React photo React

    A declarative, efficient, and flexible JavaScript library for building user interfaces.

  • Vue.js photo Vue.js

    ๐Ÿ–– Vue.js is a progressive, incrementally-adoptable JavaScript framework for building UI on the web.

  • Typescript photo Typescript

    TypeScript is a superset of JavaScript that compiles to clean JavaScript output.

  • TensorFlow photo TensorFlow

    An Open Source Machine Learning Framework for Everyone

  • Django photo Django

    The Web framework for perfectionists with deadlines.

  • D3 photo D3

    Bring data to life with SVG, Canvas and HTML. ๐Ÿ“Š๐Ÿ“ˆ๐ŸŽ‰

Recommend Topics

  • javascript

    JavaScript (JS) is a lightweight interpreted programming language with first-class functions.

  • web

    Some thing interesting about web. New door for the world.

  • server

    A server is a program made to process requests and deliver data to clients.

  • Machine learning

    Machine learning is a way of modeling and interpreting data that allows a piece of software to respond intelligently.

  • Game

    Some thing interesting about game, make everyone happy.

Recommend Org

  • Facebook photo Facebook

    We are working to build community through open source technology. NB: members must have two-factor auth.

  • Microsoft photo Microsoft

    Open source projects and samples from Microsoft.

  • Google photo Google

    Google โค๏ธ Open Source for everyone.

  • D3 photo D3

    Data-Driven Documents codes.