![]()
This data analysis and visualization project aimed at presenting the work of OBA-Floripa (Organização Bem-Animal) NGO to authorities and the general population. The NGO has been taking care of cats and dogs from indigenous communities near Florianópolis since 2008, which improves people's life quality due to disease control, education and many other actions that create a healthier environment. The idea is to claim the need for continued funding resources, given the positive impact of the organization's activities on public health issues.
- Python (Pandas, Numpy, Regex, Pycaret)
- Excel
- Tableau
- Streamlit
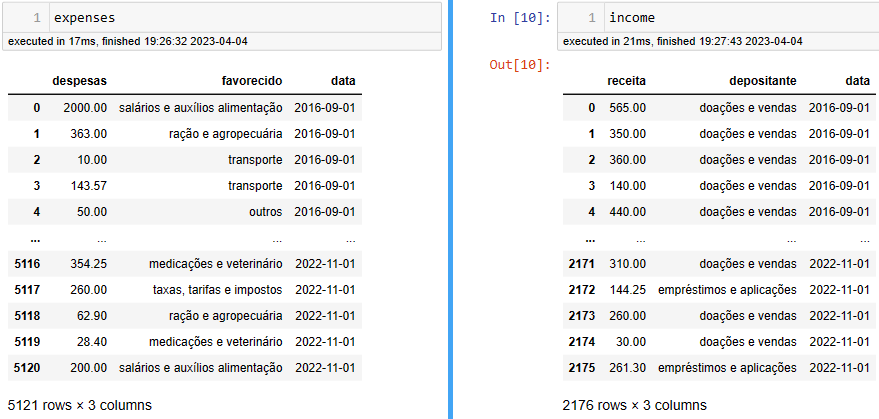
- An Excel file with financial information from the NGO was cleaned, manipulated and turned into a single dataframe;
- An Excel file with animal care information from the NGO was also cleaned and turned into another dataframe;
- 'income' and 'expenses' parts of the data were split into two separated dataframes;
- The following categories were created and applied for 'favorecido' in 'expenses': salário e auxílio alimentação, suprimentos, medicações e veterinários, hospedagem de animais, ração e agropecuárias, transporte, empréstimos e aplicações, divulgação/ gráficas e tecnologia, taxas e impostos, materiais para venda, outros;
- The following categories were created and applied for 'depositante' in 'income': doações e vendas, empréstimos e aplicações, projeto Autopista Litoral Sul, governo, outros;
- Data types were converted;
- Exploratory data analysis was made;
- Data was queried for metrics: total income and expenses/year, annual and monthly average income/source, annual and monthly average expenses/categories, total assisted animals, total treatments, treatments/animals and costs/animal;
- 'income', 'expenses' and 'care' were saved into Excel files;
- The new files were opened in Tableau and a dashboard was created with texts, images, cards and graphics for showing the metrics and other information;
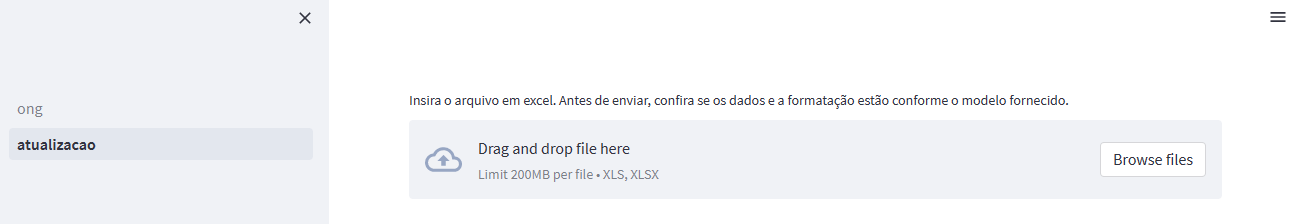
- The next steps for this project are the dashboard publication on Streamlit and the pipeline creation, so people from the NGO can update the dashboard values by adding an Excel file with new financion information to Streamlit.
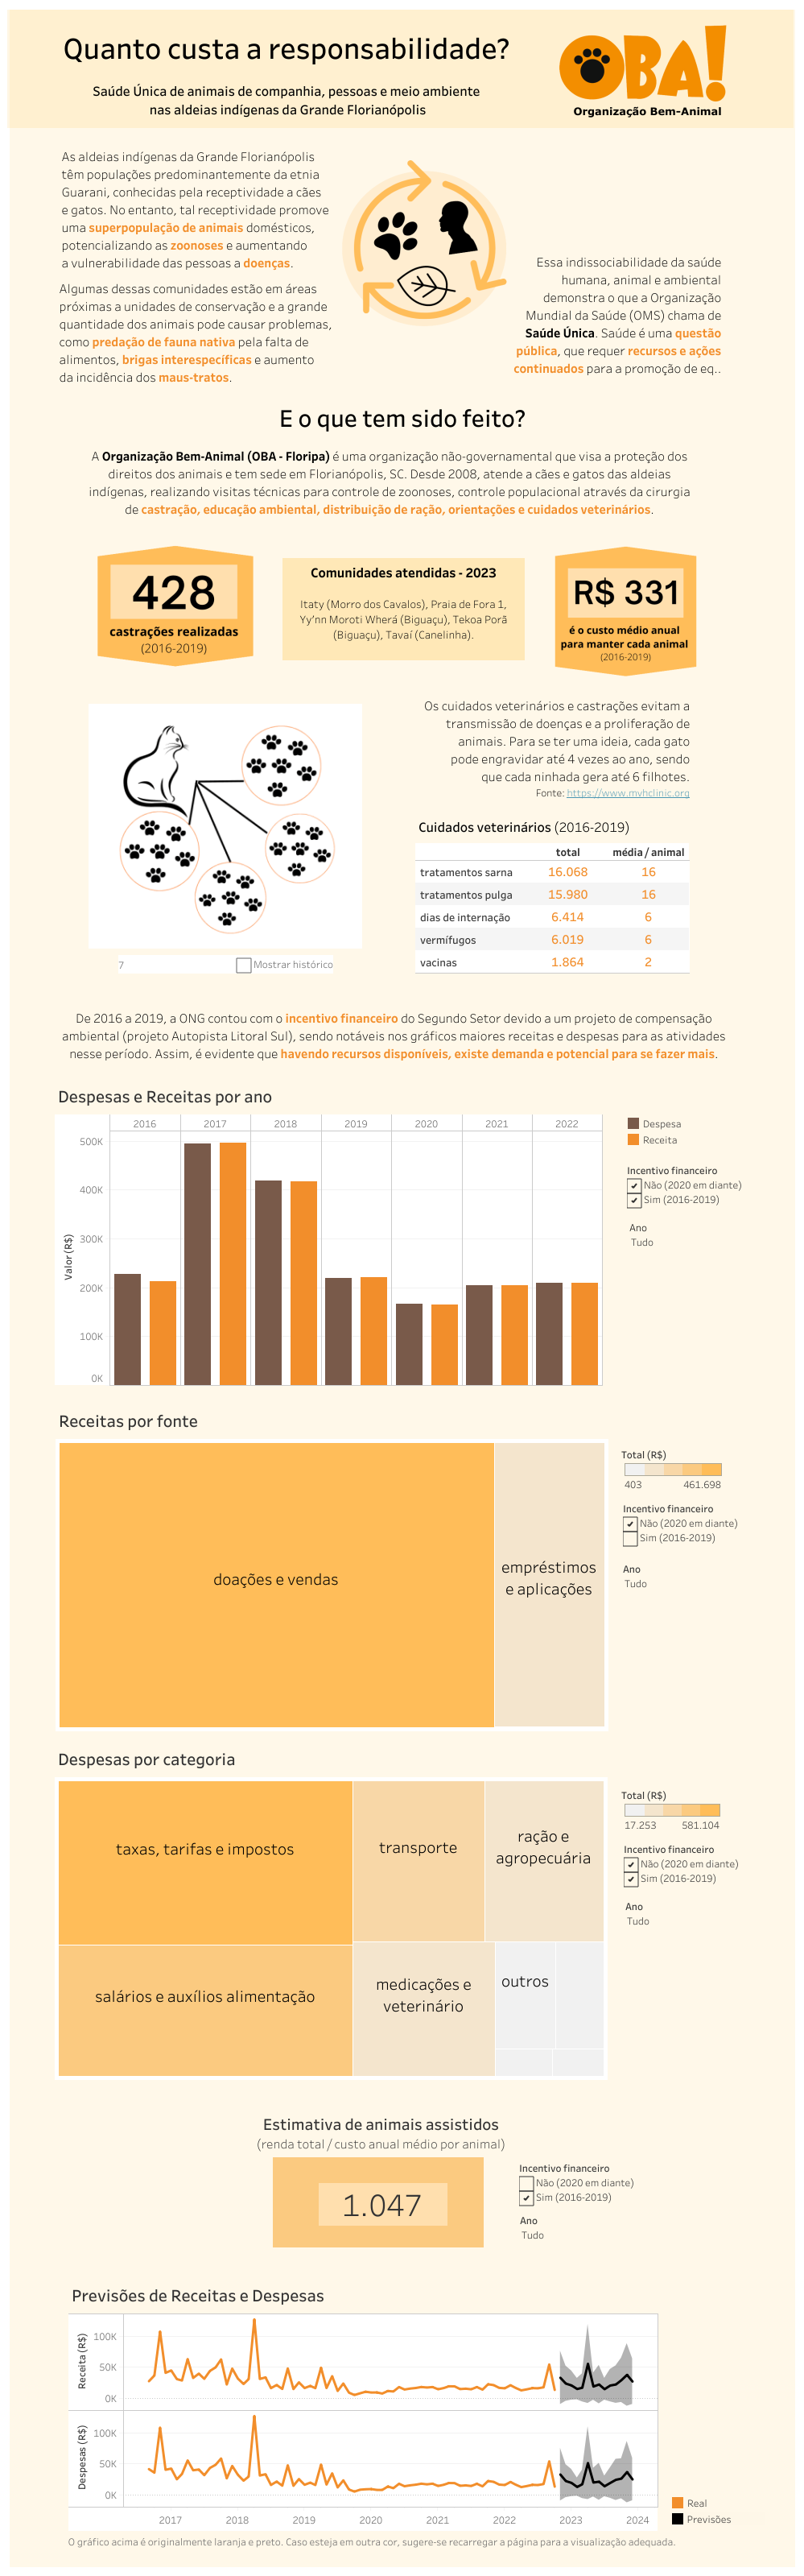
The final dashboard can be found on https://public.tableau.com/app/profile/vanessa.de.ara.jo.dechen/viz/NGO-DataAnalysis/Dashboardst?publish=yes and some conclusions can be drawn from it:
- 428 surgical castrations were made in cats and dogs (2016-2019), which prevents a super population of animals (each cat can have over 20 others in a year);
- R$ 331,00 was the average price to take care of each animal per year (2016-2019), which included a total average of 40 veterinary treatments, medications and vaccines per animal.
- During the time that the NGO got financial investments (2016-2019), much more income and expenses are noticed, so there is a lot more to be done if resources are available;
- When funding is not available, most of the NGO resources come from donations and product sales;
- Most of the NGO expenses are in taxes for the gorvernment, even though the organization develops a non-profitable public service;
- When funding resources were available, an average of 1047 animals could be assisted versus 601 when there was not enough money;
- A prediction graphic for expenses and income was added to the dashboard, but given the unusual financial activities between 2016-2019 it might take a few years until patterns from the regular financial activities can be interpreted by the model and displayed for better estimations.
- LinkedIn: vanessadechen
- GitHub: /vdechen
- Email: [email protected]

