Giter Club home page Giter Club logo

react-trend's Introduction

React Trend

React Trend


npm travis travis


Note: This project is no longer actively maintained.

Unfortunately, none of this project's authors have the time/enthusiasm to maintain this project right now. We recommend forking this project, or reading its source to learn how it's built).


Graphing tools are often complex, abstract, and heavy. They require domain-specific knowledge, and a significant time investment.

While building rich data visualizations for an analytics app, this is a necessary cost. But what if you just need a spark line that shows a trend?

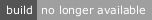
For example, here's how GitHub shows activity on a repo:

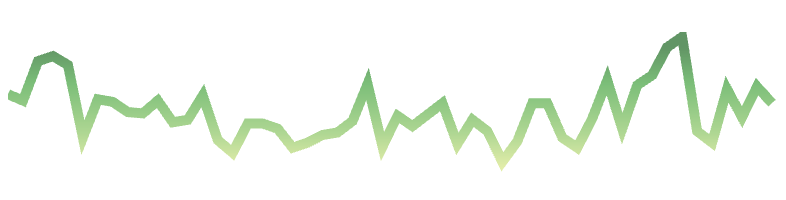
Here's how Twitter displays your recent analytics:

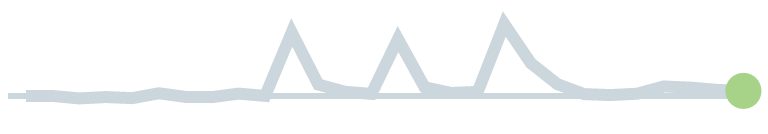
These are very simple and elegant visualizations, and they should not require a bloated graphing library to produce.

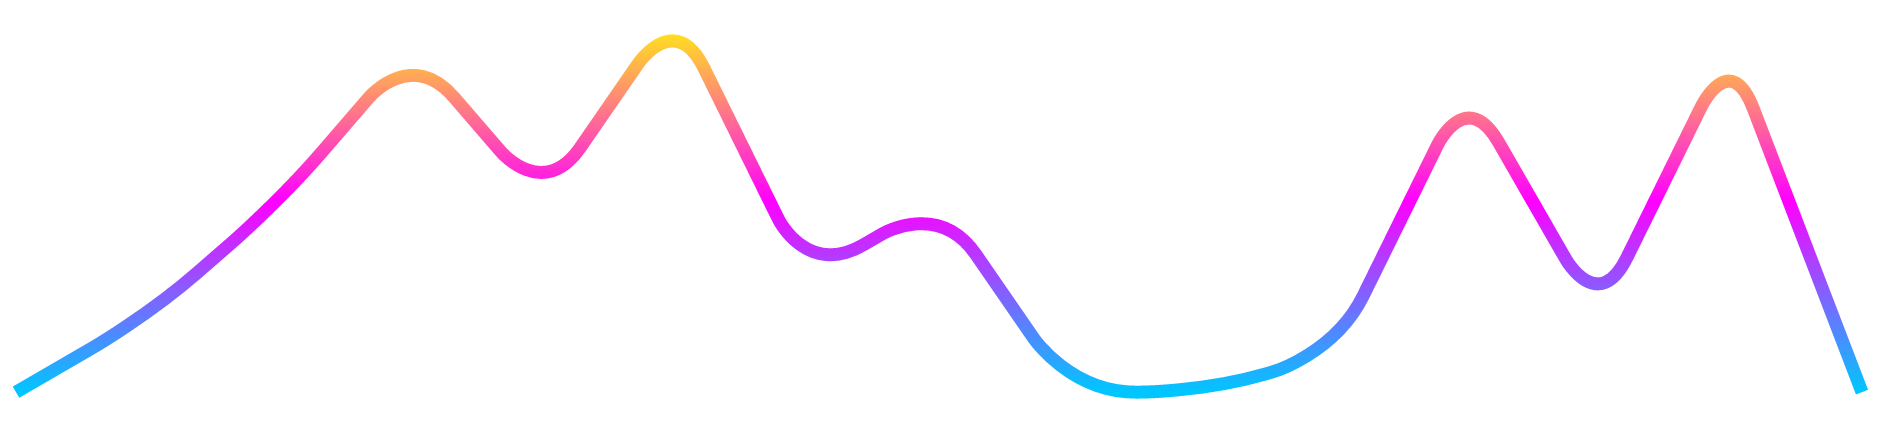
React Trend is a concrete component that does 1 thing, and does it well: generate these trending graphs.

Demo

Check out the React Trend playground.

Features

  • Simple. Integrate in seconds.
  • Scalable. Uses SVG for sharp, scalable graphs. Will fill the parent container, or you can provide a fixed size.
  • Beautiful. Built-in gradient support, and customizable smoothing.
  • Animatable. Support for on-mount animations where the trend graph draws from left to right.
  • Tiny. Zero-dependency, gzips to <3kb.

Installation

$ yarn add react-trend

# Alternatively:
$ npm i -S react-trend

UMD builds are also available via CDN:

UMD build exposes the component as Trend.

Quickstart

import Trend from 'react-trend';

const MyComponent = () => <Trend data={[0, 10, 5, 22, 3.6, 11]} />;

// That's it!
// You can, of course, customize it. Check out the API Reference below.
// Be sure to check out `autoDraw`, `gradient`, and `smoothing`.

API Reference

SVG Props

By default, all properties not recognized by React Trend will be delegated to the SVG. The line inherits these properties if none of its own override them.

This means that, among other properties, you can use:

  • stroke to set a solid colour,
  • strokeWidth to change the default line thickness,
  • strokeOpacity to create a transparent line,
  • strokeLinecap/strokeLinejoin to control the edges of your line,
  • strokeDasharray to create a dashed line, and
  • strokeDashoffset to control where the dashes start.

autoDraw

Type Required Default
Boolean โœ• false

Allow the line to draw itself on mount. Set to true to enable, and customize using autoDrawDuration and autoDrawEasing.

NOTE: This property uses strokeDasharray and strokeDashoffset under the hood to perform the animation. Because of this, any values you provide for those properties will be ignored.

Example
<Trend data={data} autoDraw autoDrawDuration={3000} autoDrawEasing="ease-in" />

autoDrawDuration

Type Required Default
Number โœ• 2000

The amount of time, in milliseconds, that the autoDraw animation should span.

This prop has no effect if autoDraw isn't set to true.

Example
<Trend data={data} autoDraw autoDrawDuration={3000} autoDrawEasing="ease-in" />

autoDrawEasing

Type Required Default
String โœ• ease

The easing function to use for the autoDraw animation. Accepts any transition timing function within the CSS spec (eg. linear, ease, ease-in, cubic-bezier...).

This prop has no effect if autoDraw isn't set to true.

Example
<Trend data={data} autoDraw autoDrawDuration={3000} autoDrawEasing="ease-in" />

data

Type Required Default
[Number|Object] โœ“ undefined

The data accepted by React Trend is incredibly simple: An array of y-axis values to graph.

React Trend takes care of normalization, so don't worry about ensuring the data is in a specific range.

This does mean that all data points will be evenly-spaced. If you have irregularly-spaced data, it will not be properly represented.

As of v1.2.0, you may supply an array of data objects with a value property.

Example
<Trend data={[120, 149, 193.4, 200, 92]} />
<Trend data={[{ value: 4 }, { value: 6 }, { value: 8 }]} />

gradient

Type Required Default
[String] โœ• undefined

React Trend supports vertical gradients. It accepts an array of 2+ colour values, and will fade evenly between them from the bottom up.

Colour can be specified as any SVG-supported format (named, rgb, hex, etc).

Example
<Trend gradient={['#0FF', '#F0F', '#FF0']} />

height

Type Required Default
Number โœ• undefined

Set an explicit height for your SVG. By default it ensures a 1:4 aspect ratio with the width, and the width expands to fill the container.

Note that in most cases it is sufficient to leave this blank, and just control the size of the parent container.

Example
<Trend width={200} height={200} />

padding

Type Required Default
Number โœ• 8

If you set a very large strokeWidth on your line, you may notice that it gets "cropped" towards the edges. This is because SVGs don't support overflow.

By increasing this number, you expand the space around the line, so that very thick lines aren't cropped.

In most cases you don't need to touch this value.

Example
<Trend strokeWidth={20} padding={18} />

radius

Type Required Default
Number โœ• 10

When using smoothing, you may wish to control the amount of curve around each point. For example, a 0 radius is equivalent to not having any smoothing at all, where an impossibly-large number like 10000 will ensure that each peak is as curved as it can possibly be.

This prop has no effect if smooth isn't set to true.

Example
<Trend smooth radius={20} strokeWidth={4} />

smooth

Type Required Default
Boolean โœ• false

Smooth allows the peaks to be 'rounded' out so that the line has no jagged edges.

By tweaking the radius prop, you can use this as a subtle prop to tone down the sharpness, or you can set a very high radius to create a snake-like line.

Example
<Trend smooth radius={20} strokeWidth={4} />

width

Type Required Default
Number โœ• undefined

Set an explicit width for your SVG. By default it ensures a 1:4 aspect ratio with the height, expanding to fill the width of the container.

Note that in most cases it is sufficient to leave this blank, and just control the width of the parent container.

Example
<Trend width={200} height={200} />

react-trend's People

Contributors

frontsideair avatar jaredpalmer avatar joshwcomeau avatar karol-majewski avatar thesharpieone avatar

Stargazers

 avatar  avatar  avatar  avatar  avatar  avatar  avatar  avatar  avatar  avatar  avatar  avatar  avatar  avatar  avatar  avatar  avatar  avatar  avatar  avatar  avatar  avatar  avatar  avatar  avatar  avatar  avatar  avatar  avatar  avatar  avatar  avatar  avatar  avatar  avatar  avatar  avatar  avatar  avatar  avatar  avatar  avatar  avatar  avatar  avatar  avatar  avatar  avatar  avatar  avatar  avatar  avatar  avatar  avatar  avatar  avatar  avatar  avatar  avatar  avatar  avatar  avatar  avatar  avatar  avatar  avatar  avatar  avatar  avatar  avatar  avatar  avatar  avatar  avatar  avatar  avatar  avatar  avatar  avatar  avatar  avatar  avatar  avatar  avatar  avatar  avatar  avatar  avatar  avatar  avatar  avatar  avatar  avatar  avatar  avatar  avatar  avatar  avatar  avatar  avatar

Watchers

 avatar  avatar  avatar  avatar  avatar  avatar  avatar  avatar  avatar  avatar  avatar  avatar  avatar  avatar  avatar  avatar  avatar  avatar  avatar  avatar  avatar  avatar  avatar  avatar  avatar  avatar

react-trend's Issues

Error when using with SSR

Steps to Reproduce

Observed Behaviour

  • Trend flashes and disappears and logs Expected server HTML to contain a matching <linearGradient> in <defs>. to console.

Image or video please.
untitled mov

Expected Behaviour

  • Trend animates and stays on page without an error

Errors when trend is flat

Steps to Reproduce

Put in data that is all the same

Observed Behaviour

Error: <path> attribute d: Expected number

Expected Behaviour

A flat line

Technical Notes

Can you please set the trend line to be flat (with no errors) if all values are the same or if there is a single value. Ideally you could set whether this should appear at the top, bottom, or middle of the graph.

Gradient props overwritten

Steps to Reproduce

When I have 2 Trend components the last one will overwrite the props gradient from the first one.

import React, { Component } from 'react';
import Trend from 'react-trend';

import './App.css';

export default class App extends Component {
  render() {
    return (
      <div className="container">
        <Trend
          smooth
          autoDraw
          autoDrawDuration={3000}
          autoDrawEasing="ease-out"
          data={[0, 2, 5, 9, 5, 10, 3, 5, 0, 0, 1, 8, 2, 9, 0]}
          gradient={['#DD0031', '#C3002F']}
          radius={10}
          strokeWidth={2.3}
          strokeLinecap={'round'}
          className="pos-absolute"
        />
        <Trend
          smooth
          autoDraw
          autoDrawDuration={3000}
          autoDrawEasing="ease-out"
          data={[2, 4, 10, 3, 1, 4, 9, 2, 3, 1, 6, 5, 5, 2, 7]}
          gradient={['#42b3f4']}
          radius={10}
          strokeWidth={2.3}
          strokeLinecap={'round'}
          className="pos-absolute"
        />
      </div>
    );
  }
}

Observed Behaviour

screen shot 2017-03-08 at 12 35 24 am

Expected Behaviour

Each component should have it's own gradient colors.

Technical Notes

Using:

  • React: 15.4.2
  • React-trend: 1.2.0

Events

Hi, first at all, nice job! I'm following this project months ago and I love it

I'm going to use it but first I need to know one thing

I was wondering if there is any way to show each point on the chart...

thank you!

Getting an error while using React Trend with React Starter Kit

Steps to Reproduce

<View> <Trend smooth autoDraw autoDrawDuration={3000} autoDrawEasing="ease-out" data={[0,2,5,9,5,10,3,5,0,0,1,8,2,9,0]} gradient={['#f72047', '#ffd200', '#1feaea']} radius={10} strokeWidth={2} strokeLinecap={'butt'} /> </View>

Observed Behaviour

Error
`Invariant Violation: Invariant Violation: View config not found for name stop. Make sure to start component names with a capital letter.

This error is located at:
in stop (created by Trend)
in linearGradient (created by Trend)
in defs (created by Trend)
in svg (created by Trend)
in Trend (at ComponentsScreen.js:230)
in RCTView (at View.js:44)
in RCTScrollContentView (at ScrollView.js:852)
in RCTScrollView (at ScrollView.js:977)
in ScrollView (at ComponentsScreen.js:33)
in ComponentsScreen (created by withState(ComponentsScreen))
in withState(ComponentsScreen) (created by Connect(withState(ComponentsScreen)))
in Connect(withState(ComponentsScreen)) (created by SceneView)
in SceneView (at createTabNavigator.js:39)
in RCTView (at View.js:44)
in ResourceSavingScene (at createBottomTabNavigator.js:113)
in RCTView (at View.js:44)
in ScreenContainer (at createBottomTabNavigator.js:103)
in RCTView (at View.js:44)
in TabNavigationView (at createTabNavigator.js:197)
in NavigationView (created by Navigator)
in Navigator (created by SceneView)
in SceneView (at StackViewLayout.js:793)
in RCTView (at View.js:44)
in AnimatedComponent (at StackViewCard.js:69)
in RCTView (at View.js:44)
in AnimatedComponent (at screens.native.js:59)
in Screen (at StackViewCard.js:57)
in Card (at createPointerEventsContainer.js:27)
in Container (at StackViewLayout.js:858)
in RCTView (at View.js:44)
in ScreenContainer (at StackViewLayout.js:311)
in RCTView (at View.js:44)
in AnimatedComponent (at StackViewLayout.js:307)
in Handler (at StackViewLayout.js:300)
in StackViewLayout (at withOrientation.js:30)
in withOrientation (at StackView.js:79)
in RCTView (at View.js:44)
in Transitioner (at StackView.js:22)
in StackView (created by Navigator)
in Navigator (at createKeyboardAwareNavigator.js:12)
in KeyboardAwareNavigator (at createAppContainer.js:388)
in NavigationContainer (at Navigation.js:10)
in NavigatorView (created by Connect(NavigatorView))
in Connect(NavigatorView) (at App.js:59)
in RCTView (at View.js:44)
in Provider (at App.js:56)
in App (at withExpoRoot.js:22)
in RootErrorBoundary (at withExpoRoot.js:21)
in ExpoRootComponent (at renderApplication.js:34)
in RCTView (at View.js:44)
in AppContainer (at renderApplication.js:33)

This error is located at:
in NavigationContainer (at Navigation.js:10)
in NavigatorView (created by Connect(NavigatorView))
in Connect(NavigatorView) (at App.js:59)
in RCTView (at View.js:44)
in Provider (at App.js:56)
in App (at withExpoRoot.js:22)
in RootErrorBoundary (at withExpoRoot.js:21)
in ExpoRootComponent (at renderApplication.js:34)
in RCTView (at View.js:44)
in AppContainer (at renderApplication.js:33)

node_modules/react-native/Libraries/Renderer/shims/ReactNativeViewConfigRegistry.js:95:8 in get
node_modules/react-native/Libraries/Renderer/oss/ReactNativeRenderer-dev.js:3954:53 in createInstance
... 17 more stack frames from framework internals`

Image or video please.

Expected Behaviour

Technical Notes

Add Typescript typings

Technical Notes

  • Have you ever thought about adding Typescript typings to your project? I would really appreciate it.

React Native compatibility

Hey,

I wanted to include this component in one of my React Native app but I can't manage to get it working ๐Ÿ˜”
I get the following error Expected a component class, got [object Object]

I used the code from the demo to be sure I wasn't using a bad prop or something.

Is this component not compatible with RN or am I doing something wrong ?

Thanks,

EDIT: I think it's because of the use of SVGs in the component. I'll check on how to use them on RN.

React dependency warning?

Steps to Reproduce

Add "react-trend": "^1.2.4" to package.json and npm i

Observed Behaviour

npm WARN [email protected] requires a peer of react@ but none is installed. You must install peer dependencies yourself.

Expected Behaviour

I have React installed already (16.4.2). I even tried npm i react again. Maybe it's due to the @? i.e. no version specified in the peerDependencies section.

How to set the background fill along with the stroke?

Hi bro, first of all thanks for making such an awesome graph component!

How can I give background fill color to the svg along with the stroke. I want to achieve something like this below:

react-trend

Any advice to proceed further?

Dot on the graph

Is it possible to draw a small dot on the graph to show a particular value ?

Errors when data array contains single value

Using this to display the mean ratings trend of seasonal shows, so the data is reset with new shows on the first day of each season - leaving only a single value in the array.

Steps to Reproduce

return <Trend data={[1]}/>

Observed Behaviour

  • Errors to console with nothing rendered in DOM (breaks rest of the component from being rendered)

Trend.js?81b8:67 Uncaught TypeError: Cannot read property 'getTotalLength' of undefined
    at Trend.componentDidMount (eval at <anonymous> (bundle.js:3852), <anonymous>:76:34)
    at eval (eval at <anonymous> (bundle.js:3342), <anonymous>:265:25)
    at measureLifeCyclePerf (eval at <anonymous> (bundle.js:3342), <anonymous>:75:12)
    at eval (eval at <anonymous> (bundle.js:3342), <anonymous>:264:11)
    at CallbackQueue.notifyAll (eval at <anonymous> (bundle.js:1819), <anonymous>:76:22)
    at ReactReconcileTransaction.close (eval at <anonymous> (bundle.js:3545), <anonymous>:80:26)
    at ReactReconcileTransaction.closeAll (eval at <anonymous> (bundle.js:1197), <anonymous>:206:25)
    at ReactReconcileTransaction.perform (eval at <anonymous> (bundle.js:1197), <anonymous>:153:16)
    at batchedMountComponentIntoNode (eval at <anonymous> (bundle.js:1875), <anonymous>:126:15)
    at ReactDefaultBatchingStrategyTransaction.perform (eval at <anonymous> (bundle.js:1197), <anonymous>:140:20)

Expected Behaviour

  • A flat line or no graph

Recommend Projects

  • React photo React

    A declarative, efficient, and flexible JavaScript library for building user interfaces.

  • Vue.js photo Vue.js

    ๐Ÿ–– Vue.js is a progressive, incrementally-adoptable JavaScript framework for building UI on the web.

  • Typescript photo Typescript

    TypeScript is a superset of JavaScript that compiles to clean JavaScript output.

  • TensorFlow photo TensorFlow

    An Open Source Machine Learning Framework for Everyone

  • Django photo Django

    The Web framework for perfectionists with deadlines.

  • D3 photo D3

    Bring data to life with SVG, Canvas and HTML. ๐Ÿ“Š๐Ÿ“ˆ๐ŸŽ‰

Recommend Topics

  • javascript

    JavaScript (JS) is a lightweight interpreted programming language with first-class functions.

  • web

    Some thing interesting about web. New door for the world.

  • server

    A server is a program made to process requests and deliver data to clients.

  • Machine learning

    Machine learning is a way of modeling and interpreting data that allows a piece of software to respond intelligently.

  • Game

    Some thing interesting about game, make everyone happy.

Recommend Org

  • Facebook photo Facebook

    We are working to build community through open source technology. NB: members must have two-factor auth.

  • Microsoft photo Microsoft

    Open source projects and samples from Microsoft.

  • Google photo Google

    Google โค๏ธ Open Source for everyone.

  • D3 photo D3

    Data-Driven Documents codes.