Giter Club home page Giter Club logo

histo's Introduction

Histo

Plot charts in the terminal with arbitrary streaming or non-streaming data.

$ histo < data.txt

terminal histogram

Features

  • simple input via stdin
  • simple C API for integration in your tools
  • supports static or streaming data
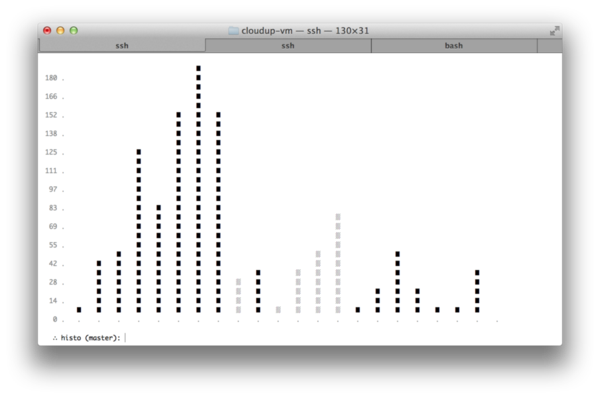
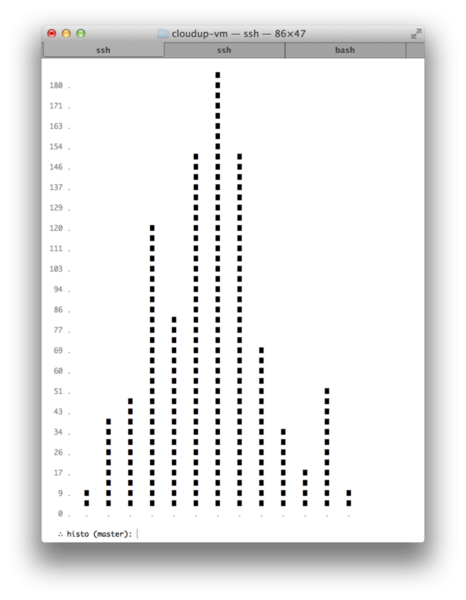
  • adjusts to terminal width and height
  • adjusts x-axis labels to the integer size
  • negative values reflect as shaded blocks

Use-cases

  • cpu usage
  • memory usage
  • load averages
  • ...

Installation

With cpm:

$ cpm install visionmedia/histo

Or via git clone:

$ cd /tmp && git clone git://github.com/visionmedia/histo.git --depth 1 && cd histo && make install

Examples

histo(1) simply reads from stdin, so it works well with streaming or non-streaming data, from any data source. This repo includes some example files in ./examples, as well as some example shell scripts for streaming input.

Static input

histo(1) simply reads from stdin, so it's easy to throw static data at it for quick analysis:

1
4
5
12
8
15
18
20
5
2
1
5
2
10
2

Displayed with:

$ histo < example.txt

Dynamic input

You may stream data to histo(1) and tell it to quit with EOF, for example here's a small shell script to generate some random data:

while true; do
  echo $RANDOM
  sleep .5
done | histo

Screenshots

Negative values are shown as shaded blocks:

histogram with negative values

Adjusts properly to the size of the terminal:

size adjustment

tall

License

MIT

histo's People

Contributors

jblaine avatar tj avatar

Stargazers

 avatar  avatar  avatar  avatar  avatar  avatar  avatar  avatar  avatar  avatar  avatar  avatar  avatar  avatar  avatar  avatar  avatar  avatar  avatar  avatar  avatar  avatar  avatar  avatar  avatar  avatar  avatar  avatar  avatar  avatar  avatar  avatar  avatar  avatar  avatar  avatar  avatar  avatar  avatar  avatar  avatar  avatar  avatar  avatar  avatar  avatar  avatar  avatar  avatar  avatar  avatar  avatar  avatar  avatar  avatar  avatar  avatar  avatar  avatar  avatar  avatar  avatar  avatar  avatar  avatar  avatar  avatar  avatar  avatar  avatar  avatar  avatar  avatar  avatar  avatar  avatar  avatar  avatar  avatar  avatar  avatar  avatar  avatar  avatar  avatar  avatar  avatar  avatar  avatar  avatar  avatar  avatar  avatar  avatar  avatar  avatar  avatar  avatar  avatar  avatar

Watchers

 avatar  avatar  avatar  avatar  avatar  avatar  avatar  avatar  avatar  avatar  avatar  avatar  avatar  avatar  avatar  avatar  avatar  avatar  avatar  avatar  avatar  avatar  avatar  avatar  avatar  avatar  avatar

histo's Issues

Homebrew Formula?

Hey! This is gorgeous and amazing. Thoughts on a formula for homebrew?

Something like this:

require 'formula'

class Histo < Formula
  homepage 'https://github.com/visionmedia/histo'
  url 'https://github.com/visionmedia/histo/tarball/0.0.1'
  sha1 '3398f6d94bdbdb6f0112e77b61d9c2d6ae1facd1'

  def install
    system "make install"
  end
end

Negative values below the x-axis?

Hi,

Any chance you could rescale the x-axis so negatives are below. I like your implementation, but shading in negative values just isn't cool.

fix x-axis overflow

needs to carry over back to the left, and we need to indicate old values with light gray shaded blocks or similar

Terminal messed up

Hi, I like the idea of histo very much, although I can't get it to work properly. It only outputs weird characters on my terminals (iTerm2). Like this:

2;20;f█-53;20;f█-54;20;f█-55;20;f█-56;20;f█-57;20;f█-58;20;f█-59;20;f█

Any idea what is wrong?

Question: Bar graph generator or histogram?

This seems to generate a single bar for every data element in the input file, essentially a bar graph generator. A histogram buckets the data into groups (0 - 10 == bucket 1, 11 - 20 == bucket 2, etc) and then plots bars for every bucket giving you a idea of the distribution of the values in your dataset.

Column sizes wrong

Hi, so there is a somewhat serious problem here. If x is the value, m is the max value in our input file, mb is the number of blocks (the character used to generate the bars) associated with m for a given window size, and xb is the number of blocks associated with x for the same window size, we want that

x/m = xb/mb

However, if m=6, x=1, and mb=100, we can't satisfy xb with an integer value. As the window size gets smaller, this issue becomes more apparent (you'll sometimes have 4 blocks for the value 1, but 9 blocks for the value 2). There are a couple possible solutions to this issue, but I'm not sure which approach is best, so I'd like your thoughts:
-have variable sized blocks for the very top block (not sure how we would do it, as currently our blocks are a char)
-have variable y-padding, again to try to make this equation hold with integers
-use some kind of fill/paint that just colors a region entirely

Recommend Projects

  • React photo React

    A declarative, efficient, and flexible JavaScript library for building user interfaces.

  • Vue.js photo Vue.js

    🖖 Vue.js is a progressive, incrementally-adoptable JavaScript framework for building UI on the web.

  • Typescript photo Typescript

    TypeScript is a superset of JavaScript that compiles to clean JavaScript output.

  • TensorFlow photo TensorFlow

    An Open Source Machine Learning Framework for Everyone

  • Django photo Django

    The Web framework for perfectionists with deadlines.

  • D3 photo D3

    Bring data to life with SVG, Canvas and HTML. 📊📈🎉

Recommend Topics

  • javascript

    JavaScript (JS) is a lightweight interpreted programming language with first-class functions.

  • web

    Some thing interesting about web. New door for the world.

  • server

    A server is a program made to process requests and deliver data to clients.

  • Machine learning

    Machine learning is a way of modeling and interpreting data that allows a piece of software to respond intelligently.

  • Game

    Some thing interesting about game, make everyone happy.

Recommend Org

  • Facebook photo Facebook

    We are working to build community through open source technology. NB: members must have two-factor auth.

  • Microsoft photo Microsoft

    Open source projects and samples from Microsoft.

  • Google photo Google

    Google ❤️ Open Source for everyone.

  • D3 photo D3

    Data-Driven Documents codes.