Giter Club home page Giter Club logo

stats-maths-with-python's Introduction

Statistics/ Mathematical Computing Notebooks

Jupyter Notebooks on the topics of statistical analysis, mathematics, and numerical/sceintific computing (in Python).

Please feel free to connect with me on LinkedIn if you are interested in data science and like to connect.


Requirements

  • Python 3.6+
  • NumPy ($ pip install numpy)
  • Pandas ($ pip install pandas)
  • Scikit-learn ($ pip install scikit-learn)
  • SciPy ($ pip install scipy)
  • Statsmodels ($ pip install statsmodels)
  • MatplotLib ($ pip install matplotlib)
  • Seaborn ($ pip install seaborn)

set

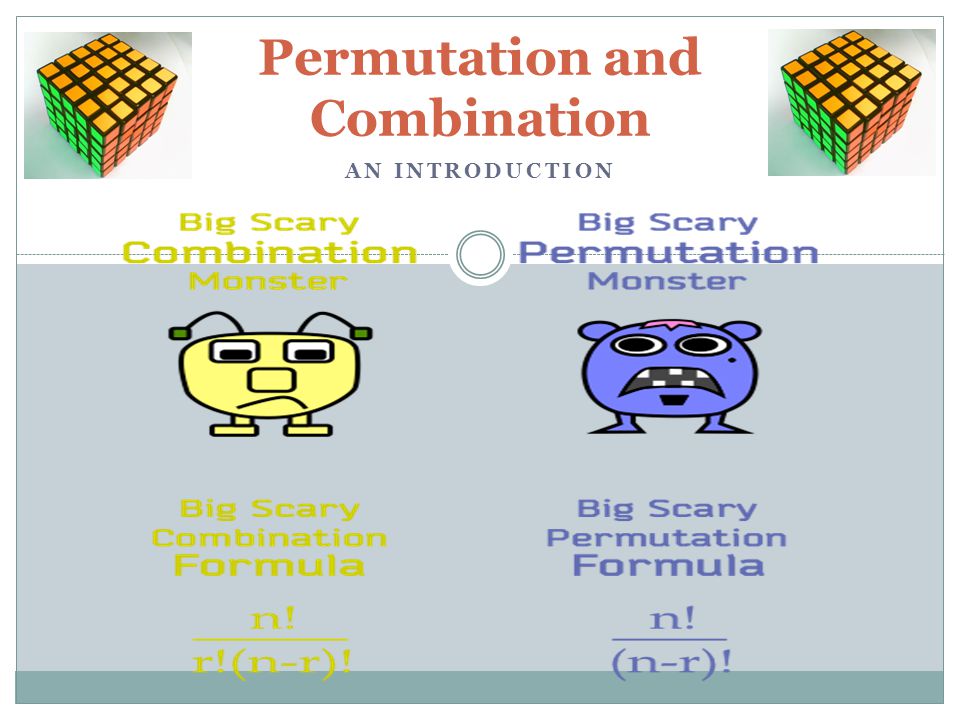
permutation and combination

binom

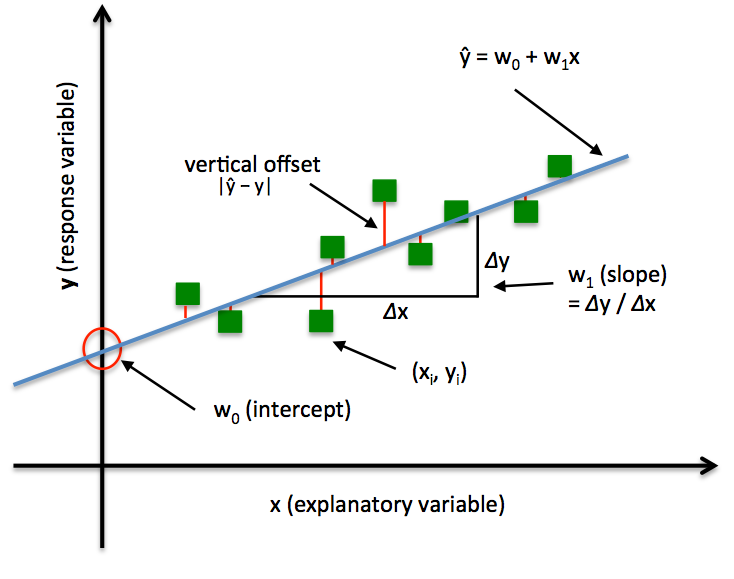
lm

rstyle

Articles

Check out this article I wrote on Medium: Essential Math for Data Science.

Check out this article I wrote on Medium about "How to write your favorite R functions — in Python?"

Check out this article I wrote on Medium about "Mathematical programming — a key habit to build up for advancing in data science?"

Check out this article I wrote on Medium about "Bayes’ rule with a simple and practical example"

Check out this article I wrote on Medium about "Statistical modeling with “Pomegranate” — fast and intuitive"

stats-maths-with-python's People

Contributors

tirthajyoti avatar

Stargazers

 avatar  avatar  avatar  avatar  avatar  avatar  avatar  avatar  avatar  avatar  avatar  avatar  avatar  avatar  avatar  avatar  avatar  avatar  avatar  avatar  avatar  avatar  avatar  avatar  avatar  avatar  avatar  avatar  avatar  avatar  avatar  avatar  avatar  avatar  avatar  avatar  avatar  avatar  avatar  avatar  avatar  avatar  avatar  avatar  avatar  avatar  avatar  avatar  avatar  avatar  avatar  avatar  avatar  avatar  avatar  avatar  avatar  avatar  avatar  avatar  avatar  avatar  avatar  avatar  avatar  avatar  avatar  avatar  avatar  avatar  avatar  avatar  avatar  avatar  avatar  avatar  avatar  avatar  avatar  avatar  avatar  avatar  avatar  avatar  avatar  avatar  avatar  avatar  avatar  avatar  avatar  avatar  avatar  avatar  avatar  avatar  avatar  avatar  avatar  avatar

Watchers

 avatar  avatar  avatar  avatar  avatar  avatar  avatar  avatar  avatar  avatar  avatar  avatar  avatar  avatar  avatar  avatar  avatar  avatar  avatar  avatar  avatar  avatar  avatar  avatar  avatar  avatar  avatar  avatar  avatar  avatar  avatar  avatar  avatar  avatar  avatar  avatar  avatar

stats-maths-with-python's Issues

Question regarding formulation of Brownian Motion in Python

I came across this repo as i try to understand in detail how the generation of sampels from a Brownian motion works with python.

A question arised as i took a look into the Brownian-motion-with-Python.ipynb Notebook. The gen_normal() method defined in the Brownian class is there defined as follows:

def gen_normal(self,n_step=100):
        """
        Generate motion by drawing from the Normal distribution
        
        Arguments:
            n_step: Number of steps
            
        Returns:
            A NumPy array with `n_steps` points
        """
        if n_step < 30:
            print("WARNING! The number of steps is small. It may not generate a good stochastic process sequence!")
        
        w = np.ones(n_step)*self.x0
        
        for i in range(1,n_step):
            # Sampling from the Normal distribution
            yi = np.random.normal()
            # Weiner process
            w[i] = w[i-1]+(yi/np.sqrt(n_step))
        
        return w

Why are we scaling the sampels from the normal distribution yi by the factor 1/np.sqrt(n_step)? I am wondering, since in other exampels that show the sampling from a geometric brownian motion the increments of the wiener process are defined by np.random.normal(0, np.sqrt(dt), size=(len(sigma), n)).T and thus the scaling is refering to the increment of the time step (see the example given in Wikipedia ). In this code it appears that the scaling is defined by the total number of time steps.

Recommend Projects

  • React photo React

    A declarative, efficient, and flexible JavaScript library for building user interfaces.

  • Vue.js photo Vue.js

    🖖 Vue.js is a progressive, incrementally-adoptable JavaScript framework for building UI on the web.

  • Typescript photo Typescript

    TypeScript is a superset of JavaScript that compiles to clean JavaScript output.

  • TensorFlow photo TensorFlow

    An Open Source Machine Learning Framework for Everyone

  • Django photo Django

    The Web framework for perfectionists with deadlines.

  • D3 photo D3

    Bring data to life with SVG, Canvas and HTML. 📊📈🎉

Recommend Topics

  • javascript

    JavaScript (JS) is a lightweight interpreted programming language with first-class functions.

  • web

    Some thing interesting about web. New door for the world.

  • server

    A server is a program made to process requests and deliver data to clients.

  • Machine learning

    Machine learning is a way of modeling and interpreting data that allows a piece of software to respond intelligently.

  • Game

    Some thing interesting about game, make everyone happy.

Recommend Org

  • Facebook photo Facebook

    We are working to build community through open source technology. NB: members must have two-factor auth.

  • Microsoft photo Microsoft

    Open source projects and samples from Microsoft.

  • Google photo Google

    Google ❤️ Open Source for everyone.

  • D3 photo D3

    Data-Driven Documents codes.