Giter Club home page Giter Club logo

heatmap's Introduction

Java Heat Map

A Heat Map is a common visualization method for viewing the values of a two-dimensional map. There are numerous ways to do three-dimensional graphing and charting, but in my humble opinion, at times it can be difficult to see all the essential details without being able to rotate the 3D chart. I like heat maps for visualizing this kind of data, as the top-down, color-based view doesn't hide any information.

I (along with the help of a few others) have created an easy-to-use Java class that draws heat maps in a JPanel. It should be easy to add into another project of your own. The range of X- and Y-coordinates are only used when drawing the labels on the axis, and do not affect the range of data that is plotted. All data in the array is plotted. You can turn on and off the title, both axis' labels, and the legend. There are a number of color gradients available, and you can always create your own by specifying an array of Color objects.

Data is provided to the HeatMap code in the form of a 2-dimensional array of doubles. The code is configurable to accept data with the y=0 row at either the top or bottom of the display, depending on if you prefer the computer graphics coordinate system, or the standard mathematical coordinate system.

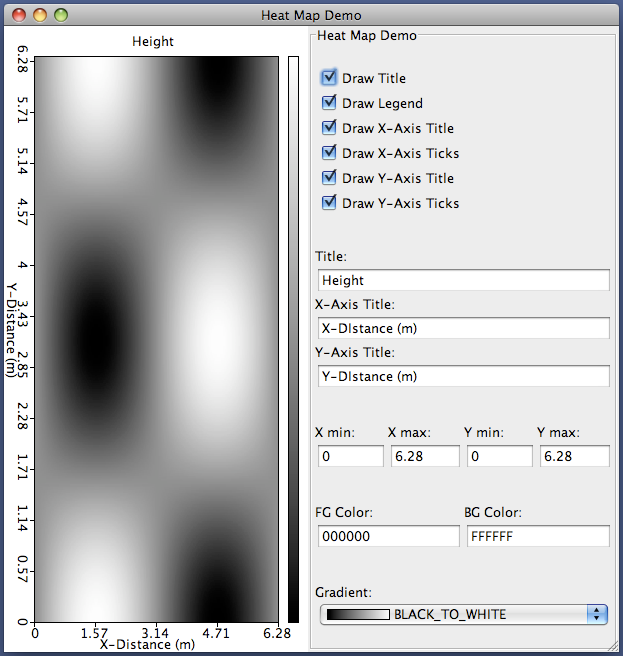
A simple GUI application has been created (HeatMapDemo) that demonstrates the features of the HeatMap, and can be used to play around with most of the different options for the HeatMap. This demo program is included with the source code.

JavaDoc

Javadoc of the API is located here: http://www.mbeckler.org/heatMap/javadoc/index.html?HeatMap.html

More details here:

http://www.mbeckler.org/heatMap/

heatmap's People

Contributors

matthewbeckler avatar

Watchers

James Cloos avatar

Recommend Projects

  • React photo React

    A declarative, efficient, and flexible JavaScript library for building user interfaces.

  • Vue.js photo Vue.js

    ๐Ÿ–– Vue.js is a progressive, incrementally-adoptable JavaScript framework for building UI on the web.

  • Typescript photo Typescript

    TypeScript is a superset of JavaScript that compiles to clean JavaScript output.

  • TensorFlow photo TensorFlow

    An Open Source Machine Learning Framework for Everyone

  • Django photo Django

    The Web framework for perfectionists with deadlines.

  • D3 photo D3

    Bring data to life with SVG, Canvas and HTML. ๐Ÿ“Š๐Ÿ“ˆ๐ŸŽ‰

Recommend Topics

  • javascript

    JavaScript (JS) is a lightweight interpreted programming language with first-class functions.

  • web

    Some thing interesting about web. New door for the world.

  • server

    A server is a program made to process requests and deliver data to clients.

  • Machine learning

    Machine learning is a way of modeling and interpreting data that allows a piece of software to respond intelligently.

  • Game

    Some thing interesting about game, make everyone happy.

Recommend Org

  • Facebook photo Facebook

    We are working to build community through open source technology. NB: members must have two-factor auth.

  • Microsoft photo Microsoft

    Open source projects and samples from Microsoft.

  • Google photo Google

    Google โค๏ธ Open Source for everyone.

  • D3 photo D3

    Data-Driven Documents codes.