I encountered some problems with dynamic UI (created using renderUI or insertUI/removeUI) and dispose of previous charts in Shiny. The values of the charts are used to fill tables created using DT::renderDataTable and therefore the use of renderUI is necessary to show contemporary dynamically created datatables and graphs.
According to my experience, it is like that previous charts are not always disposed and therefore they stop the rendering of new ones.
In fact, after a query a new UI is recreated (renderUI) or inserted (insertUI) but very often graphs (especially if the ID is the same) are not rendered, even if the DIV is closed and reopened. The same will not occur using plot_ly .
The only way (and not in all the cases) I found to overpass this limitation is to pass to renderUI the datatable and amChart as a list without using amChart4Output, but than I had other problems, i.e. reactive values linked to amCharts (e.g. input[["linecharts"]] and used as datasets in the tables were not updated.
See a short (datatable and charts are not linked here) reproducible example as follow (just try to create different UI, remove one or all of them and recreate with the same ID).
Thank you in advance for your help and suggestions,
Kind regards
# handle the case when user does not provide ID
divID <- if (input$divID == "") gsub("\\.", "", format(Sys.time(), "%H%M%OS3"))
else input$divID
dtID <- paste0(divID, "DT")
dt2ID <- paste0(divID, "DT2")
btnID <- paste0(divID, "rmv")
plotlyID <- paste0(divID, "plotly")
amChartID <- paste0(divID, "amChart")
# only create button if there is none
if (is.null(rv[[divID]])) {
# output$prova <- renderUI({
# plotlist <- list(
# actionButton("download", "button1", class = "pull-right btn btn-danger"),
# actionButton("upload", "button2", class = "pull-right btn btn-danger"),
# actionButton("modify", "button3", class = "pull-right btn btn-danger"),
# actionButton(btnID, "Remove this UI", class = "pull-right btn btn-danger"),
# DT::dataTableOutput(dtID),
# DT::dataTableOutput(dt2ID),
# plotlyOutput(plotlyID),
# amChart4Output(amChartID, height = "500px"),
# hr()
# )
# do.call(tagList, plotlist)
# })
insertUI(
selector = "#placeholder",
ui = tags$div(id = divID,
actionButton("download", "button1", class = "pull-right btn btn-danger"),
actionButton("upload", "button2", class = "pull-right btn btn-danger"),
actionButton("modify", "button3", class = "pull-right btn btn-danger"),
actionButton(btnID, "Remove this UI", class = "pull-right btn btn-danger"),
DT::dataTableOutput(dtID),
DT::dataTableOutput(dt2ID),
plotlyOutput(plotlyID),
amChart4Output(amChartID, height = "500px"),
hr()
)
)
output[[dtID]] <- DT::renderDataTable(head(iris))
output[[dt2ID]] <- DT::renderDataTable(head(cars))
output[[plotlyID]] <- renderPlotly(
plot_ly(data = cars, x= ~speed, y = ~dist)
)
output[[amChartID]] <- renderAmChart4({
amBarChart(
data = dat2,
data2 = dat2,
width = "600px",
category = "country", values = "visits",
draggable = TRUE,
tooltip =
"[bold font-style:italic #ffff00]{valueY.value.formatNumber('#,###.')}[/]",
chartTitle =
amText(text = "Visits per country", fontSize = 22, color = "orangered"),
xAxis = list(title = amText(text = "Country", color = "maroon")),
yAxis = list(
title = amText(text = "Visits", color = "maroon"),
gridLines = amLine(color = "orange", width = 1, opacity = 0.4)
),
yLimits = c(0, 4000),
valueFormatter = "#,###.",
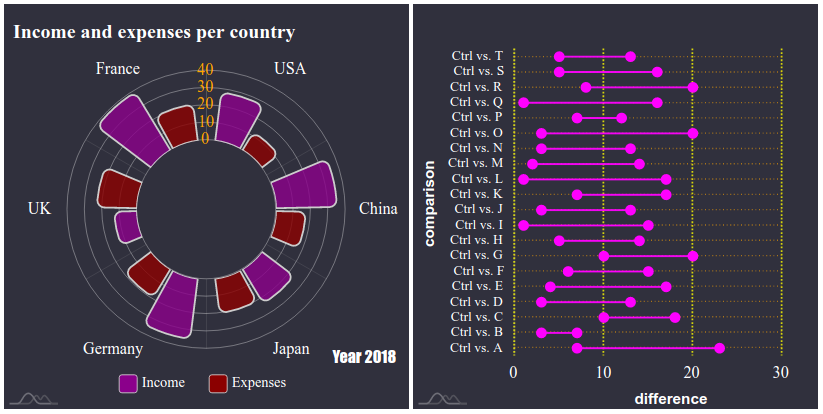
caption = amText(text = "Year 2018", color = "red"),
theme = "material")
})
# make a note of the ID of this section, so that it is not repeated accidentally
rv[[divID]] <- TRUE
# create a listener on the newly-created button that will
# remove it from the app when clicked
observeEvent(input[[btnID]], {
removeUI(selector = paste0("#", divID))
rv[[divID]] <- NULL
}, ignoreInit = TRUE, once = TRUE)
# otherwise, print a message to the console
} else {
message("The button has already been created!")
}