Make a consistent mesh from a polygon soup.
![]()
A polygon soup is a set of unorganized polygons. For example, define a tetrahedron as follows:
vertices <- rbind(
  c(-1, -1, -1),
  c( 1,  1, -1),
  c( 1, -1,  1),
  c(-1,  1,  1)
)
faces <- rbind(
  c(1, 2, 3),
  c(3, 4, 2),
  c(4, 2, 1),
  c(4, 3, 1)
)
Now plot it by painting the front of its faces in blue and the back of its faces in red; then both colors appear:
library(rgl)
tmesh <- tmesh3d(
  vertices    = t(vertices),
  indices     = t(faces),
  homogeneous = FALSE
)
shade3d(tmesh, color = "blue", back = "cull")
shade3d(tmesh, color = "red", front = "cull")
To get a mesh with coherently oriented faces, use the Mesh function:
library(PolygonSoup)
mesh  <- Mesh(vertices, faces, normals = FALSE)
tmesh <- toRGL(mesh)
shade3d(tmesh, color = "blue", back = "cull")
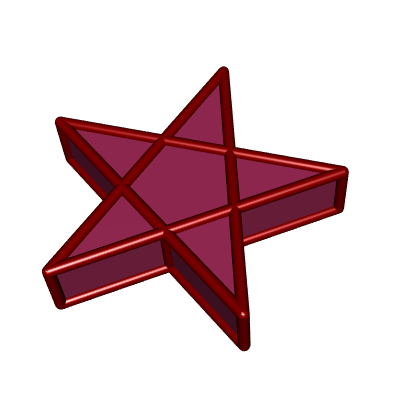
The PolygonSoup package can deal with polygon soups whose polygons have any number of sides. For example, consider a pentagrammic prism:
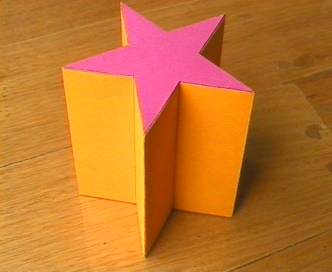
The vertices and the faces of a pentagrammic prism are given in the package,
in a list named PentagrammicPrism. Two faces, at the center of the two
pentagramms, are pentagonal. Therefore one cannot directly plot the prism with
rgl. The Mesh function allows to triangulate the faces:
mesh <- Mesh(
mesh = pentagrammicPrism,
triangulate = TRUE, normals = FALSE
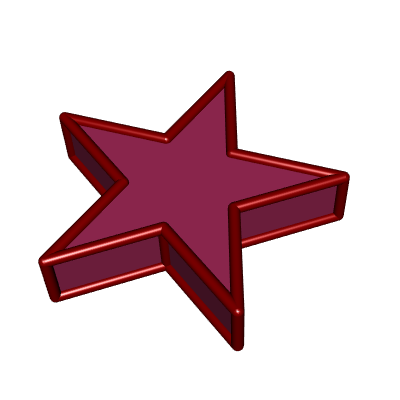
)Now we can plot the pentagrammic prism. We can also plot its edges with the
help of the plotEdges function:
tmesh <- toRGL(mesh)
shade3d(tmesh, color = "maroon")
plotEdges(
  mesh[["vertices"]], mesh[["edges"]], color = "darkred",
  tubesRadius = 0.02, spheresRadius = 0.02
)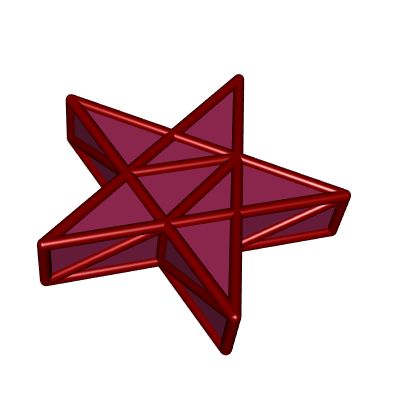
The triangulation introduces additional edges, and you probably don't want to
see them. In mesh[["edges0"]], one has the edges before the triangulation:
shade3d(tmesh, color = "maroon")
plotEdges(
  mesh[["vertices"]], mesh[["edges0"]], color = "darkred",
  tubesRadius = 0.02, spheresRadius = 0.02
)
One can also plot only the exterior edges, that is to say the edges which are not between two coplanar faces:
shade3d(tmesh, color = "maroon")
plotEdges(
  mesh[["vertices"]], mesh[["exteriorEdges"]], color = "darkred",
  tubesRadius = 0.02, spheresRadius = 0.02
)
This package is provided under the GPL-3 license but it uses the C++ library CGAL. If you wish to use CGAL for commercial purposes, you must obtain a license from the GeometryFactory.