Giter Club home page Giter Club logo

pybindingcurve's Introduction

PyBindingCurve

Shave, Steven, et al. "PyBindingCurve, simulation, and curve fitting to complex binding systems at equilibrium." Journal of Chemical Information and Modeling (2021). https://doi.org/10.1021/acs.jcim.1c00216

PyBindingCurve is a Python package for simulation, plotting and fitting of experimental parameters to protein-ligand binding systems at equilibrium. In simple terms, the most basic functionality allows simulation of a two species binding to each other as a function of their concentrations and the dissociation constant (KD) between the two species. A number of systems are built in and can be solved using direct analytical, kinetic, or Langrange multiplier based techniques. User-defined custom systems can also be specified using a simple syntax.

Try without installing on Google colab! https://colab.research.google.com/drive/1upxm56mGYWo8jvTTJjZLOEq6DT0lRy8d

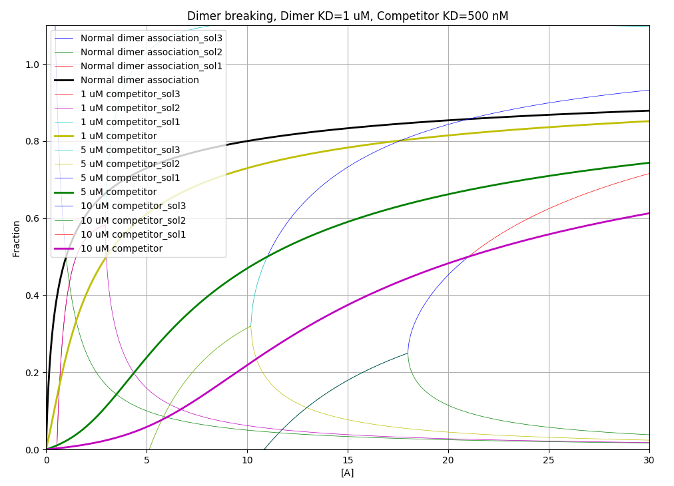
PyBindingCurve simulation

Installation

PyBindingCurve may be installed from source present in the GitHub repository https://github.com/stevenshave/pybindingcurve via git pull, or from the Python Package Index (https://pypi.org/project/pybindingcurve/) using the command :

pip install pybindingcurve

Requirements

PyBindingCurve requires Python 3.7 or later due to custom binding systems making use of ordered dictionary keys. The following packages are also required

  • Matplotlib (2.x)
  • Numpy (1.22.x)
  • lm_fit (1.0.0)
  • mpmath (1.1.0)

License

MIT License

Usage

A tutorial and API documentation can be found here

A quickstart example for simulation of protein-ligand binding is as follows:

import numpy as np
import pybindingcurve as pbc
my_system = pbc.BindingCurve("1:1")
system_parameters = {"p": np.linspace(0, 20), "l": 10, "kdpl": 1}
my_system.add_curve(system_parameters)
my_system.show_plot()

Tests written using the pytest framework may be run with 'pytest' (ensure pytest is installed in your python environment, or pip install it)

Authors

PyBindingCurve was written by Steven Shave email

Please get in contact for custom solutions, integration to existing workflows and training.

pybindingcurve's People

Contributors

justinykc avatar stevenshave avatar

Stargazers

 avatar  avatar  avatar  avatar  avatar  avatar  avatar  avatar  avatar  avatar  avatar  avatar  avatar  avatar

Watchers

 avatar  avatar  avatar

pybindingcurve's Issues

Question about one equation

Hello, in systems/analytical_equations.py, the function system01_analytical_one_to_one__pl has a 2.0 in the denominator. I am wondering if you have a reference for me with this form of the equation since the form I have seen more often has a 2.0*p in the denominator. Is this taken care of elsewhere that I am just confused about?

Readout on single component

I'd like to readout one of my single component. Below is my code adopted from the custom system example.

custom_system = """
    P+L*<->PL
    PL+P<->PLP
"""

my_system = pbc.BindingCurve(custom_system)

system_parameters = {
    "p": np.linspace(0, 10), 
     "l": 10, 
     "kd_p_l_pl": 0.01,
     "kd_pl_p_plp": 0.1,
}

my_system.add_curve(system_parameters)
my_system.show_plot(min_y=0, max_y=10)

This gives me the following error:

~/miniconda3/lib/python3.8/site-packages/pybindingcurve/systems/binding_system.py in query(self, parameters)
    188                             changing_parameters[0]
    189                         ][i]
--> 190                         results[i] = self._system(**tmp_params)[self.default_readout]
    191             else:
    192                 print(

KeyError: 'l'

If I set the readout to a product, it seems to work. Can you help me figure out how to set readout on a component?

Recommend Projects

  • React photo React

    A declarative, efficient, and flexible JavaScript library for building user interfaces.

  • Vue.js photo Vue.js

    ๐Ÿ–– Vue.js is a progressive, incrementally-adoptable JavaScript framework for building UI on the web.

  • Typescript photo Typescript

    TypeScript is a superset of JavaScript that compiles to clean JavaScript output.

  • TensorFlow photo TensorFlow

    An Open Source Machine Learning Framework for Everyone

  • Django photo Django

    The Web framework for perfectionists with deadlines.

  • D3 photo D3

    Bring data to life with SVG, Canvas and HTML. ๐Ÿ“Š๐Ÿ“ˆ๐ŸŽ‰

Recommend Topics

  • javascript

    JavaScript (JS) is a lightweight interpreted programming language with first-class functions.

  • web

    Some thing interesting about web. New door for the world.

  • server

    A server is a program made to process requests and deliver data to clients.

  • Machine learning

    Machine learning is a way of modeling and interpreting data that allows a piece of software to respond intelligently.

  • Game

    Some thing interesting about game, make everyone happy.

Recommend Org

  • Facebook photo Facebook

    We are working to build community through open source technology. NB: members must have two-factor auth.

  • Microsoft photo Microsoft

    Open source projects and samples from Microsoft.

  • Google photo Google

    Google โค๏ธ Open Source for everyone.

  • D3 photo D3

    Data-Driven Documents codes.