The goal of this project is to develop a dashboard that allows users to select one or more stocks, a start and end date, and have the closing stock prices displayed as a time series. Rather than attempt to code it all at once, I’ll break it down into manageable (and testable) benchmarks.
Stages will be:
- Stage1.py - perform imports, set up a graph with static data, ensure that we can lay everything out on the screen
- Stage2.py - add an input box and a basic callback to display the input value (the ticker) on the graph. Ensure that we can read data off the web using pandas datareader
- Stage3.py - add datepickers to select start and end dates and apply them to the callback
- Stage4.py - take advantage of Dash State, and hold all API calls until a Submit button is pressed
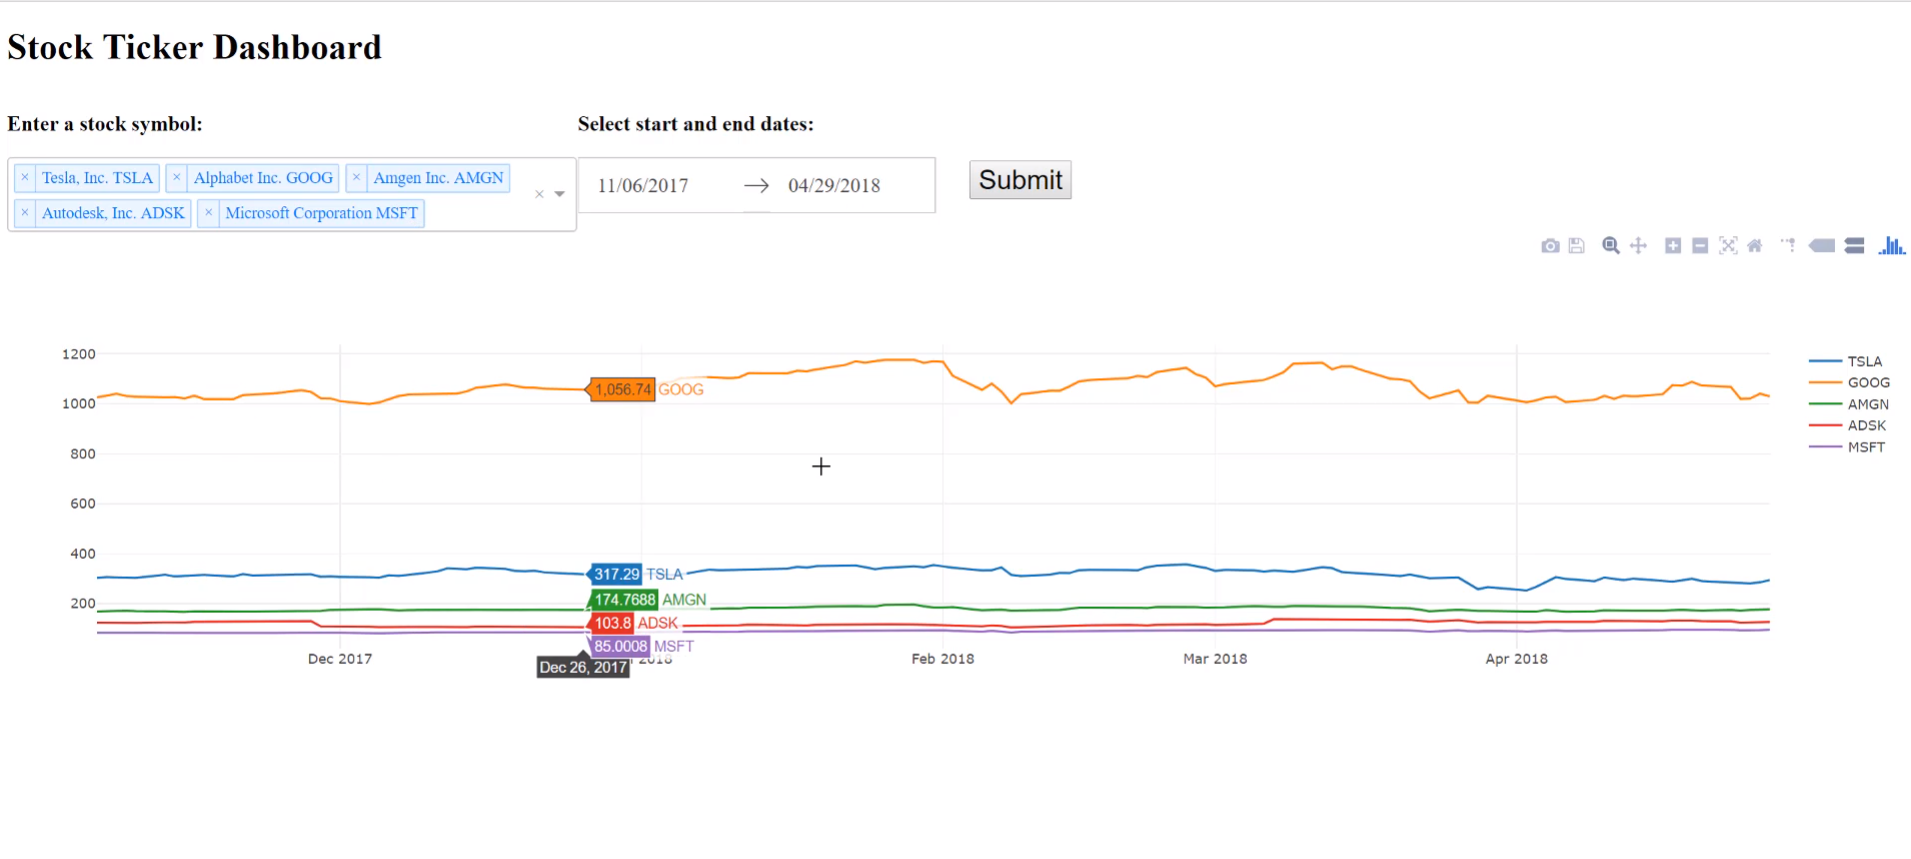
- FinalStage.py - replace the input box with a multiple dropdown list of choices. Pass multiple stocks as traces on the same graph.
Note: For this project you will need to make an account on IEX cloud to retrieve your own personal API tokens.