Giter Club home page Giter Club logo

livelossplot's Introduction

livelossplot

livelossplot version - PyPI PyPI status MIT license - PyPI Python version - PyPI GitHub Workflow Status Downloads Twitter @pmigdal

Don't train deep learning models blindfolded! Be impatient and look at each epoch of your training!

(RECENT CHANGES, EXAMPLES IN COLAB, API LOOKUP, CODE)

A live training loss plot in Jupyter Notebook for Keras, PyTorch and other frameworks. An open-source Python package by Piotr Migdał, Bartłomiej Olechno and others. Open for collaboration! (Some tasks are as simple as writing code docstrings, so - no excuses! :))

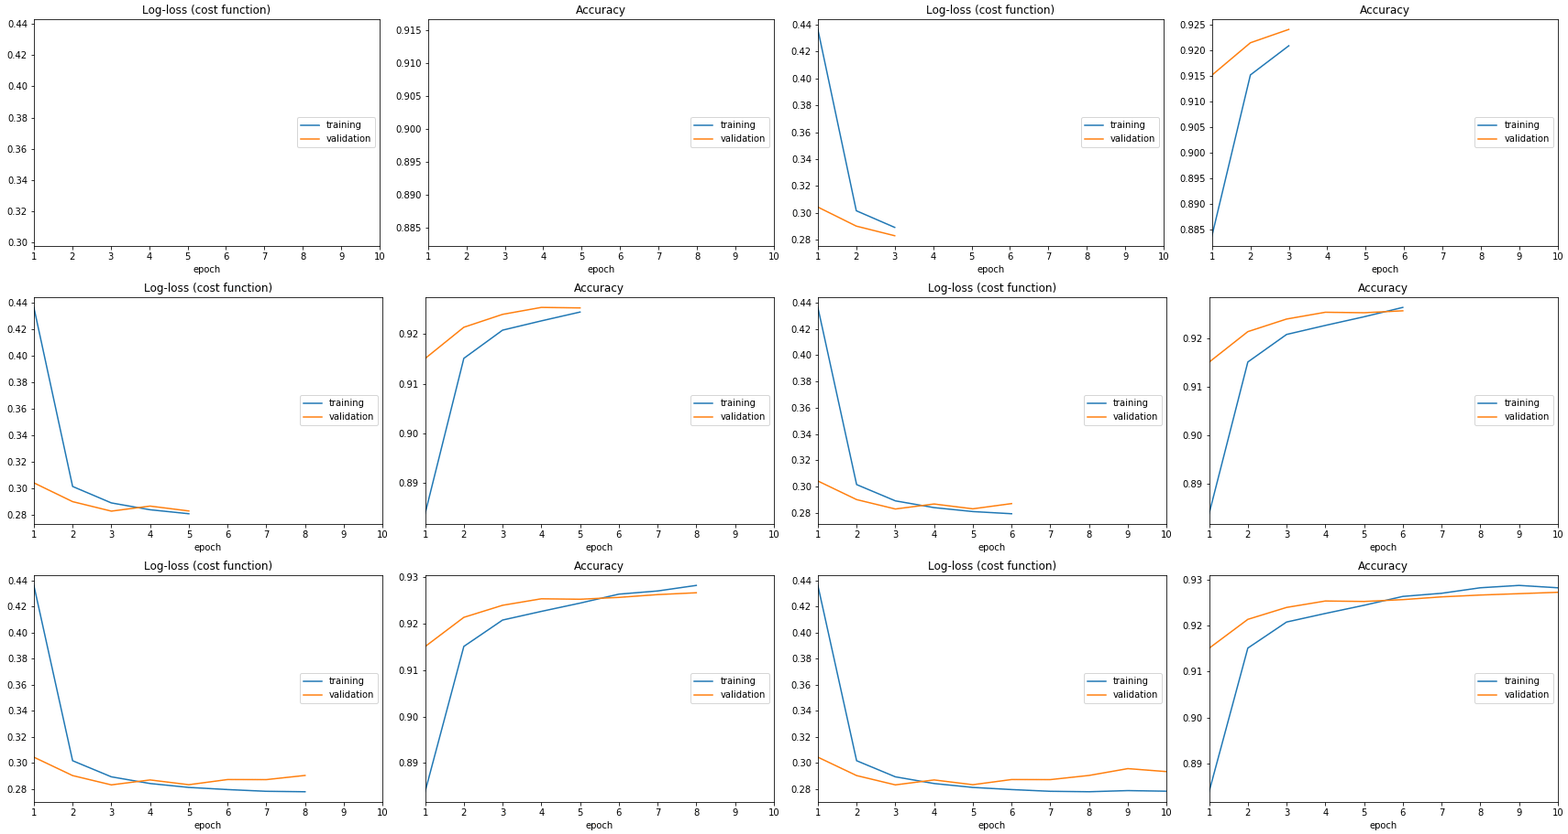
from livelossplot import PlotLossesKeras

model.fit(X_train, Y_train,
          epochs=10,
          validation_data=(X_test, Y_test),
          callbacks=[PlotLossesKeras()],
          verbose=0)

Animated fig for livelossplot tracking log-loss and accuracy

  • (The most FA)Q: Why not TensorBoard?
  • A: Jupyter Notebook compatibility (for exploration and teaching). The simplicity of use.

Installation

To install this version from PyPI, type:

pip install livelossplot

To get the newest one from this repo (note that we are in the alpha stage, so there may be frequent updates), type:

pip install git+git://github.com/stared/livelossplot.git

Examples

Look at notebook files with full working examples:

You run examples in Colab.

Overview

Text logs are easy, but it's easy to miss the most crucial information: is it learning, doing nothing or overfitting? Visual feedback allows us to keep track of the training process. Now there is one for Jupyter.

If you want to get serious - use TensorBoard, . But what if you just want to train a small model in Jupyter Notebook? Here is a way to do so, using livelossplot as a plug&play component

from livelossplot import ...

PlotLosses for a generic API.

plotlosses = PlotLosses()
plotlosses.update({'acc': 0.7, 'val_acc': 0.4, 'loss': 0.9, 'val_loss': 1.1})
plot.send()  # draw, update logs, etc

There are callbacks for common libraries and frameworks: PlotLossesKeras, PlotLossesKerasTF, PlotLossesPoutyne, PlotLossesIgnite.

Feel invited to write, and contribute, your adapter. If you want to use a bare logger, there is MainLogger.

from livelossplot.outputs import ...

Plots: MatplotlibPlot, BokehPlot.

Loggers: ExtremaPrinter (to standard output), TensorboardLogger, TensorboardTFLogger, NeptuneLogger.

To use them, initialize PlotLosses with some outputs:

plotlosses = PlotLosses(outputs=[MatplotlibPlot(), TensorboardLogger()])

There are custom matplotlib plots in livelossplot.outputs.matplotlib_subplots you can pass in MatplotlibPlot arguments.

If you like to plot with Bokeh instead of matplotlib, use

plotlosses = PlotLosses(outputs=[BokehPlot()])

Sponsors

This project supported by Jacek Migdał, Marek Cichy, Casper da Costa-Luis, and Piotr Zientara. Join the sponsors - show your ❤️ and support, and appear on the list! It will give me time and energy to work on this project.

This project is also supported by a European program Program Operacyjny Inteligentny Rozwój for GearShift - building the engine of behavior of wheeled motor vehicles and map’s generation based on artificial intelligence algorithms implemented on the Unreal Engine platform lead by ECC Games (NCBR grant GameINN).

Trivia

It started as this gist. Since it went popular, I decided to rewrite it as a package.

Oh, and I am in general interested in data vis, see Simple diagrams of convoluted neural networks (and overview of deep learning architecture diagrams):

A good diagram is worth a thousand equations — let’s create more of these!

...or my other data vis projects.

Todo

If you want more functionality - open an Issue or even better - prepare a Pull Request.

livelossplot's People

Contributors

bartolo1024 avatar casperdcl avatar djp3 avatar ethanwharris avatar freud14 avatar jonahweissman avatar joshy avatar kkanska avatar mickvanhulst avatar olivierdata avatar philmackay avatar sebastienlange avatar stared avatar vfdev-5 avatar weiji14 avatar

Stargazers

 avatar  avatar  avatar  avatar  avatar  avatar  avatar  avatar  avatar  avatar  avatar  avatar  avatar  avatar  avatar  avatar  avatar  avatar  avatar  avatar  avatar  avatar  avatar  avatar  avatar  avatar  avatar  avatar  avatar  avatar  avatar  avatar  avatar  avatar  avatar  avatar  avatar  avatar  avatar  avatar  avatar  avatar  avatar  avatar  avatar  avatar  avatar  avatar  avatar  avatar  avatar  avatar  avatar  avatar  avatar  avatar  avatar  avatar  avatar  avatar  avatar  avatar  avatar  avatar  avatar  avatar  avatar  avatar  avatar  avatar  avatar  avatar  avatar  avatar  avatar  avatar  avatar  avatar  avatar  avatar  avatar  avatar  avatar  avatar  avatar  avatar  avatar  avatar  avatar  avatar  avatar  avatar  avatar  avatar  avatar  avatar  avatar  avatar  avatar  avatar

Watchers

 avatar  avatar  avatar  avatar  avatar  avatar  avatar  avatar  avatar  avatar  avatar  avatar  avatar  avatar  avatar  avatar  avatar  avatar  avatar  avatar  avatar  avatar  avatar  avatar  avatar  avatar  avatar  avatar

livelossplot's Issues

Regression plot changes during the training

Live loss plot work almost perfect. But in regression problems there is the interest in Live Regression Plot, that can show us how predicted curve tends to real test curve during the training epochs.

Is it hard for you to do this kind callback based on livelossplot callback class?

Option to dump plot into a file on every epoch

It would be very useful in case jupyter closes or training cell is rerun - plots will get lost.
Please consider adding this feature or maybe tell me how could I make it without manually modifying sources.

Which other data do you need in the plots?

I am thinking what is the best amount of data displayed?
Maybe it is good to add other features - like the numerical value of current metrics, or maximal values.

Though, I don't want to make it too cluttered. So, I am interested in your feedback what is missing (or what you would consider more a distraction).

TypError: int object is not callable

It the end of the validation process it throws an TypError at the line:

draw_plot(logs, metrics, figsize, max_epoch, max_cols, validation_fmt, metric2title)
26
27 if max_epoch is not None:
---> 28 plt.xlim(1, max_epoch)
29
30 plt.plot(range(1, len(logs) + 1),

TypeError: 'int' object is not callable

How can i prevent this?

Supporting TensorBoard

How about plotting in livelossplot and having an option to seamlessly save TensorBoard data?
So you can have plots now, but if needed - explore it later.

Interesting in picking this issue? You are invited to make a Pull Request! :)

New graph for every epoch

Hi,

I'm getting this error 'RuntimeWarning: More than 20 figures have been opened. Figures created through the pyplot interface (matplotlib.pyplot.figure) are retained until explicitly closed and may consume too much memory. (To control this warning, see the rcParam figure.max_open_warning).
max_open_warning, RuntimeWarning)'

It seems to be opening a new graph for every epoch, anyone know a fix for this?

Printing extrema - nan

There is a problem with not-a-numbers. For example if monitored metric (e.g. F1) is nan after first epoch min and max values remain not-a-number during whole training. For example:
F1:
training (min: nan, max: nan, cur: 0.75).

PlotLossesKeras has an issue with 'lr'

I'm training a CNN model and I wanted to both a) be able to reduce the optimizer learning rate when it hits a plateau with ReduceLROnPlateau() and b) visually monitor the losses with livelossplot's PlotKerasLosses(). This combination in callbacks gives me a KeyError: 'lr'. When dropping either one of the functions the training works as it should. Hence my guess is that there must be a compatibility issue with the two.

Keras = 2.2.4
livelossplot = 0.3.4

Here's some code:

from keras.callbacks import ReduceLROnPlateau
from livelossplot import PlotLossesKeras

...

learning_rate_reduction = ReduceLROnPlateau(monitor='val_acc', 
                                            patience=3, 
                                            verbose=1, 
                                            factor=0.5, 
                                            min_lr=0.00001)

history = model.fit_generator(datagen.flow(X_train,Y_train, batch_size=batch_size),
                              epochs = epochs, 
                              validation_data = (X_val,Y_val),
                              verbose = 1, 
                              steps_per_epoch=X_train.shape[0] // batch_size,
                              callbacks=[learning_rate_reduction, PlotLossesKeras()])

And here's the error I get:

---------------------------------------------------------------------------
KeyError                                  Traceback (most recent call last)
<ipython-input-26-bd8223167e59> in <module>
      5                               verbose = 1,
      6                               steps_per_epoch=X_train.shape[0] // batch_size,
----> 7                               callbacks=[learning_rate_reduction, PlotLossesKeras()])

~/anaconda3/envs/upwork/lib/python3.7/site-packages/keras/legacy/interfaces.py in wrapper(*args, **kwargs)
     89                 warnings.warn('Update your `' + object_name + '` call to the ' +
     90                               'Keras 2 API: ' + signature, stacklevel=2)
---> 91             return func(*args, **kwargs)
     92         wrapper._original_function = func
     93         return wrapper

~/anaconda3/envs/upwork/lib/python3.7/site-packages/keras/engine/training.py in fit_generator(self, generator, steps_per_epoch, epochs, verbose, callbacks, validation_data, validation_steps, class_weight, max_queue_size, workers, use_multiprocessing, shuffle, initial_epoch)
   1416             use_multiprocessing=use_multiprocessing,
   1417             shuffle=shuffle,
-> 1418             initial_epoch=initial_epoch)
   1419 
   1420     @interfaces.legacy_generator_methods_support

~/anaconda3/envs/upwork/lib/python3.7/site-packages/keras/engine/training_generator.py in fit_generator(model, generator, steps_per_epoch, epochs, verbose, callbacks, validation_data, validation_steps, class_weight, max_queue_size, workers, use_multiprocessing, shuffle, initial_epoch)
    249                     break
    250 
--> 251             callbacks.on_epoch_end(epoch, epoch_logs)
    252             epoch += 1
    253             if callback_model.stop_training:

~/anaconda3/envs/upwork/lib/python3.7/site-packages/keras/callbacks.py in on_epoch_end(self, epoch, logs)
     77         logs = logs or {}
     78         for callback in self.callbacks:
---> 79             callback.on_epoch_end(epoch, logs)
     80 
     81     def on_batch_begin(self, batch, logs=None):

~/anaconda3/envs/upwork/lib/python3.7/site-packages/livelossplot/generic_keras.py in on_epoch_end(self, epoch, logs)
     63 
     64     def on_epoch_end(self, epoch, logs={}):
---> 65         self.liveplot.update(logs.copy())
     66         self.liveplot.draw()

~/anaconda3/envs/upwork/lib/python3.7/site-packages/livelossplot/generic_plot.py in update(self, log)
     80         self.logs.append(log)
     81         if self.plot_extrema:
---> 82             self._update_extrema(log)
     83 
     84     def draw(self):

~/anaconda3/envs/upwork/lib/python3.7/site-packages/livelossplot/generic_plot.py in _update_extrema(self, log)
     69     def _update_extrema(self, log):
     70         for metric, value in log.items():
---> 71             extrema = self.metrics_extrema[metric]
     72             if _is_unset(extrema['min']) or value < extrema['min']:
     73                 extrema['min'] = float(value)

KeyError: 'lr'

Support for N batch printing

I would like to see if there is a way to support printing the graph update after N batches rather than per epoch as, some datasets are in 100k+ it would be nice to get intermediate results.

two small features request?

@stared
Hi. I would like to have two small features, take a look here :

Mean squared error (cost function):
training (min: 0.000, max: 0.000, cur: 0.000)
validation (min: 0.000, max: 0.000, cur: 0.000)

Accuracy:
training (min: 0.549, max: 0.549, cur: 0.549)
validation (min: 0.355, max: 0.355, cur: 0.355)

this won't be enough for many purposes on precision, why? first 10 epochs of my neural starts right off of 0.00001 epoch loss !!!! the top table is pretty much useless with that precision.

Also, a nice thing to have before the tables would be a line that shows the finishing time on last epoch (how much time the last epoch took in total) side by side with the last epoch's number (when you run 3000 epochs, reading what epoch you are in from the chart is a headache)! I would appreciate if you add these two features. for the precision, maybe you can accept an integer into the function that would let us define how many digits in decimal place we need?

JupyterLab support

Hi,

I'm just curious if you support jupyter lab. Today I went down the rabbit hole of having a dynamic plot with matplotlib, my findings were very disappointing and I ended up just clearing the output and redrawing with this: https://stackoverflow.com/a/24818304/311744.

Brief summary of what I found/tried:
I tried that: https://stackoverflow.com/a/39853938/311744, but %matplotlib notebook is not supported by jupyterlab
I tried that also: https://stackoverflow.com/a/34486703/311744, but is seems very hacky, and doesn't support retina displays... Also, it uses the same %matplotlib notebook as above so no jupyterlab support.

'PlotLossesCallback' object has no attribute 'on_train_batch_begin'

Hi

Here is my Fitting section of neural network

`opt = tf.keras.optimizers.Adam(lr=0.001, decay = 1e-6)
model.compile(loss='sparse_categorical_crossentropy', optimizer= opt, metrics= ['accuracy'] )

tensorboard = TensorBoard(log_dir=f"logs/{MODEL_NAME}-{int(time.time())}")
filePath = MODEL_NAME + "-{epoch:04d}-{val_loss : .6f}"

checkpoint = ModelCheckpoint("Models/{}.model".format(filePath, monitor='val_loss', verbose = 1, save_best_only = True, mode='max'))

plot_losses = PlotLossesCallback()

history = model.fit(Train_X, Train_Y,
batch_size=BATCH_SIZE,
epochs=EPOCHS,
validation_data=(Validation_X, Validation_Y),
callbacks=[tensorboard, checkpoint, plot_losses])

M5Model.save(f'./Models/{SEQ_LEN}-SEQ--{BATCH_SIZE}-BatchSize-{CHART_TO_PREDICT}-MODEL-{MODEL_TYPE}.h5')`

why am i getting this error?

Axis scaling when using with early stopping

I have epochs = 99 because I use early stopping. The problem is that the plot scales the x axis for the number of epochs I set, not the actual number of epochs.

I would like the plot automatically adjust to the number of current, real, epochs. Otherwise the plot looks like this and is very poorly readable - https://puu.sh/BoxPa/5a3c0ee3bb.png

add X-label interval

Hi, I used your codes for plotting many epochs, and as there are a lot epochs, the xlabel only show 5, 10, 15, etc. Could you tell me how to exactly know which epoch my loss point belongs to? Maybe my_x_ticks = np.arange(0, 200, 1) my_y_ticks = np.arange(0, 1, 0.01) plt.xticks(my_x_ticks) plt.yticks(my_y_ticks)
something like this may help.
Thankyou for your time

Plotting all history points when using fit_generator

Hello,

This is a great alternative tool to Tensorboard for watching deep learning models.

Having said that, I noticed a bug when using fit_generator(). PlotLossesKeras() only plots the last point for each loss/accuracy and you end up with a straight line which is not very usefull...

capture d ecran 2018-03-27 a 19 49 47

Could you test your tool with fit_generator and provide a solution for this method ?

For information, when I plot directly from model.history.history, I get a good result (same thing when using fit method):
capture d ecran 2018-03-27 a 20 00 44

Option to skip `plt.show()` so that plots can later be modified

Hi, thanks for the really nice package. I would like to suggest to add an option to skip plt.show() in draw_plots() so that the plots can later be modified. That is something like

  • show=True: (default) run plt.show() as usual
  • show=False: skip plt.show()

By skipping plt.show(), users can then, for example, change the styles, modify the labels or add annotations, and call plt.show() afterward. For instance,

liveloss.draw(show=False)
plt.xlabel('step')
plt.show()

Thanks!

Rendering markdown for PyPI

For some reason Markdown does not render on https://pypi.org/project/livelossplot/.
I have no idea why - I did follow the guidelines in setup.py:

long_description=readme(),
long_description_content_type='text/markdown'

Vide:

(I do have up-to-date versions of twine, setuptools and wheel )

EDIT: Most likely an error with twine: pypa/twine#420 (there is a fix, but not yet released).

Any help appreciated!

How can I inline with OS X?

I'm not running from a Jupyter notebook, instead I'm running in Python directly (on OS X). How can I force inline?

install error in python 2.7

in setup.py

def readme():
with open('README.md', encoding='utf-8') as f:
return f.read()
...
long_description=readme()

but, in python 2.7, open function has no encoding parameter.
so, error occurs.
"TypeError: 'encoding' is an invalid keyword argument for this function"

PlotLossesKeras not working due to TypeError

For Keras version 2.1.3 the PlotLossesKeras crashes due to error in line 33 of keras_plot.py

Reason for this is:
self.metric2printable['loss'] = self.metric2printable.get(self.model.loss, self.model.loss) + " (cost function)"
where this breaks due to self.model.loss being a keras function. This results in

TypeError: unsupported operand type(s) for +: 'function' and 'str'

Cannot log to Tensorboard because of automatic folder name

When using Tensorboard logging, it will try to create a directory with time_str = datetime.now().isoformat()[:-7].replace("T", " ").
However, the isoformat includes the ":" character which cannot be used in a file path.

The line should be updated to replace a blacklist of characters. This may vary from one OS to another, but on Windows 10, it's not possible to use Tensorboard logging without tweaking the time_str variable.

AttributeError in jupyter

Hi!
I'm new to TF and keras and wanted to try out 'livelossplot'. I get the following Error:

AttributeError: module 'neptune' has no attribute 'Context'

This is my code:

`
model.compile(loss='binary_crossentropy',
optimizer='adam',
metrics=['accuracy', 'mean_squared_error'])

plot_losses = PlotLossesCallback()

model.fit(X_train, y_train,
epochs=2,
batch_size=1,
validation_data=(X_test, y_test),
callbacks=[plot_losses],
verbose=0)

AttributeError Traceback (most recent call last)
in
4
5
----> 6 plot_losses = PlotLossesCallback()
7
8 model.fit(X_train, y_train,

D:\Programme\Anaconda3\envs\tensorflow_env\lib\site-packages\livelossplot\keras.py in init(self, **kwargs)
7 def init(self, **kwargs):
8 keras.callbacks.Callback.init(self)
----> 9 _PlotLossesCallback.init(self, **kwargs)

D:\Programme\Anaconda3\envs\tensorflow_env\lib\site-packages\livelossplot\generic_keras.py in init(self, **kwargs)
26 class _PlotLossesCallback():
27 def init(self, **kwargs):
---> 28 self.liveplot = PlotLosses(**kwargs)
29
30 def on_train_begin(self, logs={}):

D:\Programme\Anaconda3\envs\tensorflow_env\lib\site-packages\livelossplot\generic_plot.py in init(self, figsize, cell_size, dynamic_x_axis, max_cols, max_epoch, metric2title, series_fmt, validation_fmt, plot_extrema, fig_path, target)
37 self.plot_extrema = plot_extrema
38 self.target = target
---> 39 from .neptune_integration import neptune_send_plot
40 self.fig_path = fig_path
41

D:\Programme\Anaconda3\envs\tensorflow_env\lib\site-packages\livelossplot\neptune_integration.py in
1 import neptune
2
----> 3 ctx = neptune.Context()
4
5
AttributeError: module 'neptune' has no attribute 'Context'`

Any idea?

CPU version of Tensorflow training is very slow with PlotLossesCallback

I have the CPU version of tensorflow and have been training a 3 layered Simple Recurrent keras model. However, the model takes takes too long to complete the an epoch (in excess of 30 minutes).

This started when I added the plot_losses = PlotLossesCallback() so that I can get live progress plots of the progress on the losses and accuracies for each epoch. I'm not sure how to remediate the issue.

Would installing cuDNN be helpful to fixing the issue or does it not work with the CPU version of tensorflow?
Or is there another when this can be fixed?

Handling more than one output, but only one loss

I have a model that has three outputs (named "usage", "clients", and "sessions") and one loss function (mean absolute percentage error.) As shown in the picture below, the names of my plots are a little messed up. I believe the upper right plot should be titled "usage_loss".
image

I think the problem is in this section of the code, but I'm not sure how to fix it.

if len(losses) == 1:
loss_name = loss2name(losses[0])
self.metric2printable['loss'] = "{} (cost function)".format(self.metric2printable.get(loss_name, loss_name))
for output_name, loss in zip(self.model.output_names, losses):
loss_name = loss2name(loss)
self.metric2printable['{}_loss'.format(output_name)] = "{} (cost function)".format(self.metric2printable.get(loss_name, loss_name))

LiveLossPlot: ModuleNotFoundError: No module named 'neptune'

from livelossplot.keras import PlotLossesCallback
callbacks_list = [PlotLossesCallback()]


ModuleNotFoundError Traceback (most recent call last)
in
4 checkpoint = ModelCheckpoint("C:\home\jupyter\experiments\models",
5 monitor='acc', verbose=1, save_best_only=True, mode='max')
----> 6 callbacks_list = [checkpoint, PlotLossesCallback()]

~\AppData\Local\conda\conda\envs\tesseract\lib\site-packages\livelossplot\keras.py in init(self, **kwargs)
7 def init(self, **kwargs):
8 keras.callbacks.Callback.init(self)
----> 9 _PlotLossesCallback.init(self, **kwargs)

~\AppData\Local\conda\conda\envs\tesseract\lib\site-packages\livelossplot\generic_keras.py in init(self, **kwargs)
26 class _PlotLossesCallback():
27 def init(self, **kwargs):
---> 28 self.liveplot = PlotLosses(**kwargs)
29
30 def on_train_begin(self, logs={}):

~\AppData\Local\conda\conda\envs\tesseract\lib\site-packages\livelossplot\generic_plot.py in init(self, figsize, cell_size, dynamic_x_axis, max_cols, max_epoch, metric2title, series_fmt, validation_fmt, plot_extrema, fig_path, target)
37 self.plot_extrema = plot_extrema
38 self.target = target
---> 39 from .neptune_integration import neptune_send_plot
40 self.fig_path = fig_path
41

~\AppData\Local\conda\conda\envs\tesseract\lib\site-packages\livelossplot\neptune_integration.py in
----> 1 import neptune
2
3 ctx = neptune.Context()
4
5

ModuleNotFoundError: No module named 'neptune'

Prevent clearing of output other than the livelossplot graph

I noticed that any output besides the loss graph of livelossplot gets cleared at each training iteration. (anytime I call liveloss.draw())

Do you have a way of keeping that output ?
It seems that this mechanism is at the core of your package:

# livelossplot/core.py:15
def draw_plot(logs, metrics, figsize=None, max_epoch=None,
              max_cols=2,
              validation_fmt="val_{}",
              metric2title={}):
    clear_output(wait=True) # I see what you did here
    plt.figure(figsize=figsize)

So I suspect that finding a workaround will be pretty difficult. With that said, I still would like to know if anyone has suggestions.

"'Module' object has no attribute 'callbacks'"

When loading livelossplot with python2.7 and keras2.2.4 when importing the module I get this return:

AttributeError                            Traceback (most recent call last)
<ipython-input-383-ab062d1d275c> in <module>()
----> 1 from livelossplot.keras import PlotLossesCallback
      2 import keras
      3 from keras.layers import Input, LSTM, Dense
      4 from keras.models import Model

/anaconda3/envs/tensorflow_p27/lib/python2.7/site-packages/livelossplot/keras.pyc in <module>()
      2 from .generic_keras import _PlotLossesCallback
      3 
----> 4 class PlotLossesCallback(_PlotLossesCallback, keras.callbacks.Callback):
      5     def __init__(self, **kwargs):
      6         keras.callbacks.Callback.__init__(self)

AttributeError: 'module' object has no attribute 'callbacks'

Need help to force the "inline" matplotlib backend when running scripts from Jupiter notebook

Hi,

I'd like my script to automatically change the backend back to "inline" when it is run by Jupiter.

I tried this but it does not work (in practice) :

# If the script is not run by python but by jupyter and is using a different backend then "inline"
if matplotlib.get_backend() != 'Qt5Agg' and ( 'inline' not in matplotlib.get_backend() ) :
    print("=> BEFORE: matplotlib backend = <%s>" % matplotlib.get_backend() )
    matplotlib.use('module://ipykernel.pylab.backend_inline',warn=False, force=True) # <=> %matplotlib inline
    import matplotlib.pyplot as plt
    print("=> AFTER: matplotlib backend = <%s>" % matplotlib.get_backend() )

I get this (which theoretically is correct) :

=> BEFORE: matplotlib backend = <nbAgg>
=> AFTER: matplotlib backend = <module://ipykernel.pylab.backend_inline>

But in practice, the "inline" backend is not applied.

Can you help me ?

adding matplotlib.use('TkAgg')

Hi, I'd like to use the plot in the case that I can output using nohup command, but as there is a problem of GUI, so it caused segmentation core broke, so I can't plot in the output file. adding matplotlib.use('TkAgg') in this case may solve my problem but I'm not sure in your codes where to modify it.
In any case, it works fine in Jupyter Notebook, thank you!

Support for x-axis that is not an epoch

I would like to be able to override the label for the x-axis.
Also, sometimes I would like to explicitly give the x-value for one of the points.

For example, if you are doing minibatch training, you might give the x-axis as the total number of examples seen.

Also, you might want to have training points every minibatch, and validation points at the end of every epoch, and the xvalue is minibatch * nbatches

Y-axis support

HI,

Please let me know how I can change the values of Y axis for log loss in x.xxx format and acc in x.xxx format

Parsing of loss name raises a TypeError when loss is a dict

I am working in a multitask model where I am passing a dictionary of losses and metrics for each task in model_compile(). It is a mixture of classification and regression tasks so I use custom variants of MSE and binary crossentropy. There is no issue when I pass each of these custom losses in a model as a single value, but I get an error when I try to use your PlotLossesKeras as callback and a dictionary of losses.

I checked the code and I think I found what causes the issue in keras_plot.py:

 if isinstance(self.model.loss, list):
    losses = self.model.loss
elif isinstance(self.model.loss, dict):
    losses = self.model.loss.values()
else:
# by far the most common scenario
    losses = [self.model.loss]

loss_name = loss2name(losses[0])

The last line raises a type error when losses is of type dict_values since it does not support indexing.
In any case, the purpose of this line is to get a name for the general loss, which at least in my case (and I believe in most cases where a dictionary of losses will be passed) does not really make sense and a generic term like 'loss' would make more sense. (In my case this value is the equivalent of the sum of all the individual losses of each task).

My solution was just to change this line to:

loss_name = loss2name(losses[0]) if isinstance(losses, list) else 'loss'

PD: Your little package is great, I have been using for a good while and it adds a neat functionality to the networks I train in my jupyter notebooks!

Adding Bokeh backend

Bokeh, as an alternative backend to matplotlib, would make it simple to:

  • toggle between in-notebook plots and external plots (so that it would work seamlessly with both Jupyter Notebook Python scripts)
  • give mouseover view of exact numerical values (no more eye squeezing!)
  • zoom if needed

I don't want to have it instead of matplotlib (as this one makes it easier to save plots, so that they are visible in Jupyter Notebooks on GitHub), but as an additional backend.

My experience with Bokeh is limited, so this issue is open for YOUR contribution! :)

Feauture request: Allow to simultaneously plot metric

It would be nice to have two subplots (or even more, if one wants to observe different metrics):

One should display the loss (as is currently possible), and the other one next to it should display a loss (selectable by user).

I hope other people would like that as well.

Training plot shows but not the curve.

Hi All,

I used the livelossplot for model training. Even though, all works fine including the model training but in the plot the training and validation curves are not shown. However, when I refresh the jupyter notebook and run it from beginning the full graphs are displayed. But when I want to do model tuning the curves do not display. May be .ipynb file is large. I do not know.

Would anyone be able to help me on this regard.
The modules that were used for the visualisation are below:

from IPython.display import SVG
import livelossplot
plot_losses = livelossplot.PlotLossesKeras()

Also please find the image of the training graph without the training and validation curves below:

Screenshot_2019-05-14_14-00-13

Your input in this issue is much appreciated.

Thanks

Michael

Recommend Projects

  • React photo React

    A declarative, efficient, and flexible JavaScript library for building user interfaces.

  • Vue.js photo Vue.js

    🖖 Vue.js is a progressive, incrementally-adoptable JavaScript framework for building UI on the web.

  • Typescript photo Typescript

    TypeScript is a superset of JavaScript that compiles to clean JavaScript output.

  • TensorFlow photo TensorFlow

    An Open Source Machine Learning Framework for Everyone

  • Django photo Django

    The Web framework for perfectionists with deadlines.

  • D3 photo D3

    Bring data to life with SVG, Canvas and HTML. 📊📈🎉

Recommend Topics

  • javascript

    JavaScript (JS) is a lightweight interpreted programming language with first-class functions.

  • web

    Some thing interesting about web. New door for the world.

  • server

    A server is a program made to process requests and deliver data to clients.

  • Machine learning

    Machine learning is a way of modeling and interpreting data that allows a piece of software to respond intelligently.

  • Game

    Some thing interesting about game, make everyone happy.

Recommend Org

  • Facebook photo Facebook

    We are working to build community through open source technology. NB: members must have two-factor auth.

  • Microsoft photo Microsoft

    Open source projects and samples from Microsoft.

  • Google photo Google

    Google ❤️ Open Source for everyone.

  • D3 photo D3

    Data-Driven Documents codes.