Cassandra is a leader-less distributed NoSQL database with a partitioned wide column storage model. This blog is the first part of a two part demo around Cassandra Database. The goal of part 1 is to showcase the usage of Cassandra in a data ingestion/data pipeline and quering context. Part 2 will demo the integration of Spark with Cassandra for analytics.
This repo contains a fully working example developed from scratch for this demo, no theme used or existing code was used in order to build the solution, you will find the following artefacts:
- Nifi Data flow supporting daily and hourly data pull into Cassandra.
- SpringBoot REST APIs using SpringData for exposing the data through API calls.
- VueJS Dashboard with ChartJS and Bulma CSS Framework display various data and charts.
- CQL, Python, Groovy and Shell scripts supporting the demo.
- Excalidraw sketch
Prerequisites for running the demo:
- Apache NiFi 1.11.3
- Apache Cassandra 3.11.6
- SpringBoot 2.2.6
- SpringData for Apache Cassandra
- VueJS 2.6.11
- ChartJS 2.9.3
- Bulma 0.9.0
- ArchUnit 0.13.1
We also used the excellent Excalidraw tool for mockups.
The scenario used is a COVID-19 Data Dashboard, thus to stay in the time context in wich this demo was built. The data used is provided by the COVID-19 Data Repository by the Center for Systems Science and Engineering (CSSE) at Johns Hopkins University.
This demo is for education/training purpose, for official data and information on COVID19 please refer to WHO and JHU Dashboard.
In the following section, you will find each components technology used in this demo and a description of the steps followed to build the solution.
You can check the final result on this page.
Cassandra
This section is a tentative compressed introduction to Cassandra with a focus on a list of key facts that are a must-know in order to handle Cassandra in an optimal way.
For an indepth training about Cassandra, a good place to start would be the excellent Datastax Academy free training/courses and of course the Apache Cassandra Architecture documentation.
Another excellent stop would be the YouTube Datastax Channel.
Cassandra is an open source distributed schema-free wide column data store. Initially developped at Facebook and open sourced in 2008, its today a top-level project at the Apache Foundation. The current release is version 3.11 as of April 2020.
The main advantage of Cassandra over the other NoSQL database is its linear scalability to support high throughput with no single point of failure.
Cassandra is of type Wide Column data store and support different level of SQL like queries, including full SELECT, DML and DDL statements.
| Feature | Available |
|---|---|
| Leader-less Architecture | Yes |
| Decentralized and Symmetrical | Yes |
| Cross-Data Center Replication | Yes |
| Schema-free | Yes |
| MapReduce | Yes |
| Always On | Yes |
| High Write Availability | Yes |
Cassandra is considered a partition row store with rows organized into tables with a required primary key. In other words, Cassandra will manage the partitioning of the data across multiples nodes. The row store definition means that the data is organized in rows and columns.
An often used comparison to explain how the data is stored in Cassandra is the SortedMap Data Structure.
We can say that Cassandra store the data in a sparse, distributed, persistent multi-dimensional sorted map:
SortedMap<RowKey, SortedMap<ColumnKey, ColumnValue>>This type of data structure can be complex to design and use, thus it's paramount that one must design carefully the initial data model in order to support the target application queries, both from performance and efficiency standpoint.
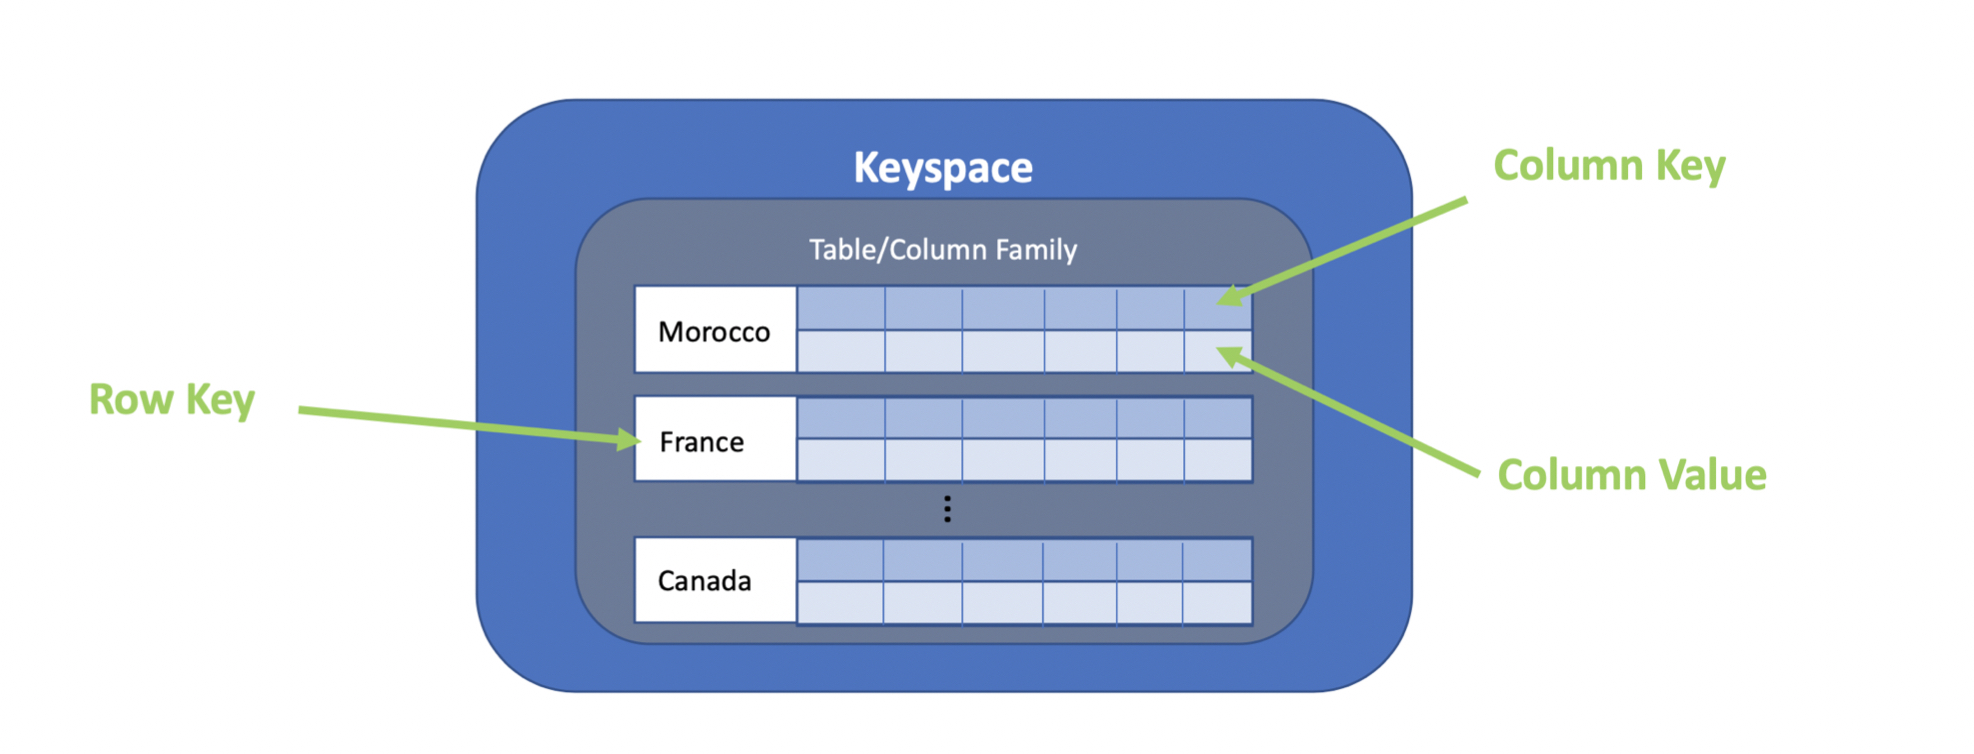
Below is a simple analogy between the Relational and the Cassandra data model by Bruno Tinoco, it's only intended as a similarity reference, not as an equivalence.
| Relational Model | Cassandra Model |
|---|---|
| Database | Keyspace |
| Table | Column Family (CF) |
| Primary Key | Row Key |
| Column Name | Column Key |
| Column Value | Column Value |
A table is created and used in a keyspace. A table can have a simple or a composite primary key, this key can be used to retrieve the data from the table. The order of the composite primary key columns is important since the first column is called the partition key. All rows sharing the same partition key will be stored on the same physical node. The Primary key is also referenced to as the RowKey and can be viewed as the unique identifier of the column family.
- It can work with a single node, but obviously you will benefit from its capabilities if you run with a minimum of 3 nodes.
- The nodes can be grouped logically in a ring like architecture.
- All nodes communicates between each others thourgh peer-to-peer communication called Gossiping.
- Cassandra architecture allows an effort-less horizontal scalling by adding more nodes to the ring.
- Multiples rings can exists in a Cluster, each ring can be in a different datacenter.
- Deciding the composition or your table partition key is critical for performance as you want to reduce the number of communication required between the nodes in order to complete a query.
- Even for the smallest size table, all data is distributed in the cluster based on a partition key value. To avoid datasque, a hash of the partition key is produced and the resulting token is used to distribute the data accross the nodes evenely.
- Each node have a maximum of 128 virtual nodes.
- Each node is responsible for a token range.
- A full scan over a table means a full scan of all the nodes in the ring, i.e increased network calls and resources usage.
- All rows with the same partition key are stored on the same partition.
- A query goal should always be to read from a single partition, the where clause should filter by the partition key.
- Its recommended that you store up to 1TB of data in each node, beyond this value the nodes start to slow down.
- You can run up to 3K TPS per core.
- Leader-less architecture means that each node can act as a leader (coordinator) node during a specific request. A request can be sent to any node and it will be managed to ensure the request is fullfilled by the required node.
- Data is distributed but also replicated, i.e copied on all replica nodes. The number of replication is based on the replication factor RF.
- Its recommended that your replication factor is an odd number, thus allowing a faster conscensus.
- If a node is down in a cluster and the other replica nodes, a hinted handoff is put in place to buffer the request until the node is back.
- By default the hinted handoff duration is 3 hours. The value can be changed but the long the duration, the longer the time required to bring the node back once is up.
NiFi
NiFi is a powerful Flow Based Programming software designed for massive data flow from any source to any destination. Based on Java, it support scripting and extension through adding new Processors on top of its already rich 286 Processors, 84 Controller Services 15 and reporting tasks!
SpringBoot/SpringData
We are using SpringBoot to speedup exposing our APIs and start building the UI. This is done by levering the containerless and starter dependencies to simplify our build configuration. We will use also SpringData for Apache Cassandra to benefit from the Repository Support to simplfy our queries.
For more reading on Spring, a good start is to have an overview of the history of the spring framework.
To get started quickly, wer are using the Spring Initialzr tool to generate your project structure and starter POM.
We are also using ArchUnit to validate our architecture inside our SpringBoot application, have a look at C19ArchitectureTest
Learning
You can learn from this demo by doing some of the suggested exercies, you will find an exercies suggested in each section and at the end in the exercices section.
Lets get started!
To follow first Cassandra Database principle: design your data model based on your queries, lets first start by sketching how we want our UI to look like and extract the main queries.
Using Excalidraw we obtain the following sketch:
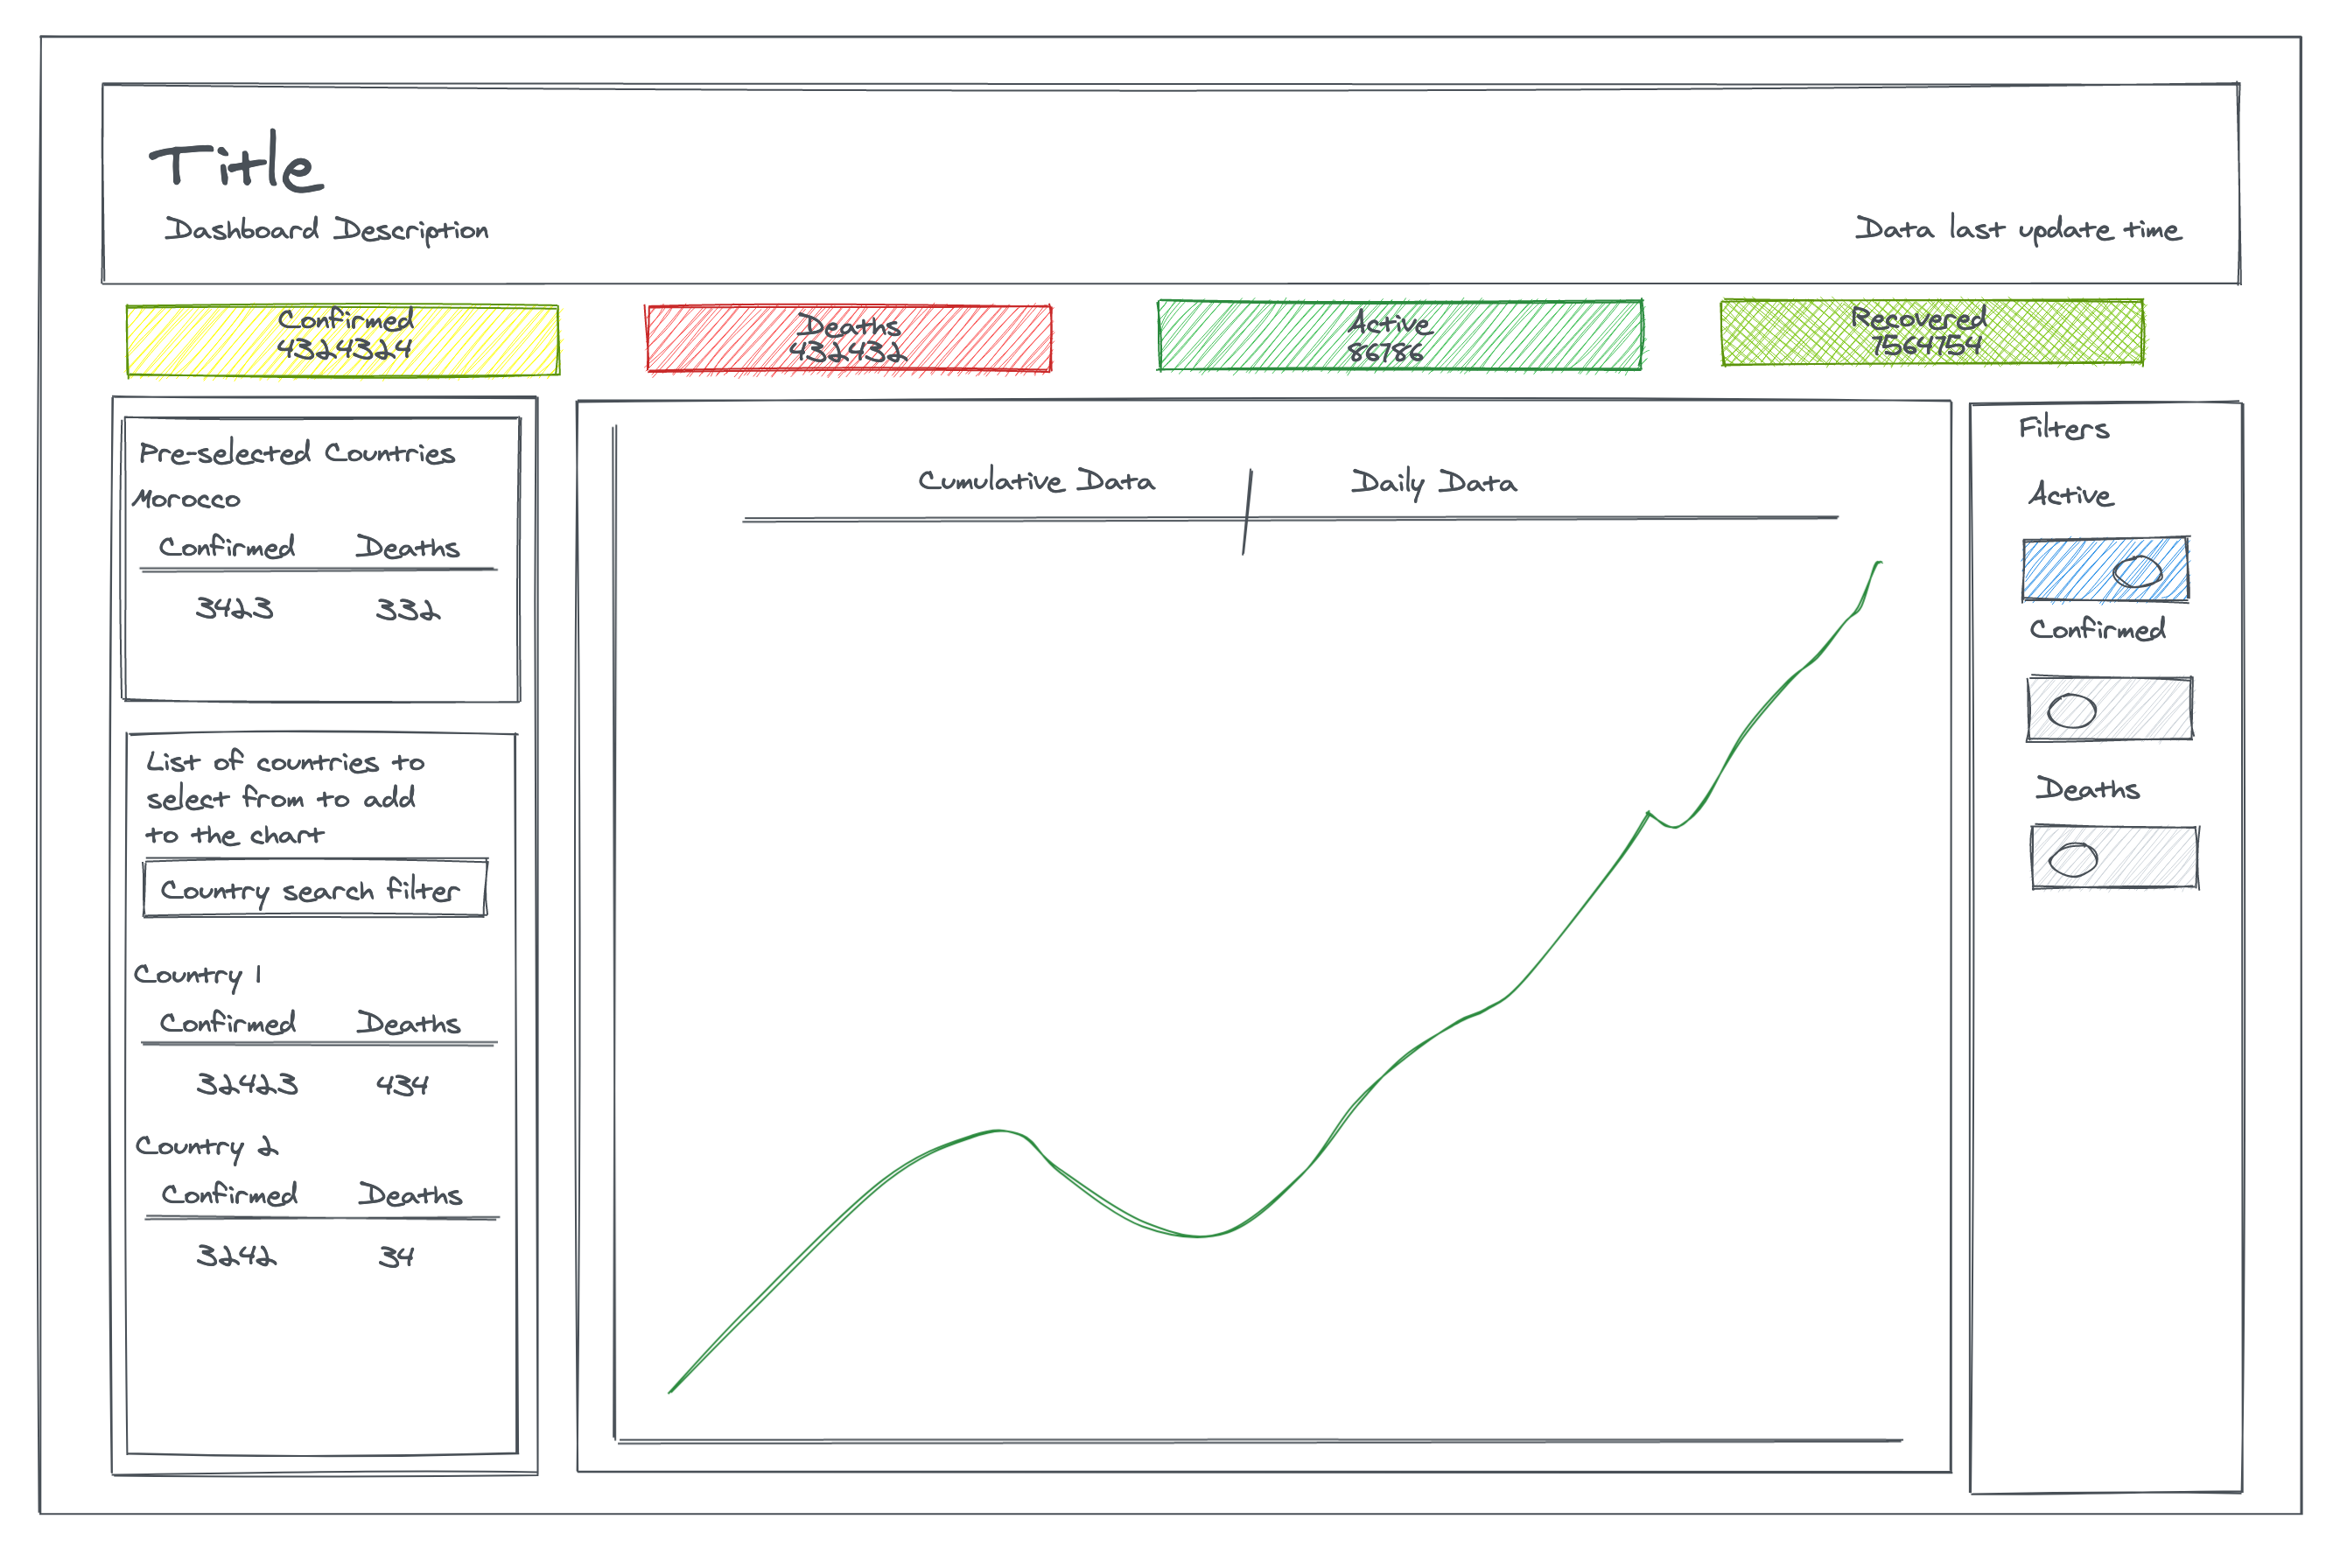
The following queries can be extracted from this sketch:
- Latest aggregated global data for Confirmed, Deaths, Active and Recovered cases
- List of all top level regions (countries)
- Latest aggregated data for Confirmed, Death, Active and Recovered cases for each top level region (country)
- List of historic data point for each region
In order to populate our tables correclty we have to understand the structure of the JHU CSSE COVID-19 dataset. We will be using the daily reports files: csse_covid_19_daily_reports.
The documentation explains that there are multiples refresh frequencies:
- Since June 15, refresh occurs between 04:45 and 05:15 GMT.
- Files on and after April 23, once per day between 03:30 and 04:00 UTC.
- Files from February 2 to April 22: once per day around 23:59 UTC.
- Files on and before February 1: the last updated files before 23:59 UTC.
When you analyze the files from the different refresh group you can notice that not only the files are on diffrent refresh schedule, but they also have different "schemas". For this demo we will be using the dataset from April 23 onward, see learning section to implement loading the data for the other date ranges.
We will only focus on the data we need for our dashboard, thus we will use only the daily data points.
Once your instance of Cassandra is installed, start your cql shell and run the commande below.
First let's create a keyspace with a SimpleStrategy with a replication factor of 1 as we will be using one node only, this can be modified at later stage. For the Strategy, its recommended to go with a NetworkTopologyStrategy for production usage.
CREATE KEYSPACE coronavirus WITH replication = {
  'class': 'SimpleStrategy',
  'replication_factor': '1'
};
Then lets create our daily data points table.
CREATE TABLE coronavirus.region_daily_data_points (
    region text,
    year int,
    month int,
    day int,
    last_update timestamp,
    province_state text,
    admin2 text,
    active bigint,
    combined_key text,
    confirmed bigint,
    deaths bigint,
    fips text,
    lat float,
    long_ float,
    recovered bigint,
    PRIMARY KEY (region, year, month, day, last_update, province_state, admin2))
    WITH CLUSTERING ORDER BY (year DESC, month DESC, day DESC, last_update DESC, province_state ASC, admin2 ASC);
Fore more advanced time series configuration have a look at the Time Window CompactionStrategy strategy.
Now, lets create our latest (hourly) data table. We are only interested in the latest data, thus our table is partitionned by the main country_region thus allowing faster aggregation at the country level as each country_region rows will be on the same node.
CREATE TABLE coronavirus.region_data_global_latest (
    country_region text,
    combined_key text,
    active bigint,
    admin2 text,
    confirmed bigint,
    deaths bigint,
    fips text,
    last_update timestamp,
    lat float,
    long_ float,
    province_state text,
    recovered bigint,
    PRIMARY KEY (country_region, combined_key)
) WITH CLUSTERING ORDER BY (combined_key ASC);
With a simple change to the partition key you can highly impact how your data will be distributed across the cluster physical nodes. This can have a significative impact on the sizing of the partition depending on the replication factor selected. A detailed explanation of this concept can be found here.
The primary key can be of type simple, based on a Simple Primary Key, or Composite. This type of date structure make Cassandra well adapted for time series data storage.
/!\ A badly designed primary key put you at risk of losing data as all rows having the same primary key will be overwritten during insertion, this is often an error that occurs when starting to use Cassandra. Thus, designing an adequate primary key will help avoid important data loss during insertion of data.
As an exercies, you can add a new table for querying the available region and sub region with their dependencies.
Let's populate our table with the data using NiFi.
First, start by installing and running your instance of NiFi. Once started, open your browser and navigate to your configured url.
For the demo, we need to create two separate groups: Hourly and Daily
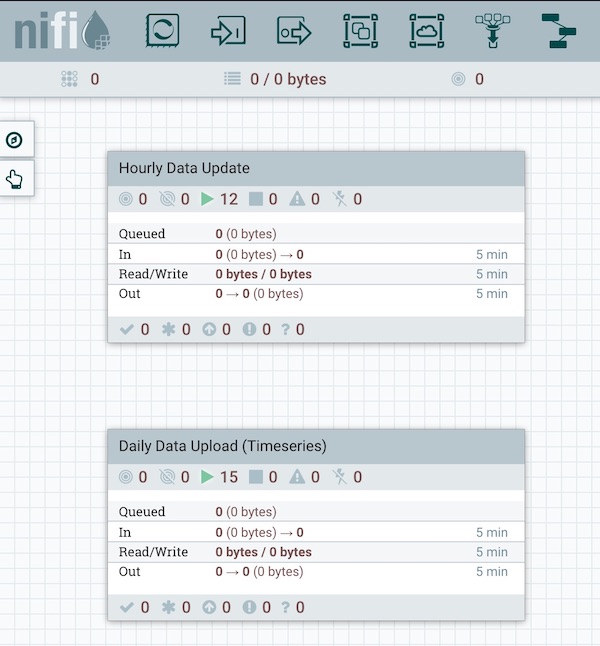
The first group is the hourly refresh of the data:
The second group is the daily refresh of the data:
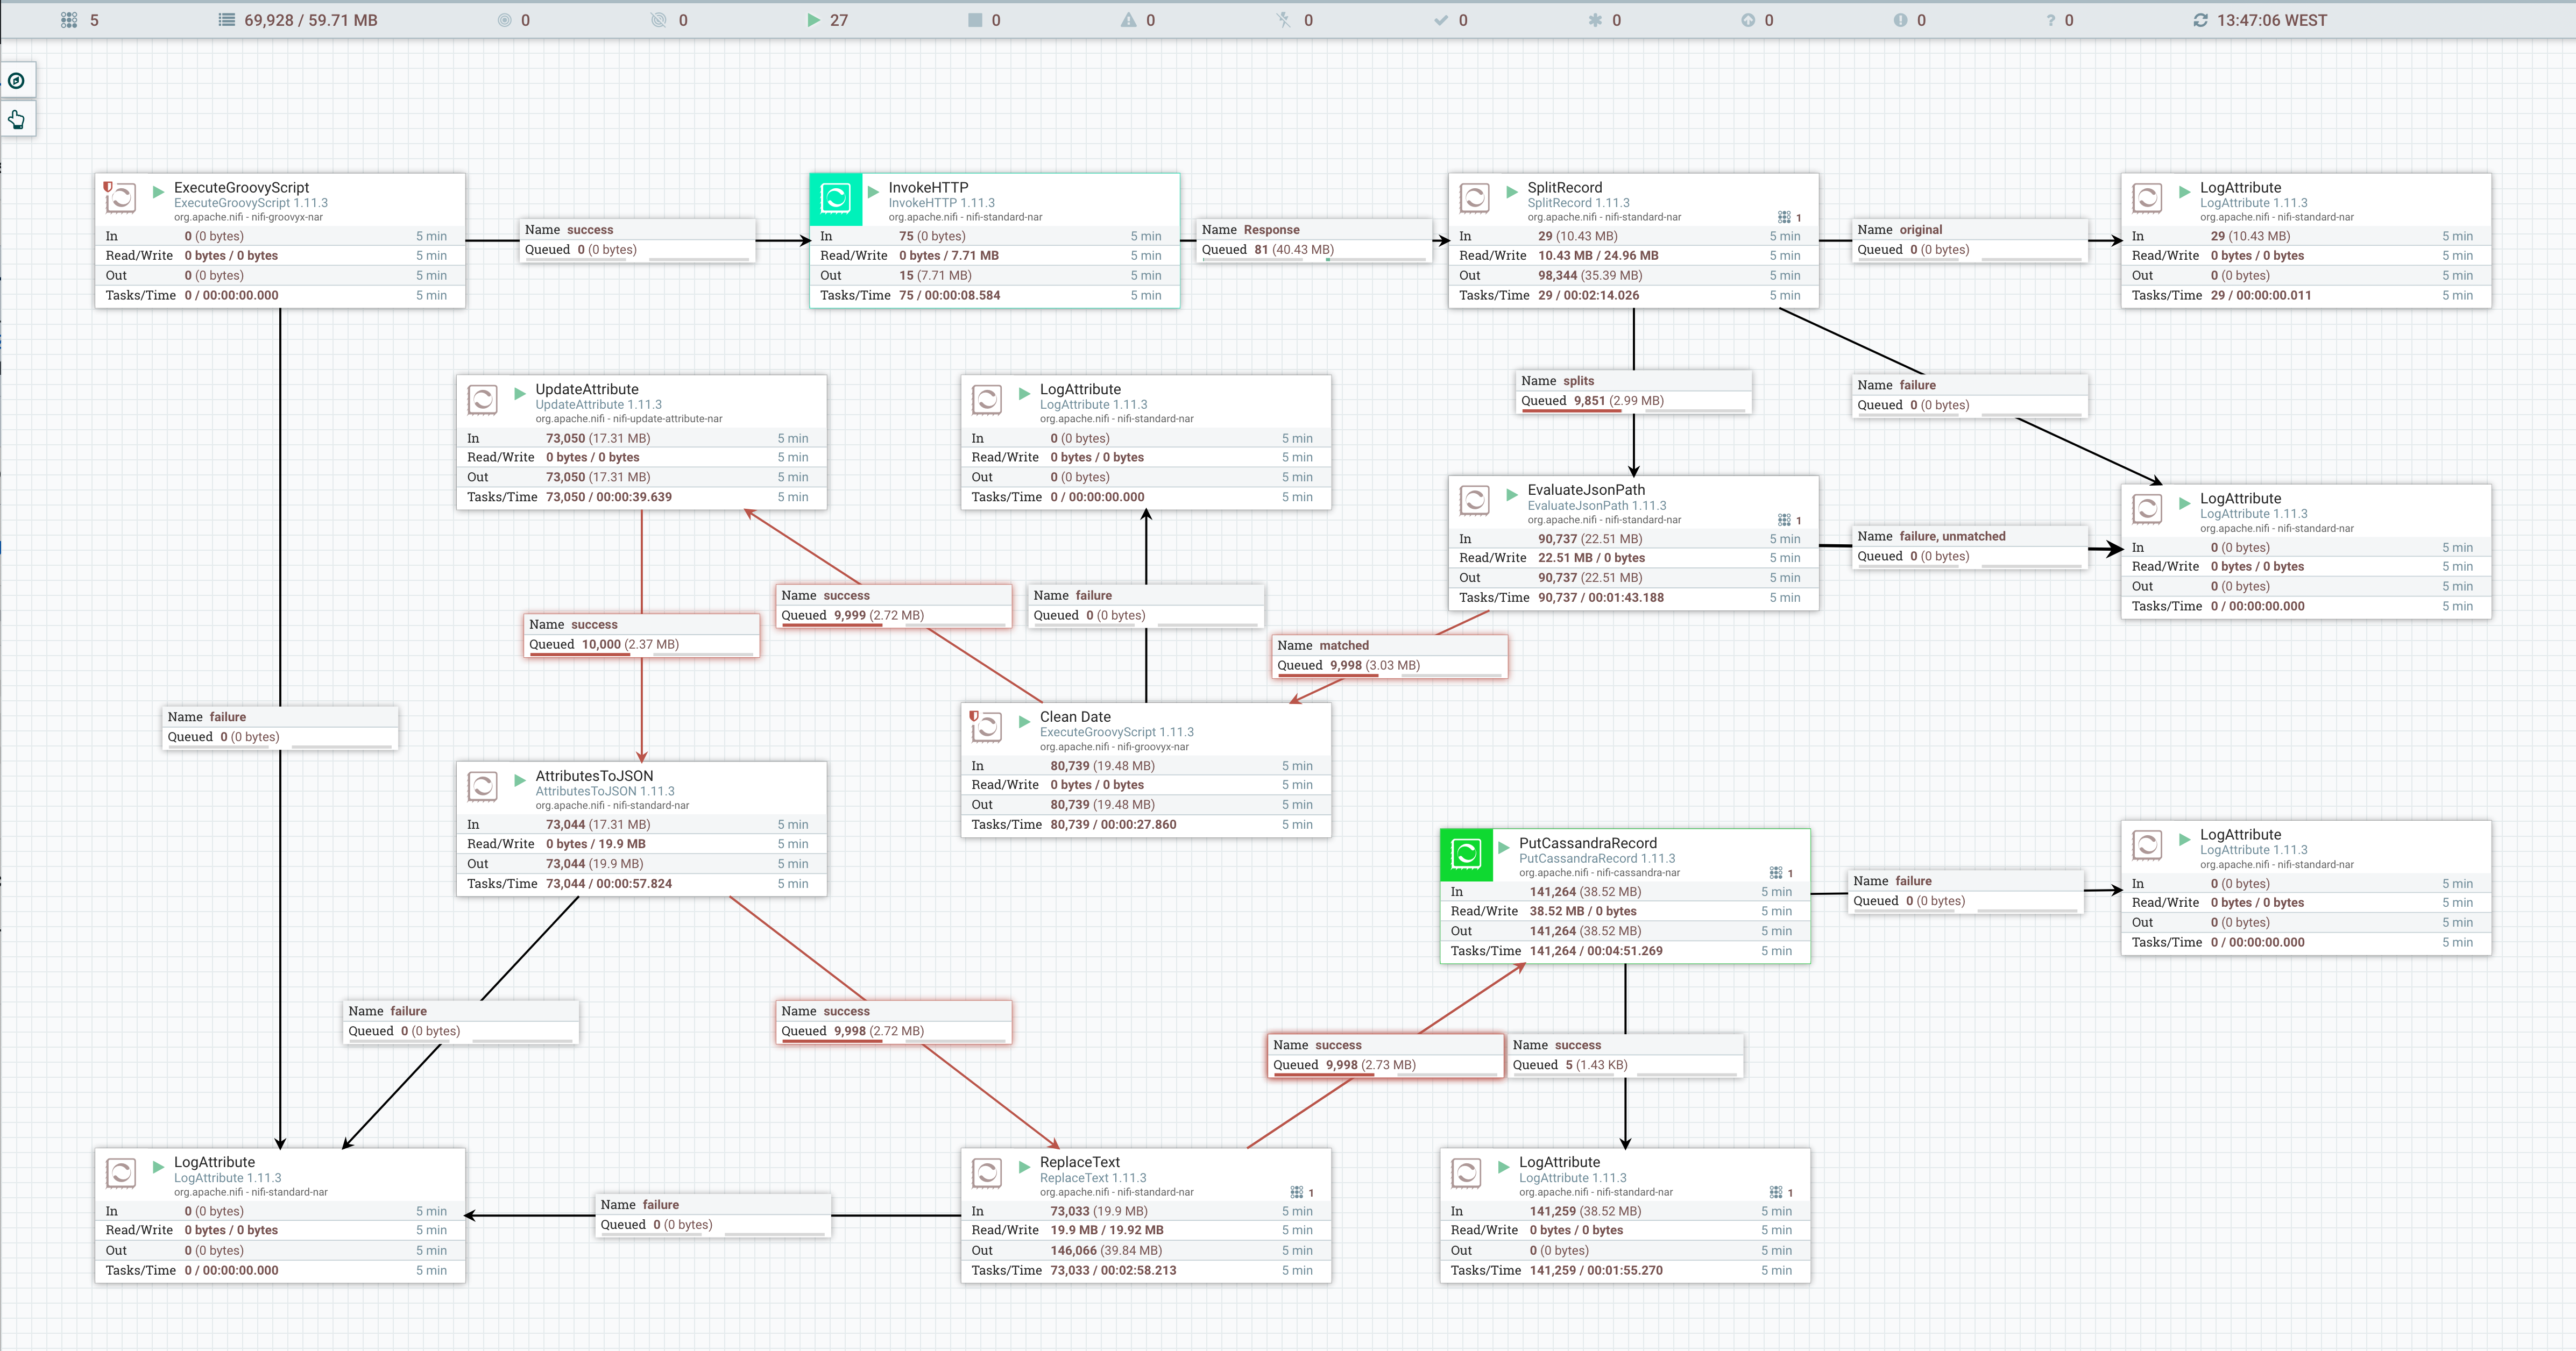
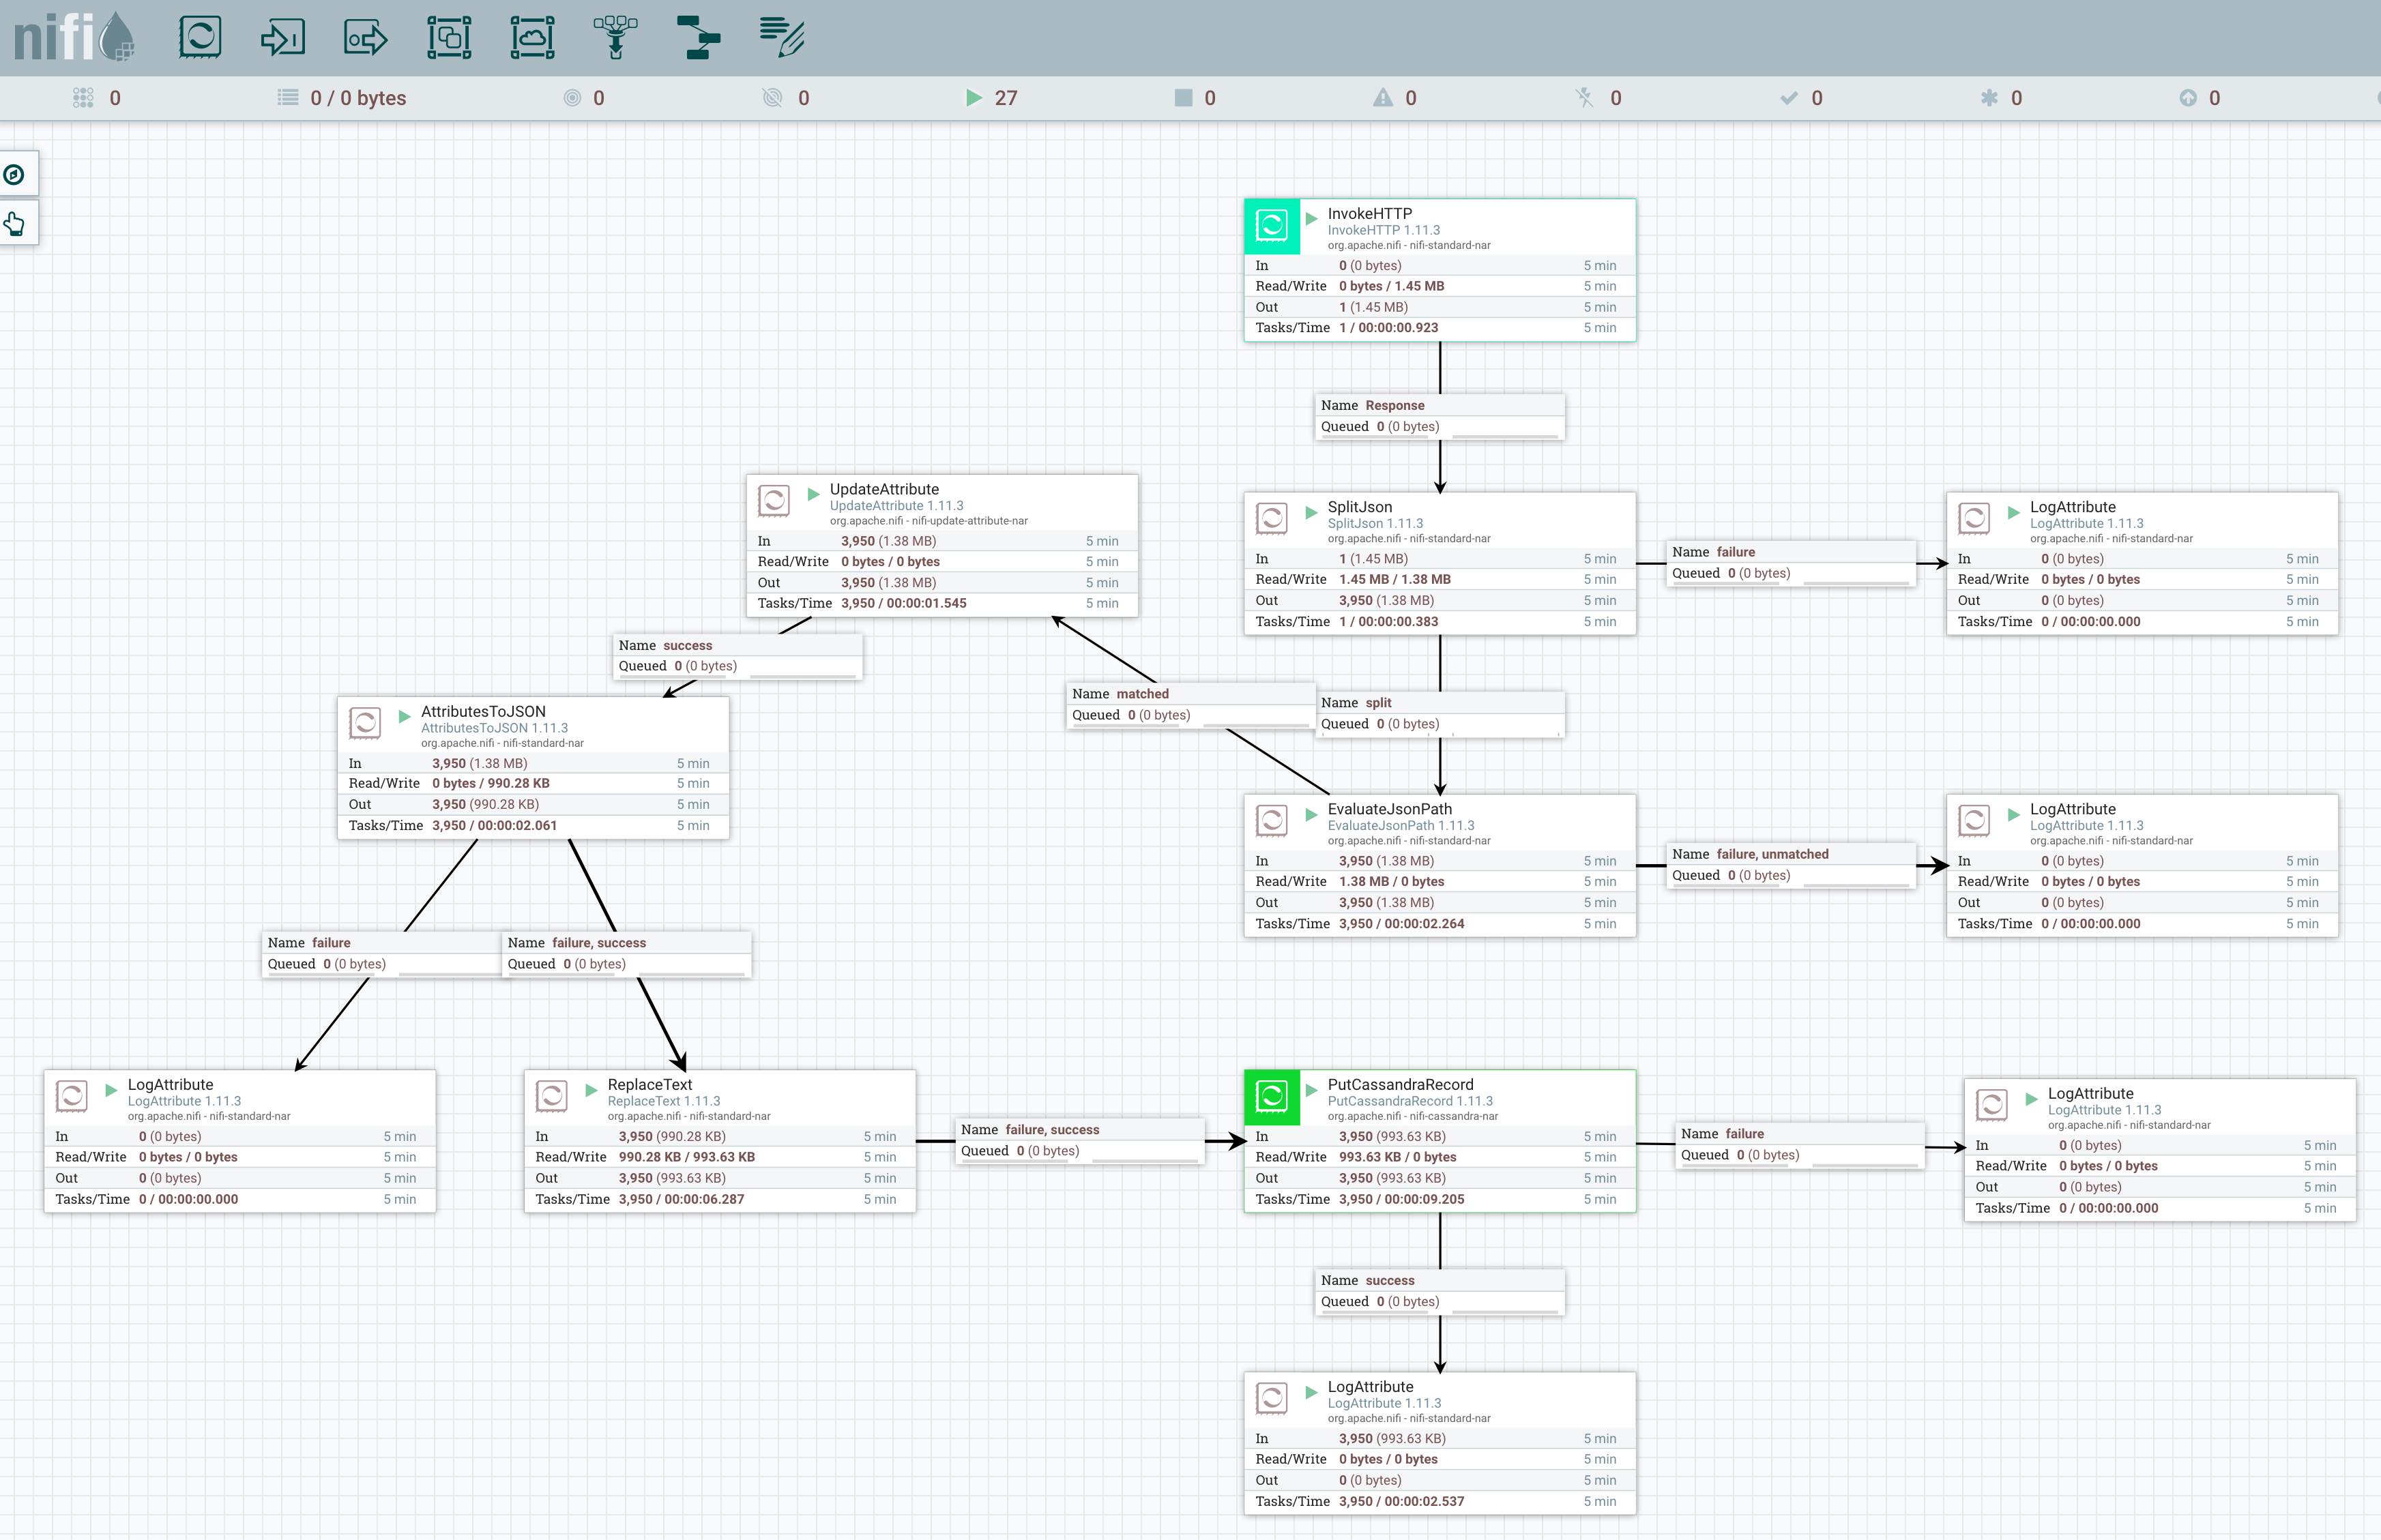
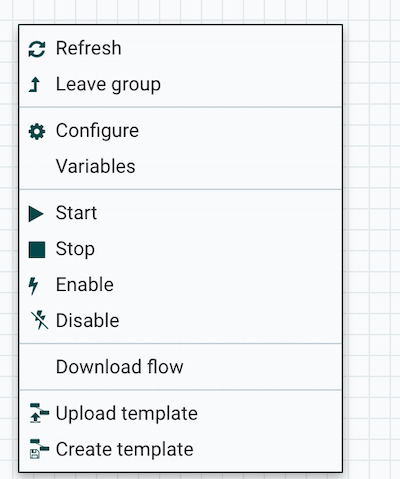
The flow described is available in the nifi folder and can be uploaded throught the mouse context menu.
The conext Menu allow to download your flow or upload a template.
The demo show case the usage of Groovy to generate the required date to be loaded as separate flows:
class Const {
  static Date lastUpdate = null;
}

static onStart(ProcessContext context) {
  Const.lastUpdate = new Date('04/23/2020')
  println "onStart $context ${Const.lastUpdate}"
}

static onStop(ProcessContext context) {
  println "onStop $context ${Const.lastUpdate}"
}

d1 = Const.lastUpdate
d2 = new Date()
(d1..d2).each {
    def flowFile = session.create()
    flowFile = session.putAttribute(flowFile, 'day', it.format('dd'))
    flowFile = session.putAttribute(flowFile, 'month', it.format('MM'))
    flowFile = session.putAttribute(flowFile, 'year', it.format('yyyy'))
    flowFile = session.putAttribute(flowFile, 'targetDate', it.format('MM-dd-yyyy'))
    REL_SUCCESS << flowFile
}
Const.lastUpdate = d2
This ensure that only the initial call is loading all the data.
The demo also shows a simple method to cleanup the received date based on different date format:
import java.text.ParseException
import java.text.SimpleDateFormat

class DateConst {

  static SimpleDateFormat DATE_FORMAT_GMT = null;
  static def datePatterns = [
      'yyyy-MM-dd HH:mm:ss',
      'yyyy-MM-dd HH:mm',
      'yyyy-MM-dd',
      'MM/dd/yy HH:mm:ss',
      'MM/dd/yy HH:mm',
      'MM/dd/yy'
    ];

}

static onStart(ProcessContext context) {
  DateConst.DATE_FORMAT_GMT = new SimpleDateFormat('yyyy-MM-dd HH:mm:ss')
  DateConst.DATE_FORMAT_GMT.setTimeZone(TimeZone.getTimeZone('UTC'))
}

def flowFile = session.get()
if (!flowFile) return

String last_update = flowFile.last_update
String parsedDate = last_update

for (f in DateConst.datePatterns) {
  try {
    SimpleDateFormat dateFormat = new SimpleDateFormat(f)
    dateFormat.setTimeZone(TimeZone.getTimeZone('UTC'))
    Date date = dateFormat.parse(last_update)
    parsedDate = DateConst.DATE_FORMAT_GMT.format(date)
    break
    } catch (ParseException pe) {
  //silent
  }
}
flowFile = session.putAttribute(flowFile, 'last_update', parsedDate)
session.transfer(flowFile, REL_SUCCESS)
Once you have imported your Flow you can run the groups to start populating your database.
As an exercies, you can add processors to populate the regions table with available regions and sub regions with their dependencies.
Lets expose our data through API using SpringBoot
The project starter pom was generated using Spring Initialzr. If you are new to spring boot a good start is to follow this excellent guide.
In order for the front-end to retreive the necessary data to build UI we are exposing three resources:
- SummaryResource
- DataPointResource
- HealthCheckResource
The application architecture is based on the Ports And Adapters Architecture, more reading here. We are also providing an ArchUnit test to verify some of the compliance.
As an exercice modify the HealthCheckResource to verify database status and/or add the region resources to expose regions and sub regions information
Visit the application.properties files and ensure the setting are aligned with your configuration:
spring.data.cassandra.keyspace-name=coronavirus
spring.data.cassandra.contact-points=localhost
spring.data.cassandra.port=9042
spring.data.cassandra.username=cassandra
spring.data.cassandra.password=cassandra
spring.data.cassandra.schema-action=create_if_not_exists
Then run the project in the springboot folder:
mvn spring-boot:runThis demo uses VueJS. A good start to lean VueJS is these two crash courses:
Let's run the dashboard!
Once you open the projet at the vuejs folder level, you can setup the projet by running the following command:
yarn installOnce that is done, you can start development by compiling and using hot-reloads for development
yarn serve --port 4242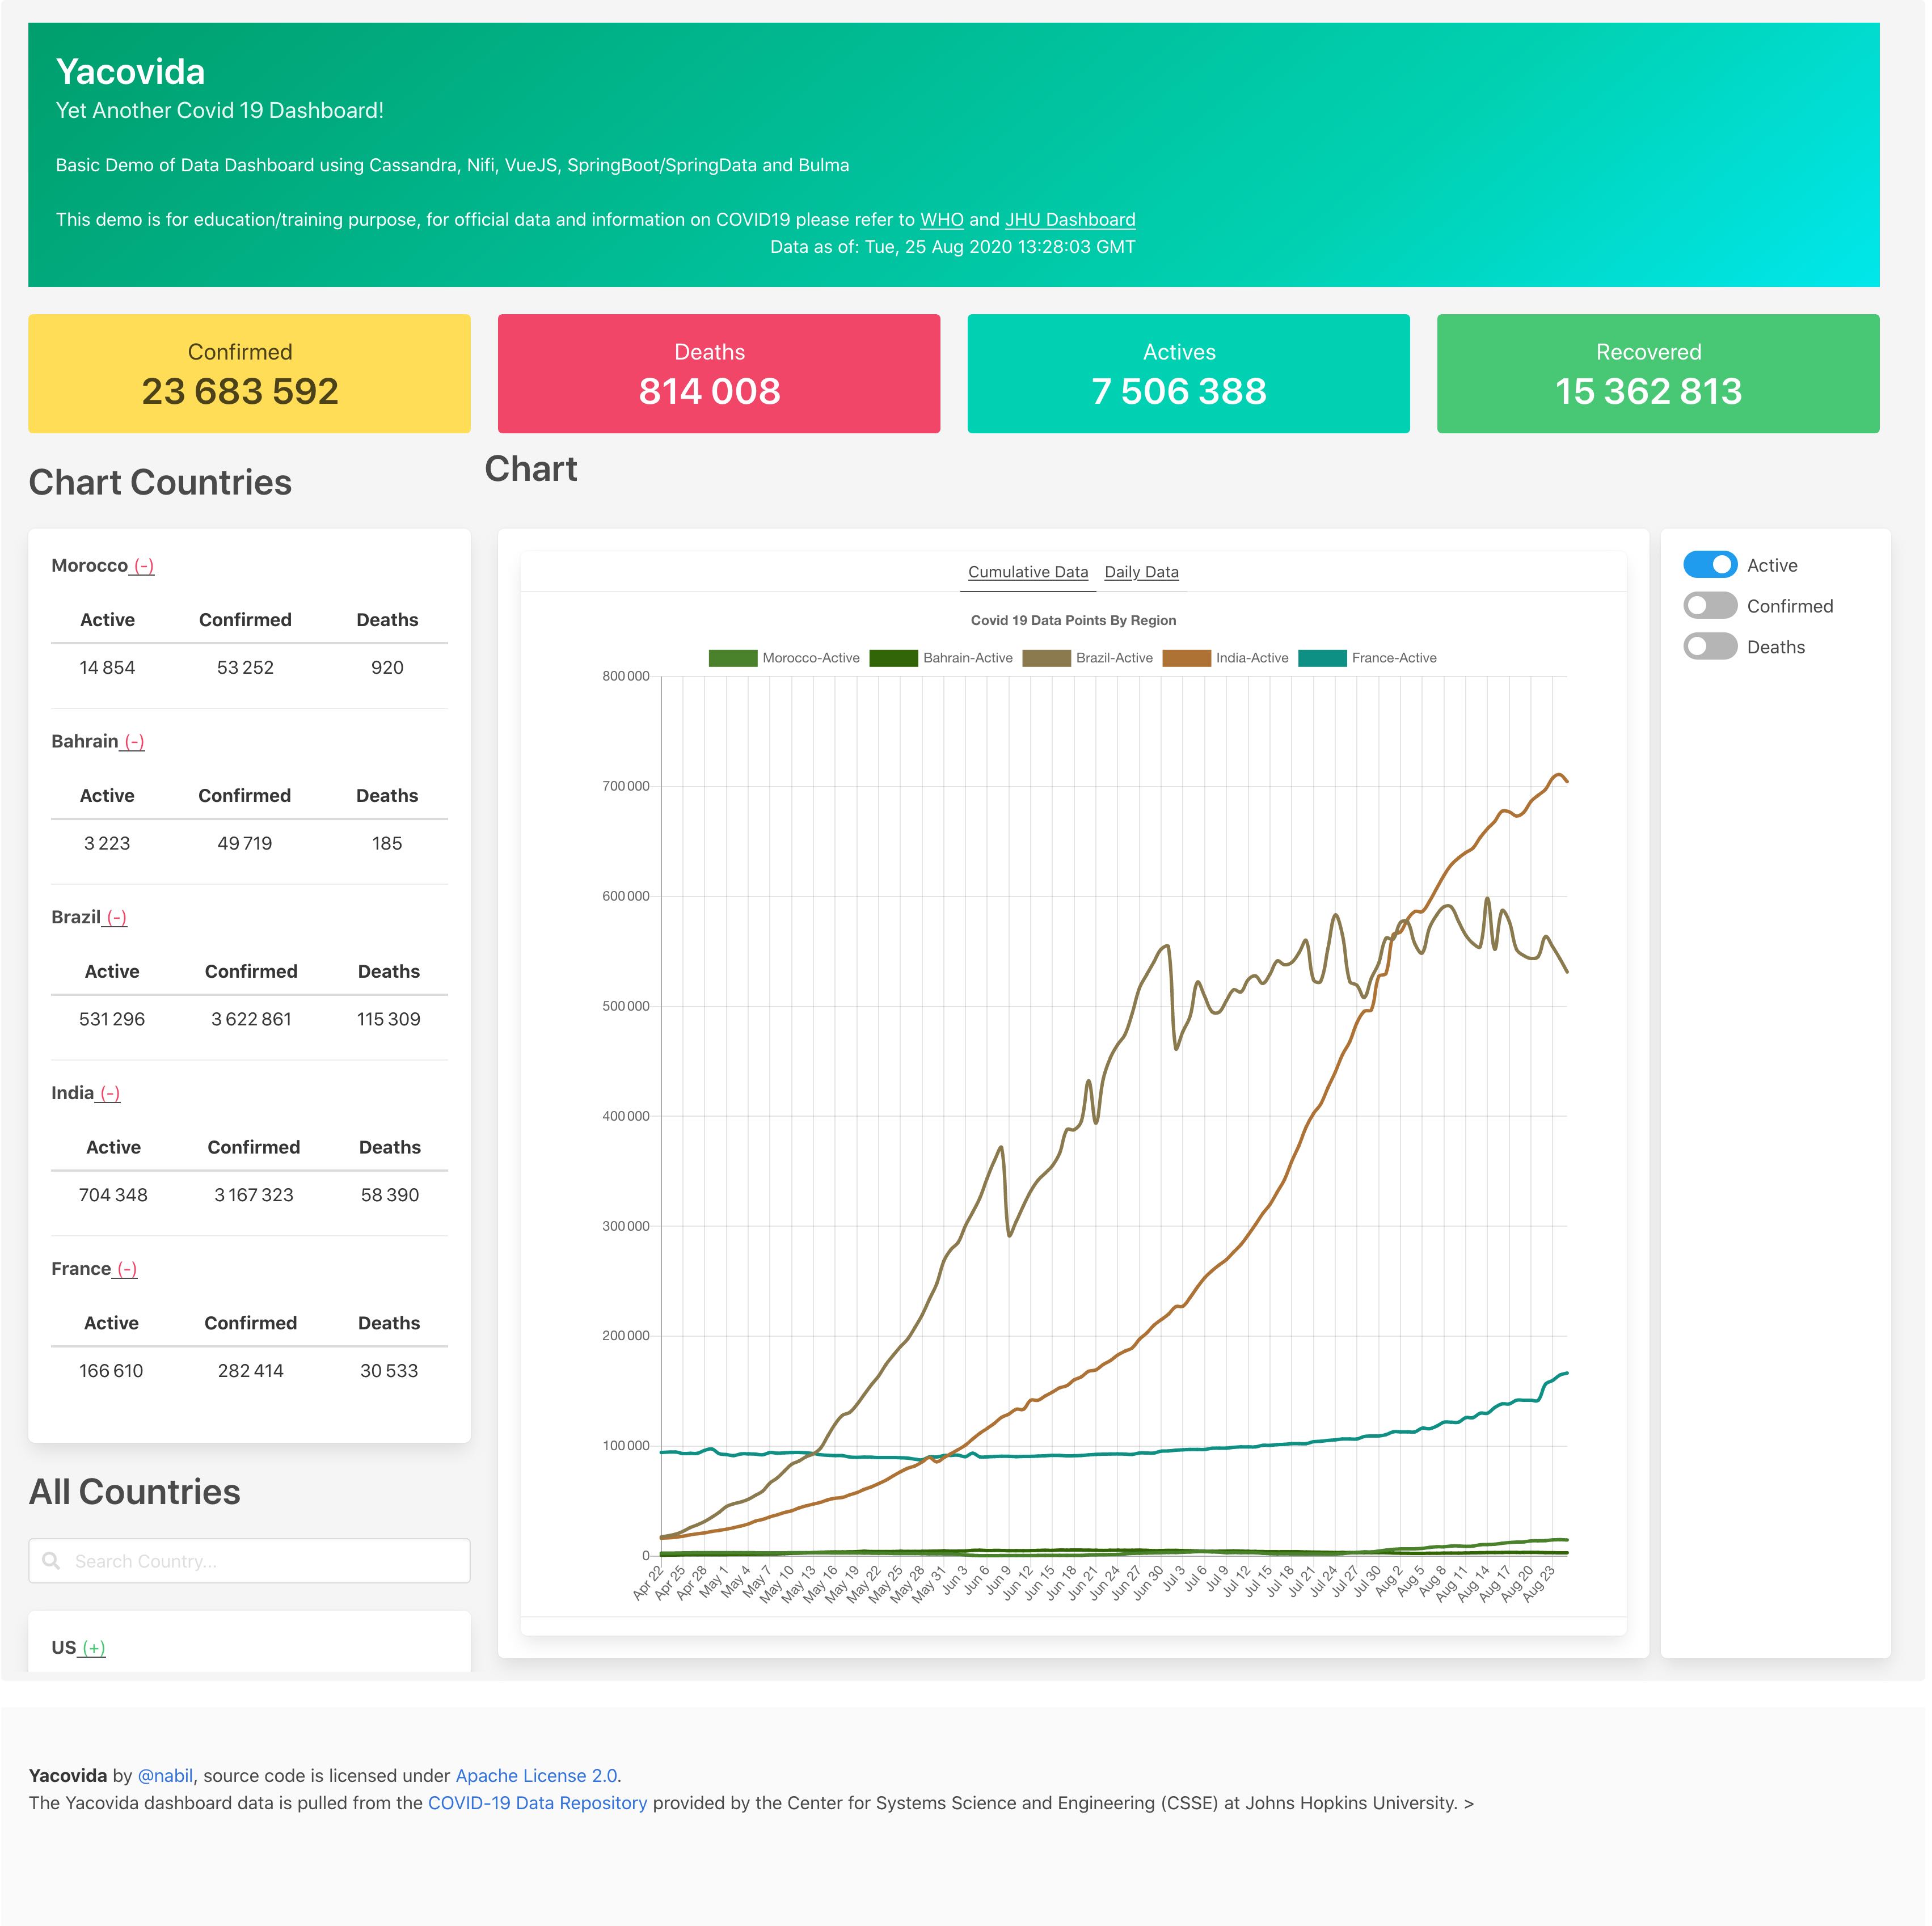
Once you are ready to publish your site, you can compiles and minifies for production
yarn buildCaching instead of API calls!
In order to reduce impact on our APIs without using any tool (Varnish etc), we can use a python script to geneate a json version of the APIs response.
python3 buildStaticData.py /path/to/data/folder/Once the data is generated, you need to modify the VueJS application main.js file to activate the caching and the URLs prefix and suffix are correctly defined:
Vue.config.cached = false;
Vue.prototype.$apiurl = Vue.config.cached ? '' : 'http://localhost:8082/';
Vue.prototype.$apiurlsuffix = Vue.config.cached ? '.json' : '';
As an exercices you can add the option to push the resulting file in an S3 bucket or another cloud service provider.
Exercices
- Add data points for the period from February 2 to April 22
- Pre-populate country information from RestCountries API service, load the country code and nativeName value in the Dashboard. See: https://restcountries.eu/rest/v2/all
- Use the Country Flag service to enrich the Dashboard with the flag information
References
- Basic Rules for Data Modeling https://www.datastax.com/blog/2015/02/basic-rules-cassandra-data-modeling
- Four Interesting Facts https://www.datastax.com/blog/2019/03/apache-cassandratm-four-interesting-facts
- Cassandra vs Relational Model | https://www.datastax.com/products/compare/relational-database-vs-nosql
- DZone | https://dzone.com/articles/introduction-apache-cassandras
- NoSQL Comparison | https://kkovacs.eu/cassandra-vs-mongodb-vs-couchdb-vs-redis
- Cassandra: The Definitive Guide | https://www.amazon.fr/Cassandra-Definitive-Guide-Distributed-Scale/dp/1098115163
- Cassandra Apache Github | https://github.com/apache/cassandra
- PRIMARY KEY's in CQL | https://thelastpickle.com/blog/2013/01/11/primary-keys-in-cql.html
- DBMS Musing http://dbmsmusings.blogspot.com/2010/03/distinguishing-two-major-types-of_29.html
- The Distributed Architecture Behind Apache Cassandra https://blog.gft.com/blog/2017/01/24/the-distributed-architecture-behind-apache-cassandra/


