
📖 Table of Contents
You can install this package using pip:
pip install py_spoo_urlfrom py_spoo_url import Shorten, Statisticsshortener = Shortener()
long_url = "https://www.example.com"
short_url = shortener.shorten(long_url, password="SuperSecretPassword@444", max_clicks=100)
# for custom alias, put `alias=<your_choice>`
print(f"Shortened URL: {short_url}")shortener = Shortener()
long_url = "https://www.example.com"
emoji_url = shorten.emojify(long_url) # pass password and max-clicks as shown above if you want
# for custom emoji alias, put `emoji_alias=<random_emoji_sequence>`
print(f"Emojified URL: {emoji_url}")Note: The emoji sequence must contain actual emojies like 😆🤯...
The Statistics class enables you to retrieve detailed statistics for a given short code.
from spoo_me import Statistics

# Initialize Statistics with a short code
stats = Statistics(short_code="ga") # replace with the shortcode you want
# if the shortUrl is password protected you have to pass the password tooprint(f"Total Clicks: {stats.total_clicks}")
print(f"Total Unique Clicks: {stats.total_unique_clicks}")
print(f"Average Daily Clicks: {stats.average_daily_clicks}")
print(f"Clicks Analysis: {stats.clicks_analysis}")
print(f"Browser Analysis: {stats.browsers_analysis}")
# ... and more (details below)List of the analytics you can access
| Method/Attribute | Description |
|---|---|
| total_clicks | Total number of clicks on the short URL. |
| total_unique_clicks | Total number of unique clicks on the short URL. |
| average_daily_clicks | Average number of clicks per day. |
| average_monthly_clicks | Average number of clicks per month. |
| average_weekly_clicks | Average number of clicks per week. |
| last_click | Information about the last click on the short URL. |
| last_click_browser | Browser used for the last click. |
| last_click_platform | Operating system used for the last click. |
| created_at | Date when the short URL was created. |
| creation_time | Time of day when the short URL was created. |
| browsers_analysis | Analysis of browsers used for clicks. |
| platforms_analysis | Analysis of operating systems used for clicks. |
| country_analysis | Analysis of countries from which clicks originated. |
| referrers_analysis | Analysis of referrers (sources) of clicks. |
| clicks_analysis | Detailed analysis of daily clicks. |
| unique_browsers_analysis | Analysis of unique browsers used for clicks. |
| unique_platforms_analysis | Analysis of unique operating systems for clicks. |
| unique_country_analysis | Analysis of unique countries from which clicks originated. |
| unique_referrers_analysis | Analysis of unique referrers (sources) of clicks. |
| unique_clicks_analysis | Detailed analysis of daily unique clicks. |
| expired | Indicates if the short URL has expired. |
| password | Password associated with the short URL (if any). |
print(f"Creation Time: {stats.creation_time}")plt = stats.make_chart(data="browsers_analysis", chart_type="bar") # this returns an object of matplotlib
plt.show()
# ... and more (see below)
# generating countries heatmaps
plt = stats.make_countries_heatmap()
plt.savefig("heatmap.png", format="png", bbox_inches="tight", pad_inches=0.5, dpi=300,)
plt = stats.make_unique_countries_heatmap()
plt.savefig("unique_heatmap.png", format="png", bbox_inches="tight", pad_inches=0.5, dpi=300,)List of Available Charts
| Method | Description |
|---|---|
| make_chart | Create various types of charts based on the data provided. |
| Parameters | Description |
|---|---|
| data | Type of data to visualize (e.g., 'browsers_analysis', see below). |
| chart_type | Type of chart to create (e.g., "bar", "pie", "line", see below). |
| days | Number of days to consider for time-based analysis. (only for last_n_days_analysis and last_n_days_unique_analysis) |
'browsers_analysis''platforms_analysis''country_analysis''referrers_analysis''clicks_analysis''unique_browsers_analysis''unique_platforms_analysis''unique_country_analysis''unique_referrers_analysis''unique_clicks_analysis''last_n_days_analysis''last_n_days_unique_analysis'
- 'bar'
- 'pie'
- 'line'
- 'scatter'
- 'hist'
- 'box'
- 'area'
plt = stats.make_chart('browsers_analysis', chart_type="bar")
plt.show()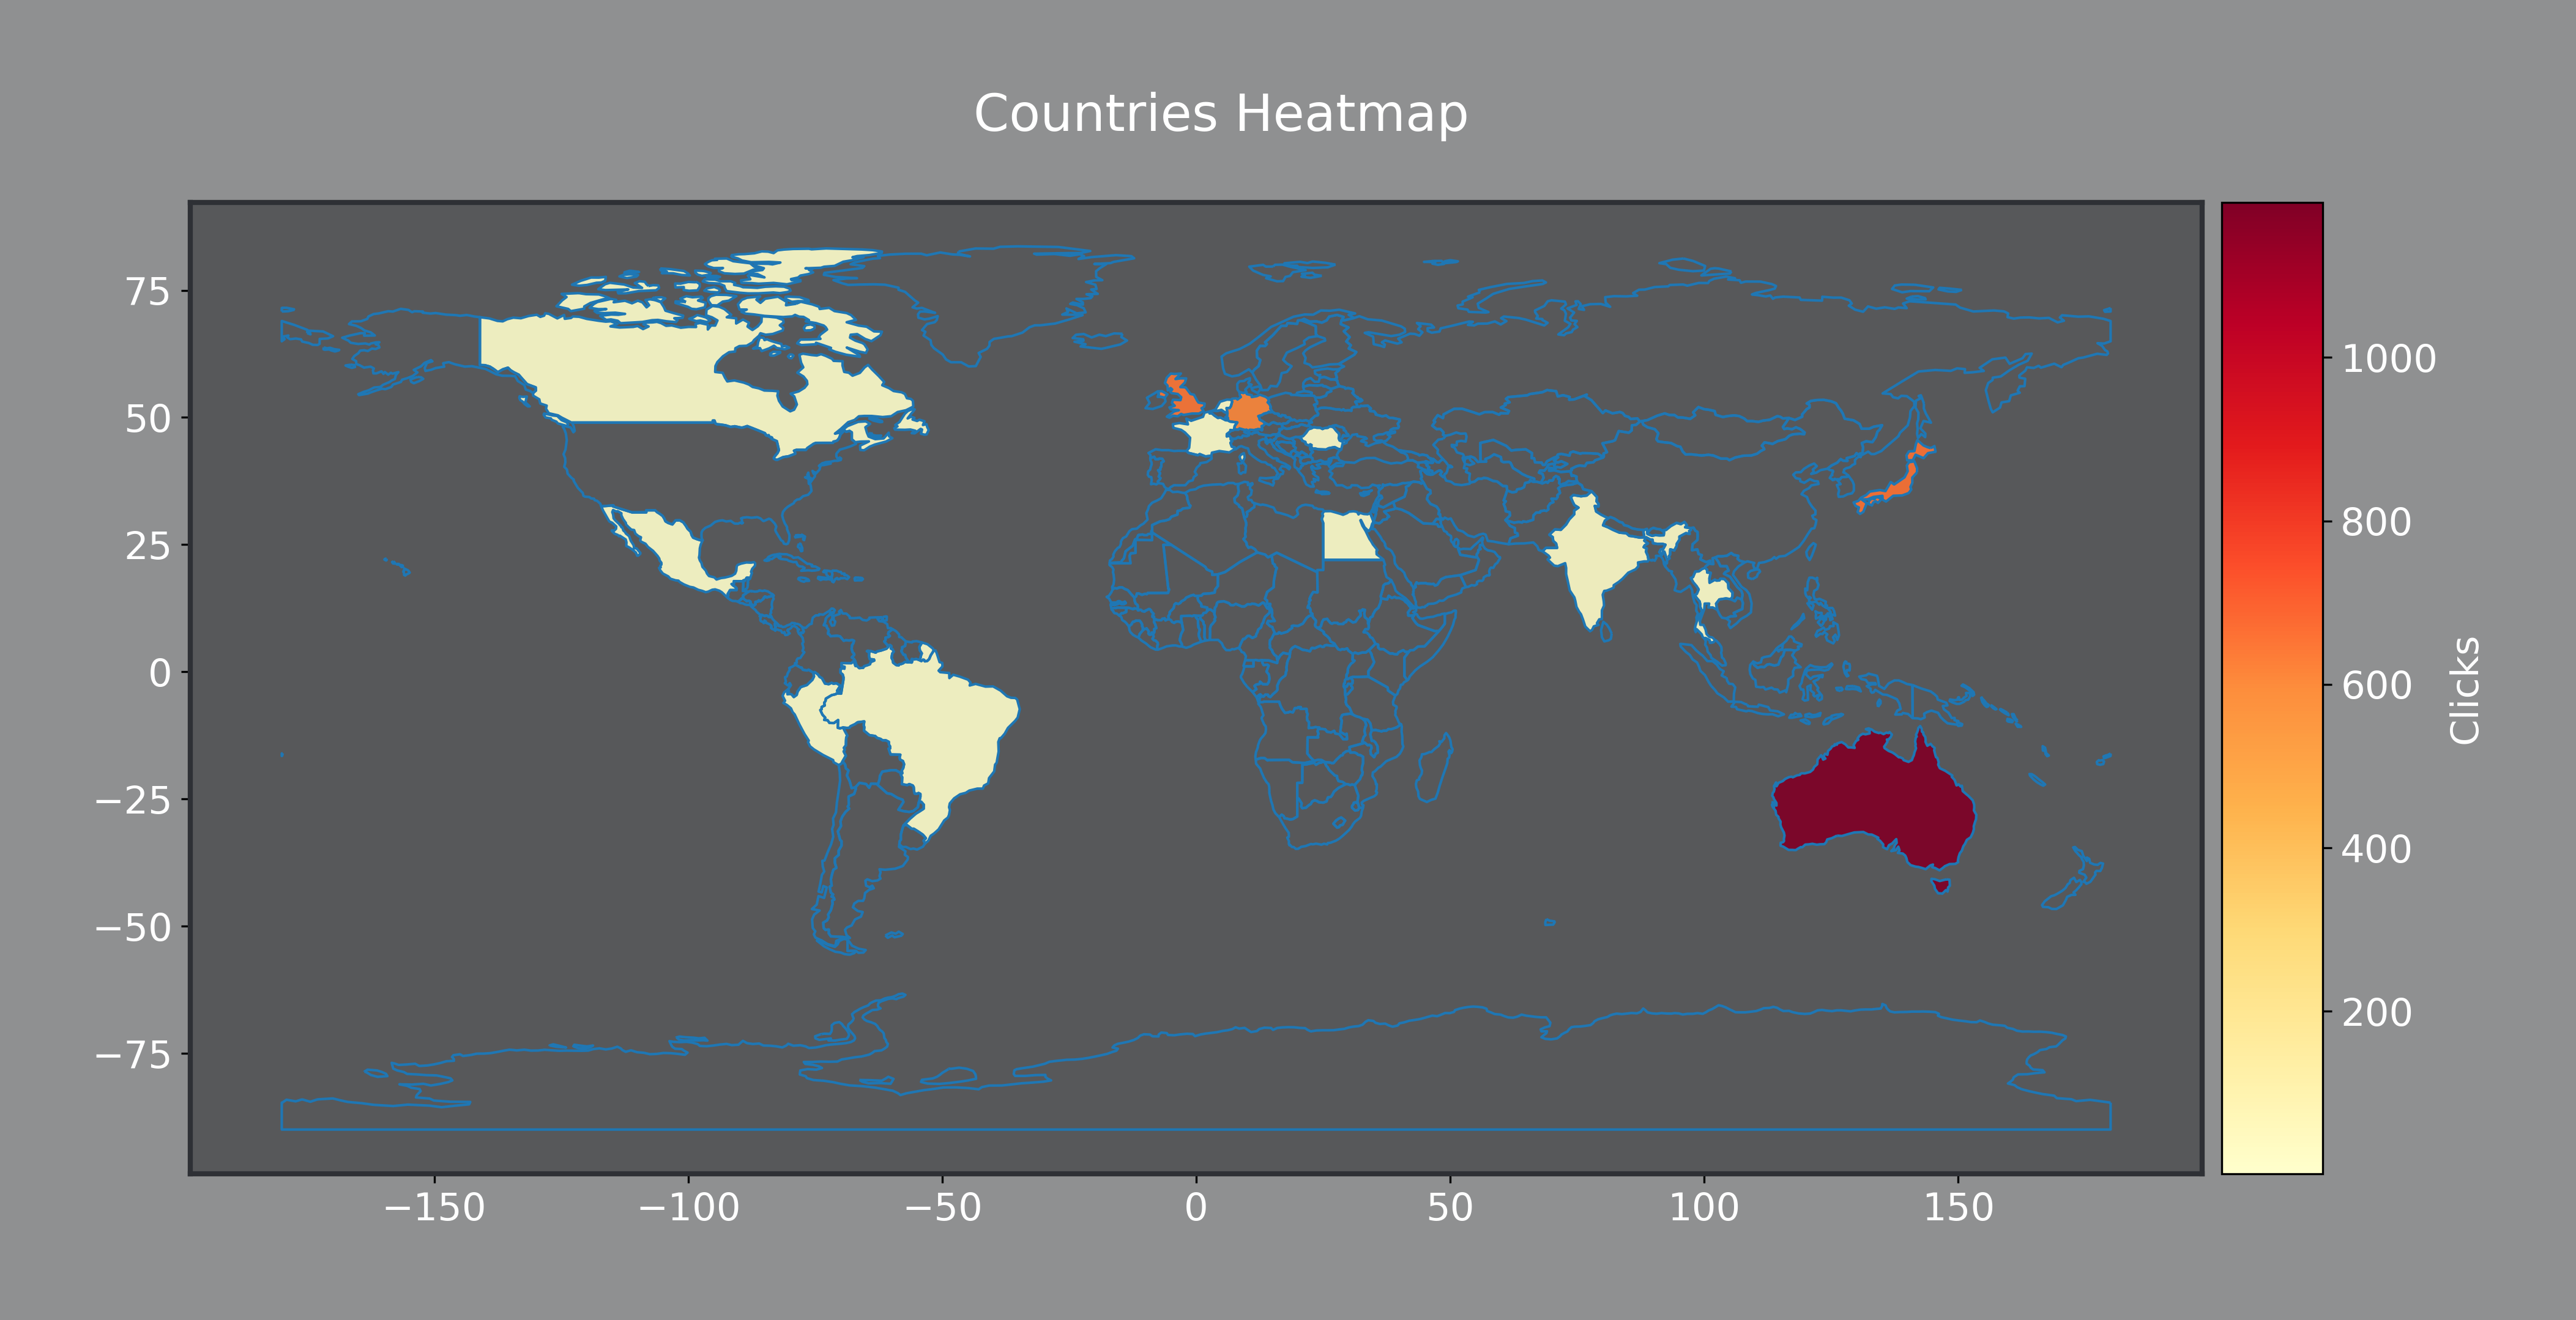
You can export the statistical data to various file formats, including Excel, CSV, and JSON:
# Export data to Excel
stats.export_data(filename="stats_export.xlsx", filetype="xlsx")

# Export data to CSV and compress into a ZIP file
stats.export_data(filename="stats_export", filetype="csv")

# Export data to Json
stats.export_data(filename="stats_export.json", filetypes="json")matplotlib: For creating charts and visualizations.requests: For making HTTP requests to the Spoo.me API.pandas: For handling and manipulating data in tabular form. 🐼geopandas: For creating geographical visualizations. 🌎
All of the dependencies are automatically installed while installing the package but in case of any errors, you can install all of the dependencies listed in the requirements.txt file.
To see the error codes returned by the API, please visit https://spoo.me/api
If you encounter any issues or have questions about using the Spoo.me Python package, please open an issue on the GitHub repository.
Contributions are welcome! If you have ideas for improvements or new features, feel free to fork the repository, make your changes, and submit a pull request
This package is licensed under the MIT License - see the LICENSE file for details.


