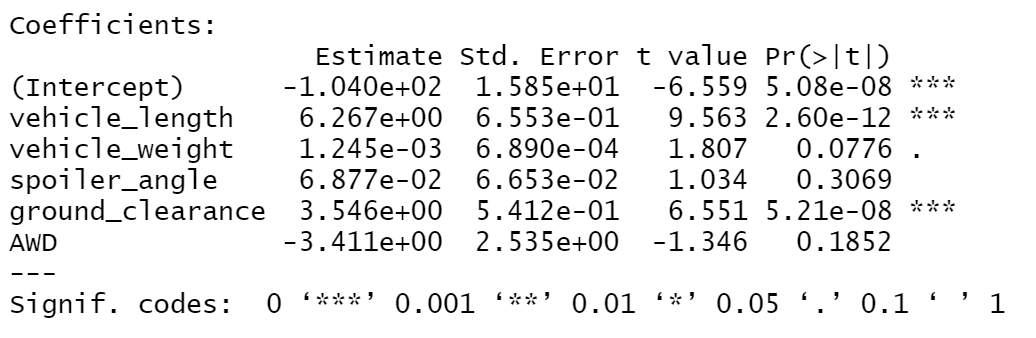
 From the above results, we see that vehicle length and ground clearance contributed essentially zero amounts of random variance. This means they have a large impact on the MPG of the vehicle.
Because our p-value is far below 0.05%, we can safely reject the null hypothesis, meaning the slope of our linear model is not zero.
Although we have a good p-value, since only two of our five variables are significant, this could be an example of oversampling

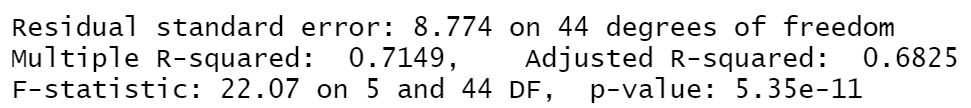
 For all manufacturing lots combined, the PSI variance is 62.3, well within range for MechaCar design specifications.
However, when splitting up the data by lot, we see that Lot3 has a variance of 170.3, much higher than the required limit of 100.
From this analysis, I would say there needs to be an investigation into Lot3’s manufacturing process.
For all manufacturing lots combined, the PSI variance is 62.3, well within range for MechaCar design specifications.
However, when splitting up the data by lot, we see that Lot3 has a variance of 170.3, much higher than the required limit of 100.
From this analysis, I would say there needs to be an investigation into Lot3’s manufacturing process.


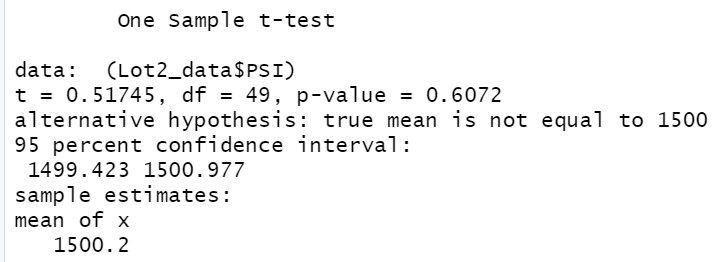
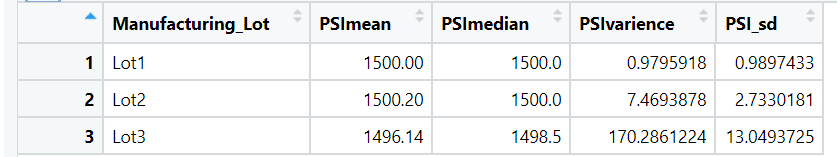
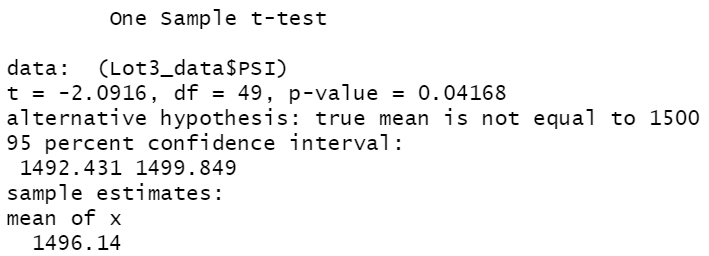 From the T-tests, we see that only Lot3 has a p-value below 0.05, which means it is the only lot where we can reject the null hypothesis. This, along with previous examples, show that something is most likely going wrong in lot3
In comparing MechaCar to the competition, the null hypothesis would be that their cars perform the exact same. The alternative hypothesis would be MechaCar cars performing differently (ideally better) than the competitor. My study would start by finding similar cars between the manufacturers, (for example, their MiniVan model/s) and then comparing price, MPG, safety, etc. A possible test would be finding the mean safety rating across all car models from each company, including a variance calculation. If there is a high variance, it could imply one specific model has safety issues, and then a more thorough investigation could be done.
